∎
77email: suryamondal@gmail.com, vivek.datar@gmail.com, majumder.gobinda@gmail.com, spethuraj135@gmail.com, ravitifr@gmail.com, bsn@tifr.res.in 88institutetext: Suryanarayan Mondal 99institutetext: S. Pethuraj 1010institutetext: Homi Bhaba National Institute, Anushaktinagar, Mumbai, India
1111institutetext: N. K. Mondal 1212institutetext: Saha Institute of Nuclear Physics, Bidhannagar, Kolkata, India
1212email: nabak.mondal@gmail.com
Study of Particle Multiplicity of Cosmic Ray Events using 2 m 2 m Resistive Plate Chamber Stack at IICHEP-Madurai
Abstract
An experimental setup consisting of 12 layers of glass Resistive Plate Chambers (RPCs) of size 2 m 2 m has been built at IICHEP-Madurai ( N E) to study the long term performance and stability of RPCs produced on a large scale in Indian industry. This setup has been collecting data triggered by the passage of charged particles. The measurement of the multiplicity of charged particles due to cosmic ray interactions are presented here. Finally, the results are compared with different hadronic models of the CORSIKA simulation.
Keywords:
cosmic ray experiments cosmic ray detectors hadronic interaction models1 Introduction
The 50 kton INO-ICALinowhite is a proposed underground high energy physics experiment at Theni, India ( N E) to study the neutrino oscillation parameters using atmospheric neutrinos. The primary aim of the experiment is to determine the sign of the mass-squared difference using matter effects. The ICAL detector can also be used to probe the value of leptonic CP-phase and last but not the least to search for physics beyond the standard model using neutrino oscillations. The Resistive Plate Chamber (RPC)rpc_p1 ; rpc_p2 has been chosen as the active detector element for the ICAL detector. As part of the ICAL R&D program, a 12-layer stack of 2 m 2 m RPCs have been operational at IICHEP, Madurai ( N E, on the surface, 160 m above mean sea level) since the last few years. The various detector properties like position and time resolution of RPCs, detector efficiencies, strip multiplicities, detector noise, etc. are studied using this RPC stack to understand the performance and long term stability of the RPCs. The same data are also used to study the cosmic ray muons pethu1 . The data collected near magnetic equator gives us vital information regarding the capabilities of the simulation packages.
High energy primary cosmic rays originating in outer space continuously interact with the earth’s atmosphere. These cosmic rays consist of mostly protons with a smaller fraction of higher Z-Nuclei elements pdgspectra1 . The angular distribution of primary cosmic rays is more or less isotropic at the top of the earth atmosphere. The energy spectrum of the primary cosmic rays follows a power-law spectrum, , where power-law parameter, 2.7. The shower of particles (called secondaries) consists mainly of pions and kaons which are produced due the interactions of primary cosmic rays with atmospheric nuclei. The neutral pions mainly decay via electro-magnetic interactions, whereas the charged pions decay to muons and neutrinos via weak-interactions, and . The kaons also decay to muons and neutrinos and to pions in different branching fractions. Most of the pions and kaons decay in flight and do not reach the earth’s surface, whereas only a small fraction of resultant muons decay into electrons and neutrinos, and . The , do not reach the detector directly as they interact with the roof of the laboratory and create electromagnetic showers. Thus, muons are the most abundant charged particle from cosmic ray showers detected in the present setup. These atmospheric muons are produced at high altitude (average height of 20 km) in the atmosphere and lose almost 2 GeV energy via ionisation loss in the air before reaching the ground. The density of charged particles (mainly muons) per unit surface area at the earth’s surface depends on the composition of primary cosmic ray, power-law parameter () as well as the model of hadronic interactions at high energy which is not accessible in the laboratory.
The principal aim of this work is to observe the charged-particle multiplicity in the atmospheric muon data collected at IICHEP, Madurai and compare it with the air shower simulation. Most of the secondary particles reaching the surface of the earth are having low energies which are produced by the interactions of the cosmic primaries with the air at center-of-mass energies much lower than 10 GeV, where the hadronic interaction is better understood corsika763 . The distribution of charged-particle multiplicity is thus expected to be dominated by the composition of primary cosmic ray and the spectral index, .
In this paper, the detector setup is described in Section 2. The Monte-Carlo simulation used to study the multiplicity is explained in Section 3, where primary cosmic ray interactions are simulated using the CORSIKA Packagecorsika763 and interactions of the particle with detector material is simulated using the GEANT4 toolkitgeant4 . The method of Hough Transformation which is used to find the trajectory of charged particle and the data selection criteria used for the analysis are discussed in Section 4. Finally, the results of the analysis are summarised in Section 5.
2 Detector Setup
The RPC stack operational at IICHEP, Madurai consisting of 12 RPCs stacked horizontally with an inter-layer gap of 16 cm is shown in Figure 1.
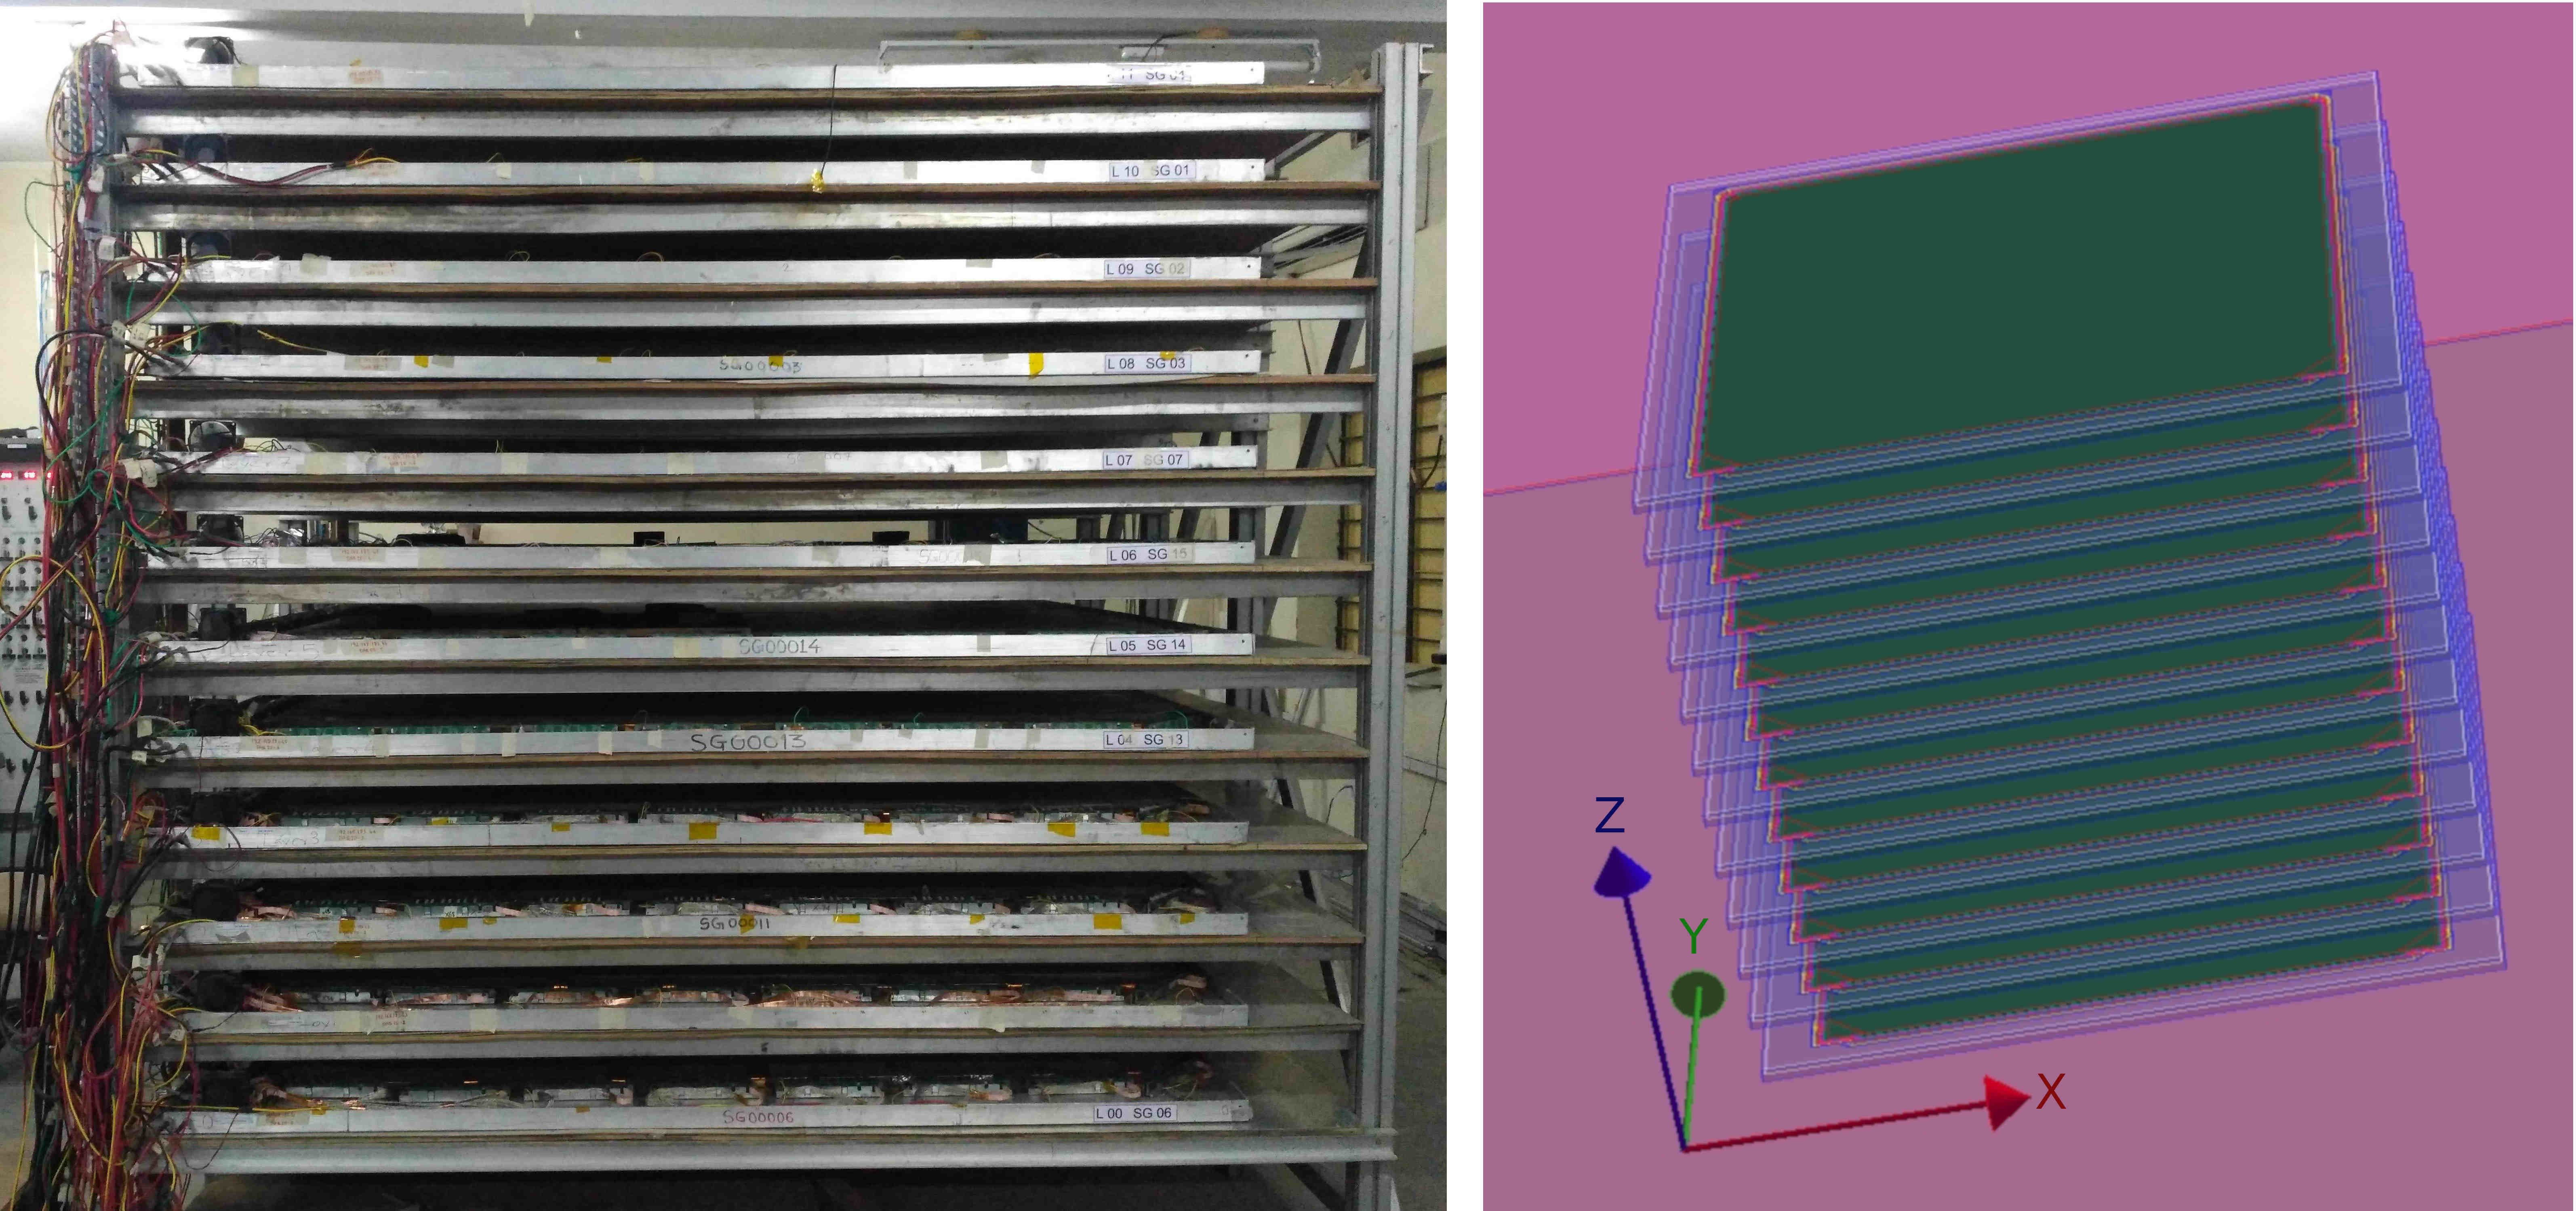
An RPC gap is made of two glass electrodes of thickness 3 mm with a gap of 2 mm between them. This gap is maintained using 2mm thick poly-carbonate buttons. The glass gap is sealed on the outer edge to make it air-tight. A non-flammable mixture of gas is continuously flown inside the glass gaps which serve as the active medium of the detector. In avalanche mode, the mixture of gas consists of R134a (95.2%), iso-C4H10 (4.2%) and SF6 (0.3%). Both the outer surfaces of the glass gap are coated with a thin layer of graphite. The RPCs are operated by applying a differential supply of 5 kV to achieve the desired electric field. The avalanche created by the ionisation energy loss of charged particles in the RPCs induces signals in the two orthogonal pickup panels placed on both sides of the glass gaps labelled as X-side and Y-side. The pickup panels are made of parallel copper strips of width 28 mm with 2 mm gap between two consecutive strips. The RPCs used in this detector stack are of the size of 1790 mm 1890 mm. There are 60 strips on the X-side and 63 strips on the Y-side for each layer.
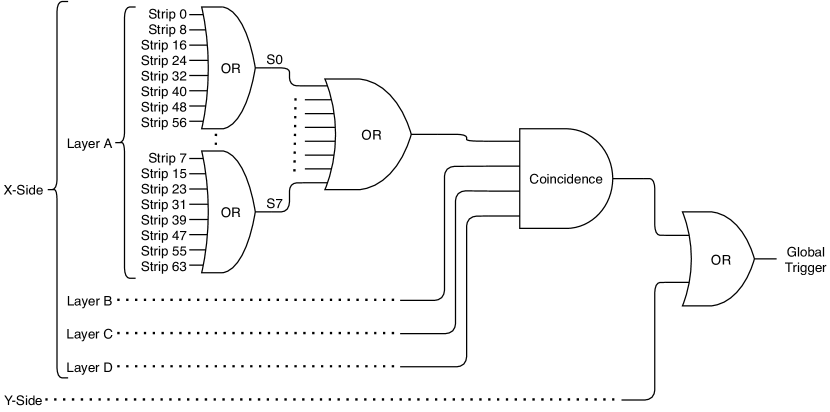
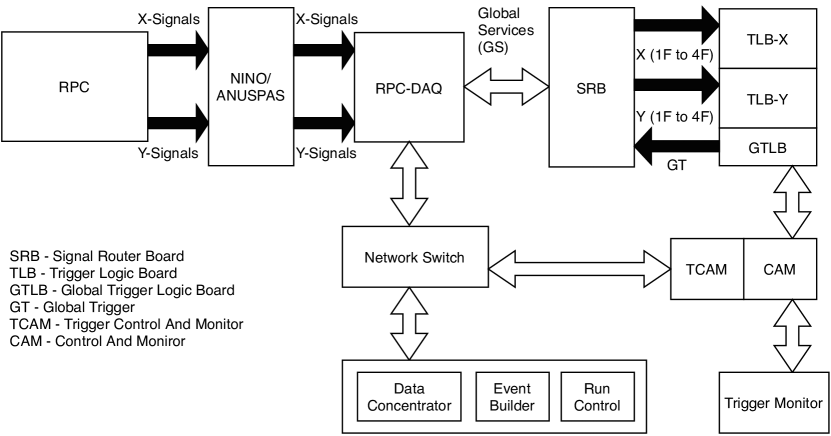
The induced signals from the pickup strips are amplified and discriminated by a charge sensitive NINOnino amplifier-discriminator board. In layer 11 (top-most layer), the ANUSPARSH ASICanusp which is a CMOS, 8-channel, high speed, low power amplifier-discriminator designed for avalanche mode of operation for RPCs is used to study its performance. The discriminated signals from these boards are passed to the FPGA-based RPCDAQ-board. The individual signals from every 8th strips are ORed to get pre-trigger signals (S0 to S7), which are passed to the Trigger system module via Signal Router Board. The coincidence is done for X- and Y- sides independently in the Trigger Logic Boards. The Global Trigger is then generated by the Global Trigger Logic Board (GTLB) by ORing the coincidences formed in X- and Y-side. The trigger scheme of the detector setup contributed by 4 RPC layers is elastrated in the Figure 2.
The hit signals in the RPCDAQ board stretched to 1 s to overcome trigger latency of 770 ns from Trigger System to RPCDAQ. Based on the arrival of trigger signals to RPCDAQ, the event signals are latched and sent to the Data Concentrator and the Event Builder via Network Switch. The flow of signals in the Detector setup are shown in Figure 3.
The detailed description of signal processing and the Data Acquisition system (DAQ) can be found in elec1 . The present work is based on the coincidence of pre-Triggered signals from layers 4, 5, 6 and 7 within a coincidence window of 100 ns. While the layers in the middle portion of the detector are used to form the trigger, the layers in both the top and bottom portions of the detector also contributes in forming an event, which in turns maximises the length of the track in the detector.
Although the coincidence window is 100 ns, the signals from any other particles as well as noise signals occurring within a time window of -230 ns to 770 ns after generation of the trigger are also recorded due to stretching of the hit signals and the trigger latency. An event typically contains hit information (one logic bit per strip indicating the signal in that strip) for each strip and 16 time signals for each layer; 8 for X-side and other 8 for Y-side. One TDC (Time-to-Digital Converter) channel with least-count of 0.1 ns records time signals coming from every alternating 8th strips (S0 to S7). Approximately 250 millions of cosmic ray events recorded in the detector during the total observation period between August 23, 2017 to September 8, 2017 with a trigger rate of 230 Hz are used for the analysis.
3 Monte-Carlo Simulation
The Monte-Carlo Simulation for this study has been performed in two stages. Extensive Air Shower (EAS) has been simulated by the CORSIKA. The information of daughter particles generated by EAS at the earth’s surface level has been extracted and used as the input to the detector simulation. The detector simulation has been performed using the GEANT4 toolkit.
3.1 Extensive Air Shower
The CORSIKA (COsmic Ray SImulations for KAscade) corsika763 developed to study the evolution of EAS in the atmosphere initiated by cosmic ray particles. Though the CORSIKA has been developed for a specific experiment, it has now developed into a tool that is used by many groups studying cosmic rays and EAS. In the present scenario, existing extrapolation of hadronic interaction models of high energy particles in EAS is based on various theoretical models, which has large uncertainties. The current experimental data at the collider experiment is insufficient to predict the hadronic interactions at very high energies. In the CORSIKA package, the several different hadronic interaction models are available. In this study, for simulating the behaviour of hadrons for higher energy range, the QGSJET (Quark Gluon String model with JETs)corsika763 has been adopted and for the low energy range (less than 80 GeV in laboratory frame), the GHEISHA model has been used.
In this study, the primary cosmic ray shower has been simulated using the CORSIKA(v7.6300) Package. The energy of the primary rays in the CORSIKA is generated using the power-law spectrum, , within the energy range of – GeV for different primaries (H, He, C, O, Si and Fe). The zenith and azimuth angle of primary particles are generated uniformly within the range of – and –, respectively. The magnetic rigidity cutoff has been implemented according to the location of the detector. The minimum energy cutoff for hadrons, muons, electrons and photons in the simulation is kept at 50 MeV, 10 MeV, 1 MeV and 1 MeV, respectively. These cutoff values are much smaller than the minimum momentum cutoff for the charged particles in the vertical direction, MeV at 1 GeV energy, which is mainly due to 22 cm of concrete roof of the building where the detector is placed pdgspectra1 .
The particles generated by the CORSIKA at the observation surface are provided as an input to the detector simulation. The observation plane has been divided into squares of the size of 2 m 2 m which is shown in Figure 4.
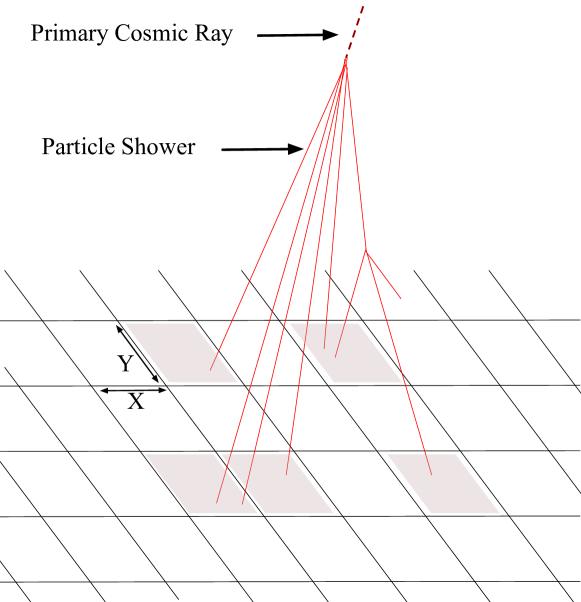
An event is formed using the information of the particle(s) passing through each of these rectangles shown as shaded regions in Figure 4.
3.2 Detector Simulation
The detector simulation has been performed using the GEANT4(v4-10.0.2) toolkit. The events from the CORSIKA simulation are propagated in the detector simulation. A realistic depiction of the detector setup including the building where the detector is housed has been constructed in the GEANT4 environment. The properties of various materials of the detector components and the laboratory building are chosen based on the knowledge of the setup. The uncertainty of the material budget is taken as a systematic error. The standard physics processes of matter-particle interactions like electromagnetic, ionisation, decay and hadronic interactions (QGSPBERTHP), which are available within the GEANT4 toolkit geant4 are implemented in the simulation.
The various detector’s parameters (efficiency, noise, strip multiplicity and resolution) are calculated with the help of cosmic ray passing through the detector. The current setup is a tracker type detector consisting of 12 layers of RPCs. When one layer of the setup is studied for the detector parameters; the rest of the layers in the setup serve as the tracker for the passing particles. Since the layers forming the coincidence cannot be studied for the detector parameters, the data sets with two more different trigger combinations (using layers 1,2,3,4 and 7,8,9,10 to form coincidences) of the duration of one day, are used in order to study all the RPCs in the setup.
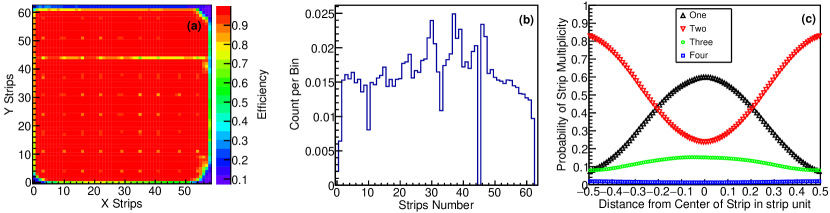
Each of the RPC detectors can be divided into a matrix of pixels of size 3 cm 3 cm. The efficiencies of each of the pixels are calculated and represented as the efficiency map for each of the RPCs. The track(s) of the particle(s) in an event is fitted with the straight line by excluding the RPC layer being studied from the fit. For each pixel in that RPC layer, the total number of particles passed through it is estimated from the extrapolated position in that layer. The ratio of the number of events with valid hit signal in X- (or Y-) strips of that pixel to the total number of particles passed through it is taken as the efficiency for X- (or Y-) side of that pixel. The noise in a RPC is defined as the hits occurred farther from the expected position of the passing particle. The strip multiplicity profile is defined as the probability of sharing signal between neighbouring strips with respect to the hit position from the centre of the strip. The strip multiplicity is discussed in the next section. A detailed study of these parameters is presented in pethu1 . The efficiency map, noise and strip multiplicity profile for one of the RPCs in the stack is shown in Figure 5.
These observed detector parameters are included in the digitisation stage of the detector simulation. The events from the cosmic ray data and the detector simulation are reconstructed using an algorithm based on Hough Transformation which is discussed in the next section.
4 Event Reconstruction and Data Selection
For the event reconstruction, the strips hits are analysed separately, in the 2-dimensional projections namely, X–Z and Y–Z side. When a charged particle passes through the RPC, the number of strips on which signal is induced depends on the gain of the gas gap. The sharing of the induced signal between the neighbouring strips is the main reason for the observed strip multiplicity shown in Figure 5(c). During the study, the position resolution is calculated for different strip multiplicities of 1, 2, 3, and 4 and the values observed are 6 mm, 8 mm, 12 mm and 22 mm respectively. The position resolution for strip multiplicity more than four is larger than the pitch of the strip (3 cm). In the present study, the clusters are formed with a maximum of 4 consecutive strips as the position resolution for higher multiplicities is found to be worse. A layer which has more than 15 strip hits or more than 10 clusters are tagged as ‘noisy layer’ and not considered in track reconstruction. The first criterion has been chosen near the maximum number of possible hits if 4 tracks pass through a RPC. In fact, the maximum number of tracks reconstructed in an event is 4 which is discussed in the Result section. The second cut is set at the first cut divided by the average strip multiplicity in the detector stack to reject noisy events passed through the first cut. An event which has more than 3 noisy layers is considered as ‘noisy event’ and discarded. This cut is set at 3 layers which is 25% of maximum layers available for the event reconstruction. This cut has been set by balancing the performance of the reconstruction method and number of events lost due to this cut.
In the first step of track reconstruction, the clusters associated with different tracks are grouped using the method of Hough Transformationhought1 ; hought . The equation of the straight line, used to find the association between the hits, is given as,
| (1) |
The - plane (called as Hough Space) is populated using the concept of Cellular Automatoncellular . For a sample event shown in Figure 6(a), the populated - plane is presented in Figure 6(b).
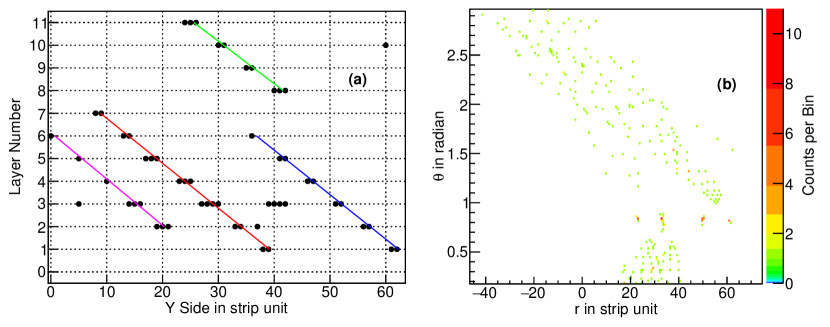
The advantage of using Cellular Automaton technique is the significant reduction of computation time to find a trajectory in the event. This method can detect all the tracks avoiding the noise hits as shown in Figure 6(a).
The tracks are identified using the Hough Transformation are fitted by a straight line given by the equation,
| (2) |
where and are the slope and the intersect, respectively. The number of detector layers in the fit and /ndf of the fit are shown in Figure 7(a) and 7(b) respectively.
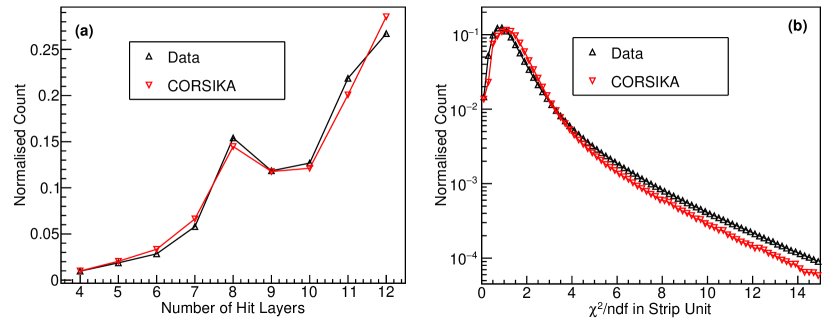
A track is considered as reconstructed if the /ndf is less than 10 and there are more than 4 layers in the track. The reconstruction efficiency is defined as the ratio of the number of events with at-least one reconstructed track with the total number of triggered events. The reconstruction efficiency as a function of time is shown in Figure 8.
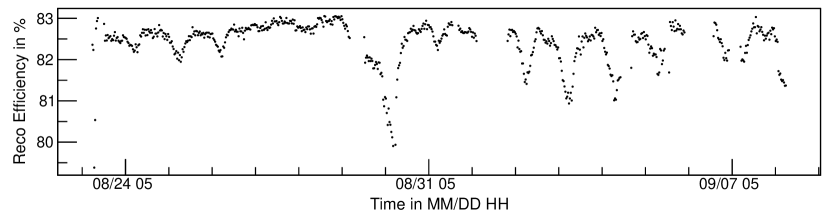
It can be observed that the reconstruction efficiency varies periodically which is correlated to the variation of atmospheric pressure and temperature rpcleak . This periodic change in efficiency does not affect the relative ratio of multiple track events. The pure multiple track events are 0.01% of triggered events. Out of the total triggered events, 6–7 % of events are due to noise and hadronic showers initiated at the roof. Any such ambiguous events are rejected by the selection criteria discussed in the following.
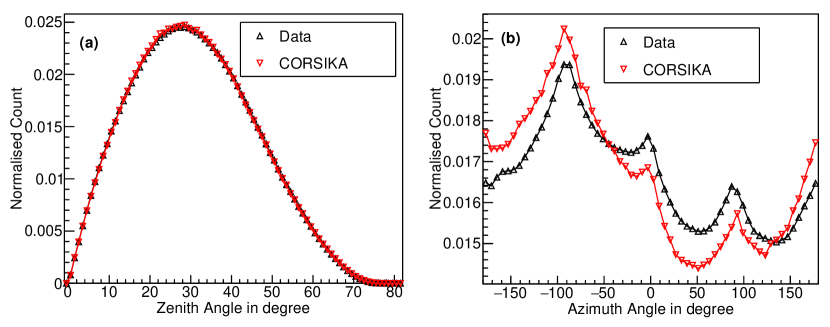
The zenith and azimuth angle distributions of the reconstructed tracks are presented in Figure 9(a) and 9(b), respectively.
The projections from both X–Z and Y–Z sides are combined to produce final 3-dimensional track(s). The ‘Fake Tracks’ may arise while combining the projections. A Fake track is defined as a reconstructed track which does not correlate to the X- and Y-side projection of the trajectory of a true particle but instead is formed due to the mismatch of the projections from separate particle. Any such ‘Fake Tracks’ are discarded by using the timing information.
The events of interest for this analysis are the events with more than one reconstructed 3-dimensional track. The distribution of the time separation between each pair of tracks for both simulation and data are shown in Figure 10(a).
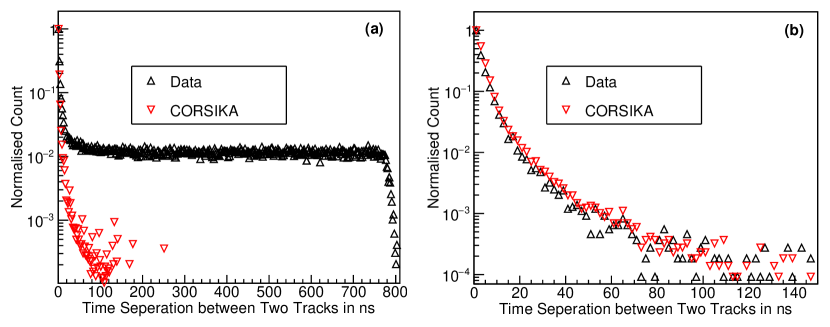
In the case of data, it can be observed that there is a significant number of events where multiple particles are reaching the detector with large relative time delay. The random coincidence of particles originating in the different cosmic showers are the cause for these events. The random coincidence of particles from different cosmic showers are absent in the simulation as only one shower is simulated at a time in the CORSIKA. So the following procedure is adopted to reject the random coincidences from the events which have been initiated at the same showers.
In the simulation, it is observed that the particles originating from the same shower are detected in the RPC stack as parallel tracks. This can be verified by calculating the skewed angle between each pair of tracks reconstructed in an event. The value of skewed angle is ideally supposed to be zero in case of parallel tracks, but due to finite size of the strip width and multiple scattering it has finite width and tails. The distribution of the skewed angle between each pair of tracks reconstructed in an event from both simulation and data is shown in Figure 11(a).
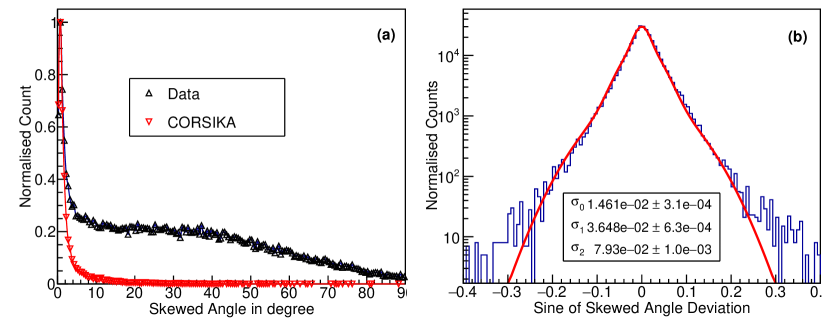
Now, only the parallel tracks are of importance in this study because of their same origin. In order to define the parallel tracks reconstructed in this detector setup, good understanding about the resolution of skewed angle is necessary. To understand the application of the skewed angle, events with multiple particles are simulated in the GEANT4. The skewed angle between a generated pair of tracks is calculated using their generated directions. The skewed angle between the same pair of tracks is also estimated from the track reconstruction. The distribution of the sine of the difference of the skewed angle between the generated particles and the skewed angle between the reconstructed tracks, defined as , is shown in Figure 11(b). This distribution is fitted with a triple-Gaussian function. The three components of these angular resolutions (, , ) represent the cases, where (0) no multiple scattering happened for the pair of tracks, (1) one of the tracks has gone through multiple scattering and (2) both the tracks have gone through multiple scatterings in the detector medium or in the roof of the housing building, respectively.
Based on these observations, a pair of tracks with a skewed angle less than are considered as parallel to each other. All the pairs of tracks present in a reconstructed event has to comply with this selection criteria. Thus, in the current study, only the parallel tracks are considered to select the tracks generated from the particles originating from the same cosmic ray shower. The time difference between a pair of tracks for both simulated and observed data after the criteria of parallel track selection are shown in Figure 10(b). It can be observed that the events from the random coincidences disappear after rejecting the events with non-parallel tracks.
The particles, originated in the interaction of the cosmic particles with the detector medium or the roof are also not parallel to the cosmic particles or with each others as the particles share a common vertex. The skewed angle cut rejects these events as well.
5 Results and Discussions
In the present work, the event direction is presumed as a mean direction of all individual muons in an event. In the analysis, the clustering of events towards any specific region in the sky was not observed for the data recorded in the detector, which can be confirmed by the Figure 12.
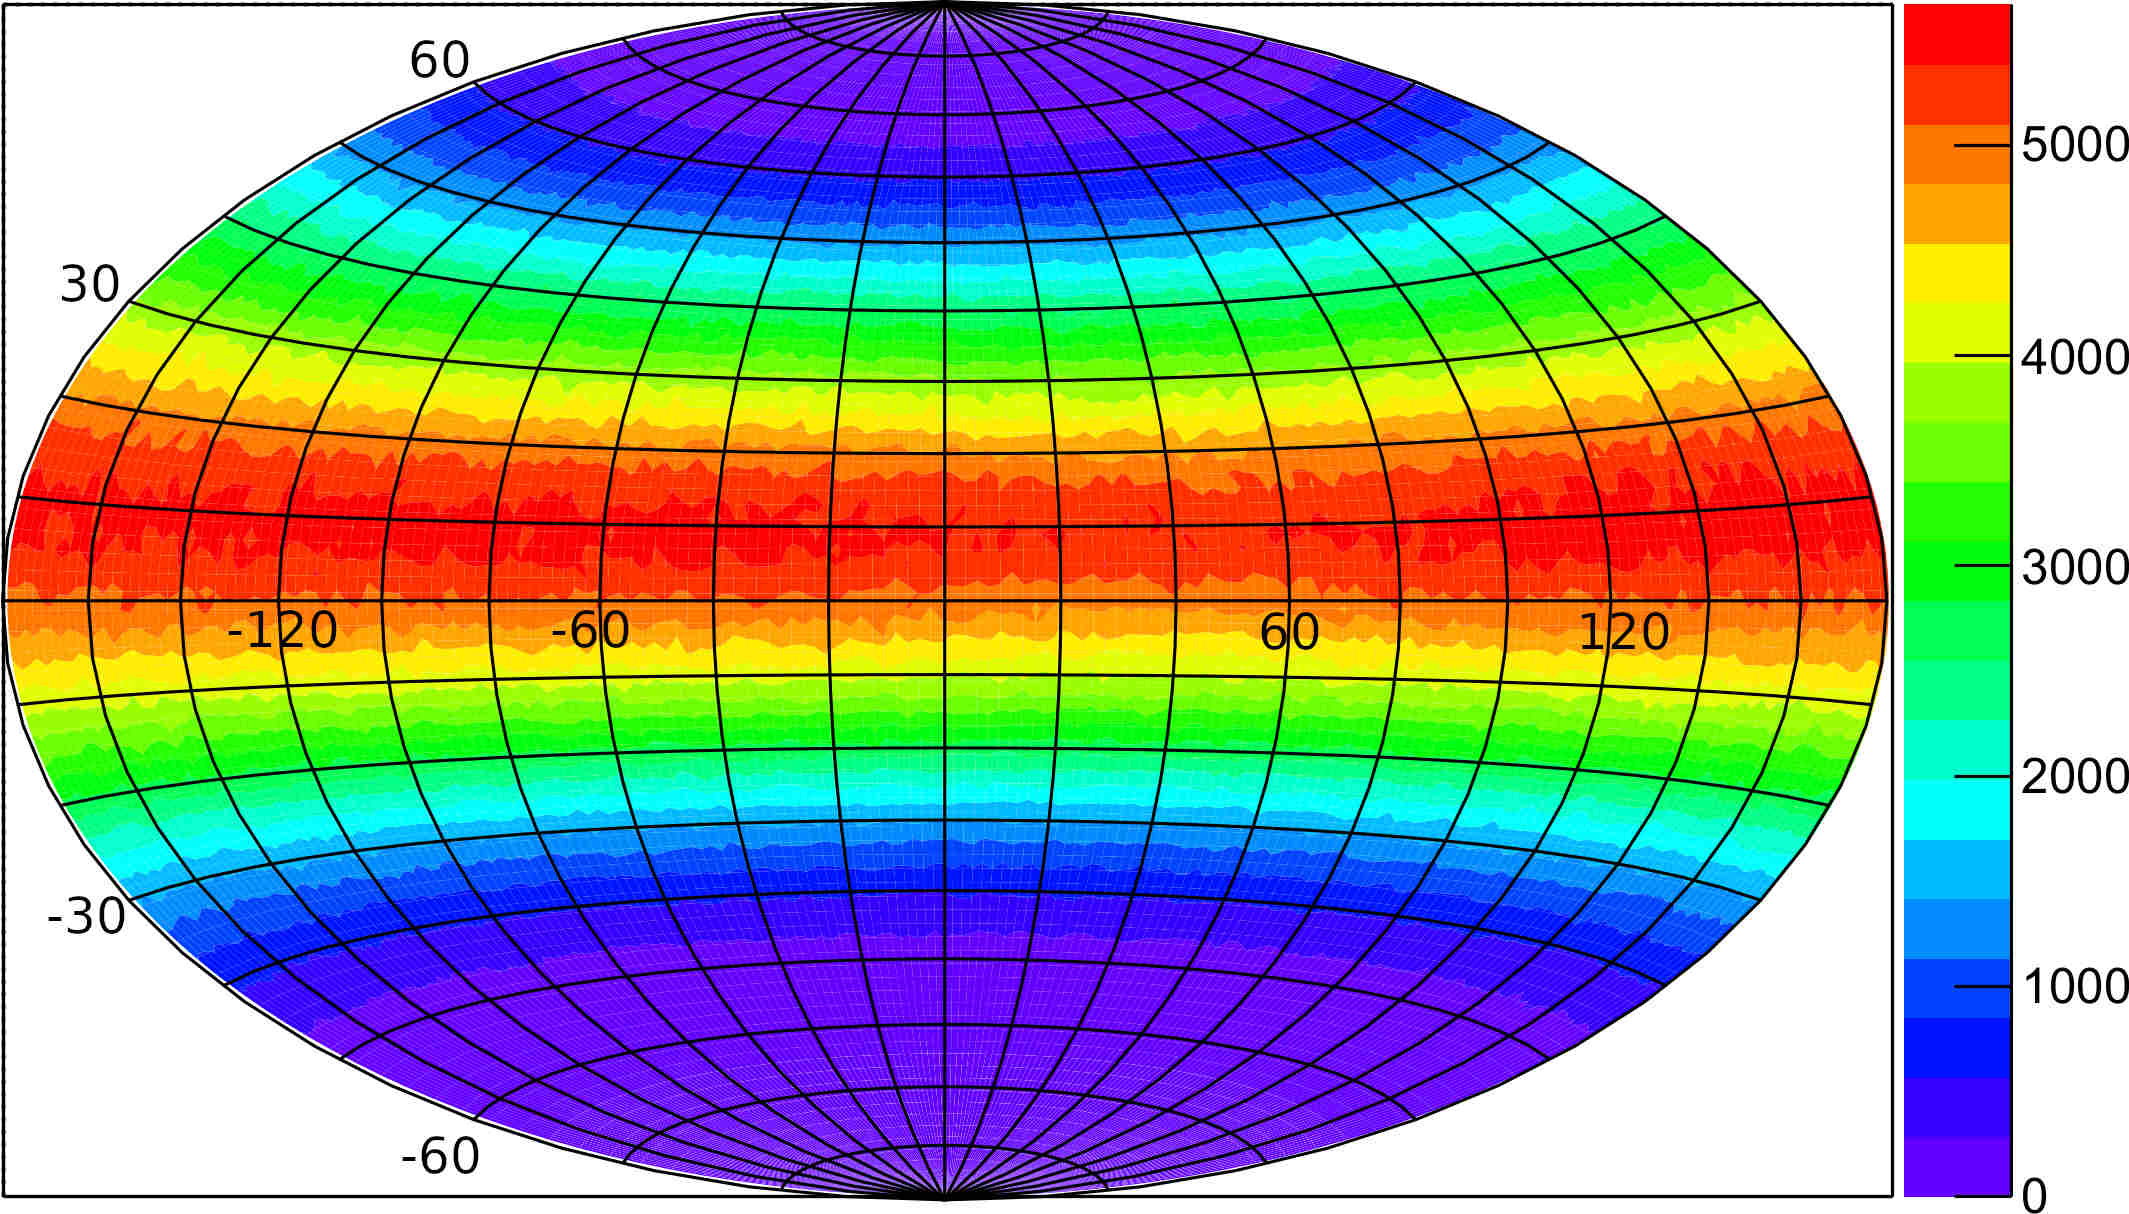
Also, no significant modulation of the ratio of the events containing 2, 3 and 4 tracks with respect to single track events was observed during the period of observation irrespective of the periodic changes in the reconstruction efficiency. Hence, the assumption of uniform distribution of cosmic ray directions which are used in the CORSIKA simulations are justified by the absence of anisotropy in the data.
The total number of events with at least one reconstructed track in it is approximately 206 millions. The normalised fraction of the events containing 2, 3 and 4 tracks with respect to single track events are calculated to be , and , respectively from the cosmic ray data.
The normalised fraction of the events containing 2, 3 and 4 tracks are also calculated from the CORSIKA simulation for different types of cosmic primaries (H, He, C, O, Si, and Fe) and for different hadronic interaction models (QGSJET-II-04 and QGSJET01d), which are shown in Table 1. In order to compare the simulated results with data, all the normalised fraction, calculated for different cosmic primaries are summed with weights where the abundances in the primary compositioncosmic1 ; pdgspectra1 are used as the weights. The comparison of data and the combined predictions are given in Table 2.
| No of | H | He | C | O | Si | Fe |
|---|---|---|---|---|---|---|
| Tracks | QGSJET-II-04 | |||||
| 2 | ||||||
| 3 | ||||||
| 4 | ||||||
| QGSJET01d | ||||||
| 2 | ||||||
| 3 | ||||||
| 4 | ||||||
| No of Tracks | Data | QGSJET-II-04 | QGSJET01d |
|---|---|---|---|
| 2 | |||
| 3 | |||
| 4 |
If the abundances of elements in the primary cosmic ray spectrum as observed in cosmic1 ; pdgspectra1 are used to form the final result from simulation, the normalised track fractions of the events containing 2, 3 and 4 tracks are within one order of magnitude less compared to the data. Systematic error due to uncertainties of roof thickness, material in the detector setup, strip multiplicity, noise, efficiencies and the physiscs models used in GEANT4 are much smaller than the observed discrepancy between data and MC prediction. These results clearly demonstrate that there is a discrepancy between the observed data and predictions from the cosmic ray particle spectrum, the CORSIKA and finally the GEANT4 simulation.
A few other experiments (KGFkgf1 , ALICEalice1 , MACROmacro1 , DELPHIdelphi1 , ALEPHaleph1 , KASCADE-Grandekascade1 , etc.) have also studied the multi-muon tracks in cosmic events. Except for the KASCADE-Grande, all other experiments were performed under the ground. The underground experiments have observed events with large multiplicities because of the large size of the detectors and the overburden of rock and soil, which are blocking showers with low energy. The multiplicity of the cosmic ray particles observed in a detector is highly dependent on the dimensions, aperture, energy threshold and detector’s location. Hence, it is difficult to compare the results of the aforesaid experiments quantitatively with the small-scale detectors setup in this current study. But all the studies based on the aforesaid experiments have indicated a similar discrepancy between the CORSIKA spectra and the observed data. The KASCADE-Grande experiment has also concluded that the attenuation length of muons in the atmosphere from the simulation is smaller than estimation from the observed datakascade1 .
Although, the bulk of primary particles interacts at center-of-mass energies far below 10 GeV corsika763 , it is observed in the simulation that a significant amount of primaries which are responsible for higher particle multiplicities in the present setup, are in the range beyond the scope of the present collider experiments. The major problem of the EAS simulation programs is the extrapolation of the hadronic interactions in the high energy range which is not covered by the experimental data. The limitation of the experiments to measure the hadronic interactions at this high energy is mainly due limitation of the design of high energy -colliders corsika763 . In the present -colliders, the forward direction is not accessible. The secondary particles which are of the higher importance in the development of EAS programs are undetected in the beam pipe of the colliders. The largest energy fraction of each -collision is carried away by these particles. The maximum attainable energy in these colliders is much lower than those found in cosmic rays. Therefore, the extrapolations based on theoretical models are mainly used by all the EAS programs. While, the energy of the cosmic rays contributing for the single track events in the current detector setups are well within the boundary of the current physics models (upto 1 TeV), a significant amount of the interactions contributing for the higher multiplicities are beyond this energy and are not supported by the experimental data corsika763 .
6 Conclusion
In the period between August 23, 2017, to September 8, 2017, approximately 250 millions events were recorded. There is a discrepancy in results predicted by the EAS simulation program which can be observed in the comparison of the track multiplicity between the data and Monte-Carlo. The results of the current study reflect that the current physics models of interactions at the earth atmosphere are unable to reproduce the air showers accurately. The earlier measurements of muon multiplicity along with the present result can be used to improve the parameters of the hadronic model at high energies and/or cosmic ray spectral index along with the composition of the primary cosmic rays.
References
- (1) ICAL Collaboration, Invited review: Physics potential of the ICAL Detector at the India-based Neutrino Observatory (INO), Pramana J. Phys., Volume 88(5), 79 (Apr 2017)
- (2) Pestov, Yu. N. and Fedotovich, G. V., A PICOSECOND TIME-OF-FLIGHT SPECTROMETER FOR THE VEPP-2M BASED ON LOCAL - DISCHARGE SPARK COUNTER, SLAC-TRANS-0184, IYF-77-78 (1978)
- (3) R. Santonico and R. Cardarelli, Development of resistive plate counters, Nuclear Instruments and Methods in Physics Research, Volume 187 (1981) 377-380
- (4) S. Pethuraj et. al., Measurement of cosmic muon angular distribution and vertical integrated flux by 2 m2 m RPC stack at IICHEP-Madurai, Journal of Cosmology and Astroparticle Physics, Vol 09 (2017) 021-021
- (5) M. Tanabashi et al. (Particle Data Group), The Review of Particle Physics, Phys. Rev. D, 98 030001 (2018)
- (6) D. Heck, J. Knapp, J. N. Capdevielle, G. Schatz and T. Thouw, 1998 CORSIKA: A Monte Carlo Code to Simulate Extensive Air Showers, Forschungszentrum Karlsruhe Report FZKA 6019
- (7) GEANT4 collaboration, S. Agostinelli et al., GEANT4: A Simulation toolkit, Nucl. Instrum. Meth. A 506 (2003) 250 [ IN SPIRE ].
- (8) F. Anghinolfi et al., NINO: an ultra-fast and low-poer front-end amplifier/discriminator ASIC designed for the multigap resistive plate chamber, Nucl. Instrum. Methods A 533 (2004) 183-187.
- (9) V. B. Chandratre, Menka Sukhwani, K Hari Prasad, Sourav Mukhopadhyay, Megha Thomas, Ravindra Shinde and Satyanarayana B., ANUSPARSH-II frontend ASIC for avalanche mode of RPC detector using regulated cascode trans-impedance amplifier, Proceedings of the DAE-BRNS Symp. on Nucl. Phys., Vol 60 (2015) 928-929.
- (10) Achrekar S. et al., Electronics, Trigger and Data Acquisition Systems for the INO ICAL Experiment. In: Liu ZA. (eds) Proceedings of International Conference on Technology and Instrumentation in Particle Physics 2017. TIPP 2017. Springer Proceedings in Physics, vol 212. Springer, Singapore (2018)
- (11) Richard O. Duda, Peter E. Hart, Use of the Hough transformation to detect lines and curves in pictures, Communications of the ACM, Vol 15(1) (1972) 11-15
- (12) Niu Li-Bo, Li Yu-Lan, Huang Meng, He Bin and Li Yuan-Jing, Track reconstruction based on Hough-transform for nTPC, Chinese Physics C, Vol 38(12) 126201
- (13) Zhaoyi Qu, Sadakazu Haino, Paolo Zuccon and Minggang Zhao, New track finding based on cellar automaton for AMS-02 detector, Nuclear Instruments and Methods in Physics Research Section A, Vol 869 (11 Oct 2017) 135-140
- (14) Suryanarayan Mondal, et. al., Leak test of Resistive Plate Chamber gap by monitoring absolute pressure, Journal of Instrumentation, Vol 14(04) P04009 (April 2019) 10.1088/1748-0221/14/04/P04009
- (15) M. M. Shapiro, R. Silberberg, C. H. Tsao, Relative Abundances of Cosmic Rays at their Source (Proceedings of 11th International Conference on Cosmic Rays, Budapest 1969), Acta Physica Academiae Scientiarum Hungaricae, 29 Suppl. 1 (1970) 479-484
- (16) H. Adarkar et. al., A multi TeV muon bundle observed in the KGF underground detector, Physics Letters B, Vol 267(1) (September 1991) 138-142 [10.1016/0370-2693(91)90539-3]
- (17) The ALICE Collaboration, Study of cosmic ray events with high muon multiplicity using the ALICE detector at the CERN Large Hadron Collider, Journal of Cosmology and Astroparticle Physics, Vol 2016 (January 2016) 032 [10.1088/1475-7516/2016/01/032]
- (18) The MACRO Collaboration, Multiple Muon Measurements with MACRO, Proceedings, Very High Energy Cosmic Ray Interactions, C94-07-24 (1994) 711-722 [hep-ex/9410001]
- (19) The DELPHI Collaboration, Study of multi-muon bundles in cosmic ray showers detected with the DELPHI detector at LEP, Astroparticle Physics, Volume 28(3) (November 2007) 273-286 [10.1016/j.astropartphys.2007.06.001]
- (20) V. Avati et. al., Cosmic multi-muon events observed in the underground CERN-LEP tunnel with the ALEPH experiment, Astroparticle Physics, Volume 19(3) (November 2002) 513–523 [10.1016/S0927-6505(02)00247-5]
- (21) W. D. Apel et. al., Probing the evolution of the EAS muon content in the atmosphere with KASCADE-Grande, Astroparticle Physics, Volume 95 (2017) 25–43 [10.1016/j.astropartphys.2017.07.001]