Current address: ]IFW Dresden, Helmholtzstraße 20, D-01069 Dresden, Germany
Chemical tuning between triangular and honeycomb structures
in a 5d spin-orbit Mott insulator
Abstract
We report structural studies of the spin-orbit Mott insulator family KxIryO2, with triangular layers of edge-sharing IrO6 octahedra bonded by potassium ions. The potassium content acts as a chemical tuning parameter to control the amount of charge in the Ir-O layers. Unlike the isostructural families with Ir replaced by Co or Rh (), which are metallic over a range of potassium compositions , we instead find insulating behaviour with charge neutrality achieved via iridium vacancies, which order in a honeycomb supercell above a critical composition . By performing density functional theory calculations we attribute the observed behaviour to a subtle interplay of crystal-field environment, local electronic correlations and strong spin-orbit interaction at the Ir4+ sites, making this structural family a candidate to display Kitaev magnetism in the experimentally unexplored regime that interpolates between triangular and honeycomb structures.
I Introduction
Mott insulators with strong spin-orbit interactions, as realized in 5 oxides, are attracting much interest as candidates to display novel cooperative magnetic behaviours such as quantum spin liquids with exotic quasiparticles, anisotropic spin fluctuations with momentum-dependent polarization, and unconventional magnetic orders such as counter-rotating incommensurate antiferromagnetism (for recent reviews see references 1 and 2). Such physics is stabilized by strong frustration effects from bond-dependent anisotropic (Kitaev) interactions between spin-orbit entangled magnetic moments. Experimental evidence for such interactions has been found in the layered honeycomb materials -Li2IrO3 Williams et al. (2016), Na2IrO3 Hwan Chun et al. (2015), -RuCl3 Banerjee et al. (2016), and the three-dimensional harmonic honeycombs - and -Li2IrO3 Takayama et al. (2015); Biffin et al. (2014a, b). Rich physics stabilized by Kitaev interactions is also expected on other lattice geometries, in particular on the 2D triangular structure incommensurate magnetic vortex crystals and spin nematic orders have been theoretically predicted Rousochatzakis et al. (2016); Kimchi and Vishwanath (2014), but are yet to be experimentally realized. Notable examples of triangular structures composed of edge-sharing octahedra (i.e. a similar transition-metal bonding environment to the above honeycomb structures) are NaxCoO2 Huang et al. (2004), KxCoO2 Jansen and Hoppe (1974); Hironaka et al. (2017); Nakamura et al. (1996) and KxRhO2 Shibasaki et al. (2010); Zhang et al. (2013). These materials show metallic behaviour for a range of compositions, , with the transition metal adopting a non-integer valence state . Here, we report a structural study of the related family, KxIryO2, which in contrast show insulating behaviour below room temperature (Sec. III.3). We attribute this fundamental difference to the presence of much stronger spin-orbit interactions combined with electronic correlations and crystal-field effects Kim et al. (2017) that stabilize a spin-orbit Mott insulator with Ir in a 4+ oxidation state. This property makes this family a potential platform to explore Kitaev magnetism in a structural framework that we show interpolates between triangular and honeycomb structures.
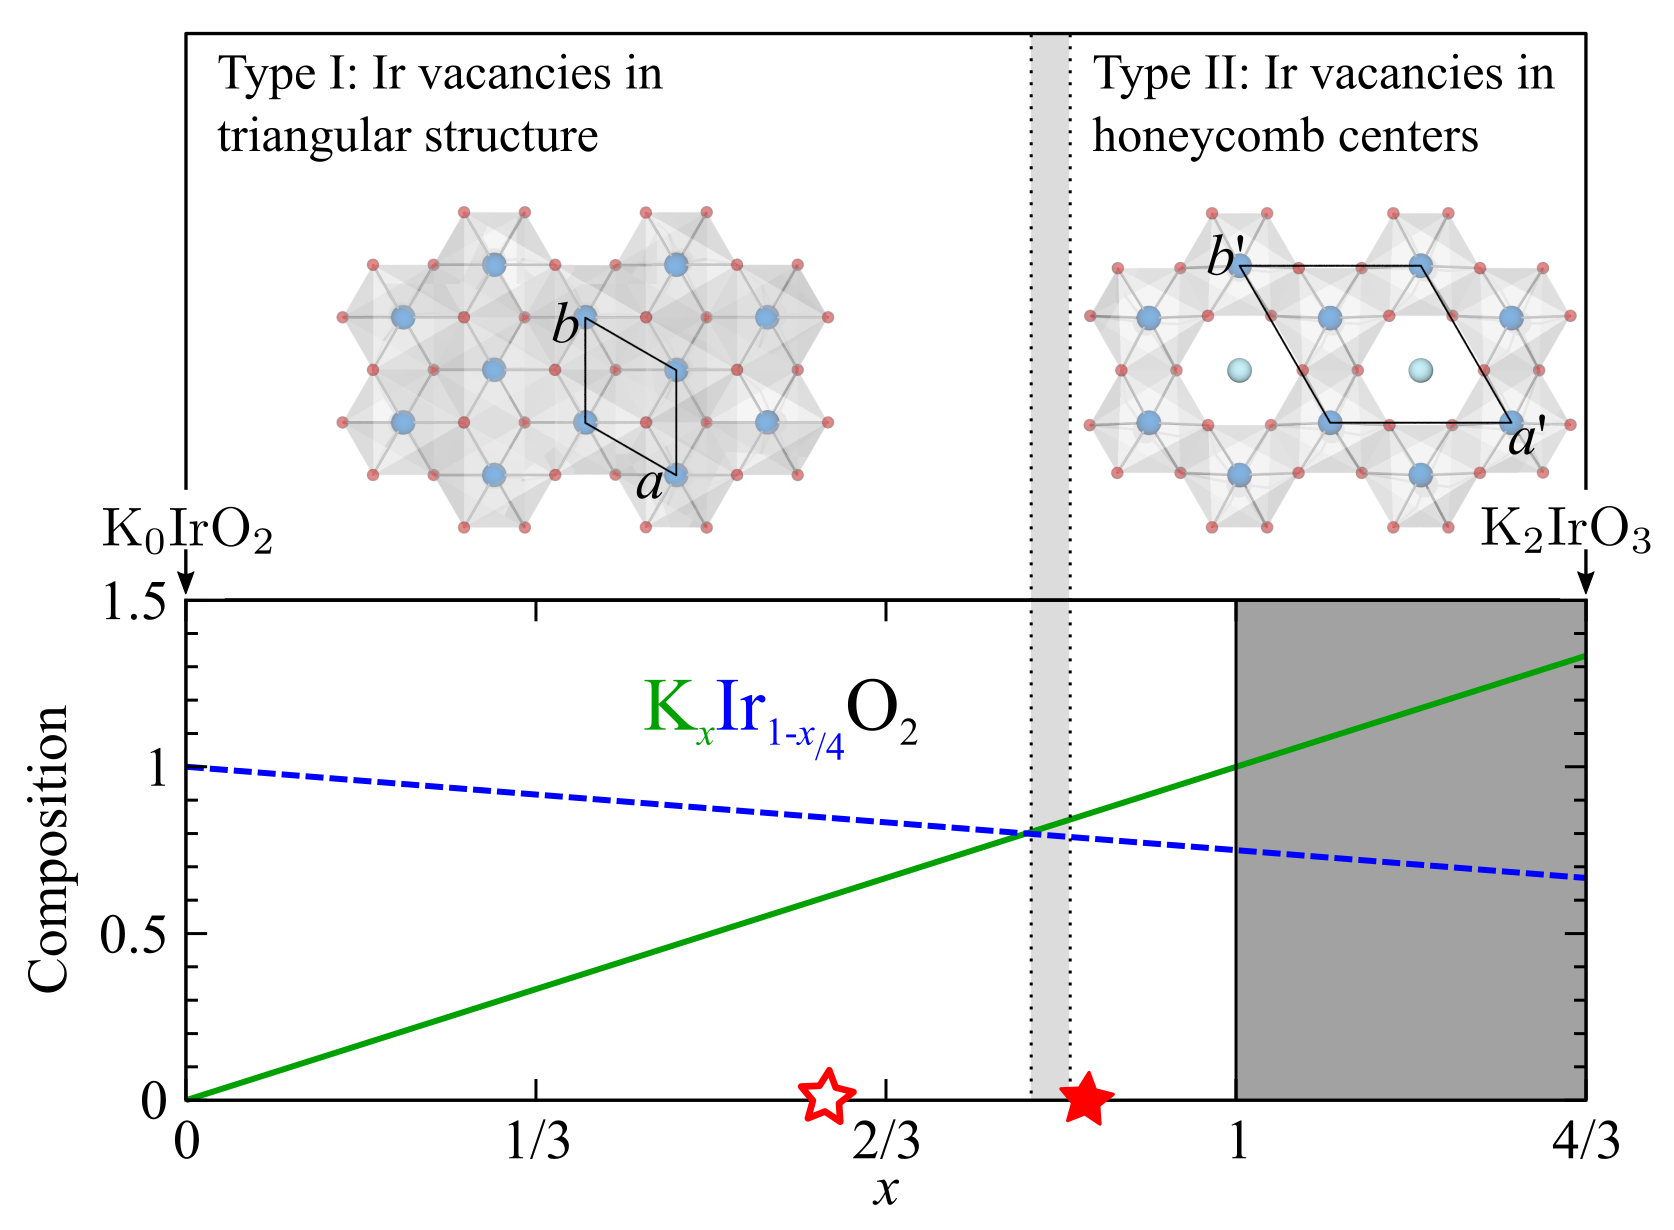
We propose the conceptual structural phase diagram shown in Fig. 1. As noted above, we adopt the hypothesis that strong spin-orbit coupling combined with electronic correlations and crystal-field effects favor the 4+ oxidation state for Ir atoms. In this case, charge neutrality for different potassium compositions is maintained by iridium vacancies. Under these constraints we re-write the chemical formula as KxIr1-x/4O2, such that the phase diagram (Fig. 1) spans the range of compositions from (K0IrO2) to (equivalent to K2IrO3). Consider triangular layers of edge-sharing IrO6 octahedra, separated by layers of potassium ions. Such a structure is well established for the related materials NaxCoO2 Huang et al. (2004) and KxCoO2 Jansen and Hoppe (1974), where Na/K also occupy triangular substructures located between successive CoO2 layers. At we obtain a hypothetical end-member, IrO2. In reality IrO2 adopts a different crystal structure, in part because a finite amount of potassium is required to facilitate inter-layer bonding in the proposed layered KxIr1-x/4O2 structural framework, nonetheless this hypothetical end member serves as a useful reference. Upon adding potassium and concomitantly removing some iridium ions (one Ir for every four K added), vacancies are introduced at random on the nominal Ir sites and the end-member crystal symmetry is maintained on average. However, at some critical composition (grey vertical band in Fig. 1) one might expect a structural phase transition associated with the iridium vacancies forming an ordered superstructure on the triangular structure. A natural candidate is a tripling of the unit cell when the vacancies are located preferentially at the centres of a honeycomb structure. We consider the simplest case of complete preference of the vacancies to occupy the centre sites, with the surrounding honeycomb structure being fully occupied. On further increasing the potassium content we reach a second reference composition at (KIr0.75O2), where the K layer forms a fully-filled triangular layer and the Ir void sites are occupied. Further increasing beyond would require placing potassium in the honeycomb centres. However, this appears to be energetically unfavourable, as it would require a significant distortion of the oxygen environment around the honeycomb centre. The structures with refined below were found to have metal-oxygen bond lengths at the honeycomb centre of about . These lengths are much shorter than typical K-O bond lengths, for example, in honeycomb K2PbO3 the K-O bond length for K in the honeycomb centres is 2.76 at room temperature Delmas et al. (1976). Despite this, for the purpose of discussion we include in Fig. 1 compositions with , with the high end limit corresponding to the case where all honeycomb centres are filled with K instead of Ir (nominal composition equivalent to K2IrO3).
In the following, we present a combined single crystal x-ray diffraction (SXD) and density functional theory (DFT) study of the crystal structures adopted by KxIr1-x/4O2. We show that for two phases exist that form either triangular or honeycomb structures, consistent with the structural framework introduced above. Our DFT calculations show a relatively sharp transition in the region between triangular and honeycomb phases, demonstrating that the K:Ir ratio in KxIr1-x/4O2 may act as an effective tuning parameter between the two distinct regimes.
The rest of this paper is organised as follows. In Section II we describe all experimental and theoretical methods used, in the Results sections (III.1 and III.2) we present the experimental determination of the triangular and honeycomb structures, in the Discussion section (IV) we give theoretical support to the above, hypothetical structural phase diagram and demonstrate that the KxIr1-x/4O2 family are candidates to display Kitaev magnetism, and finally we summarise our results in the Conclusions section (V). The appendices include a symmetry analysis of the triangular to honeycomb structural phase transition, plotted against for triangular and honeycomb structural refinements, and structural details on a theoretically proposed K2IrO3 end member compound.
II Methods
Single crystals of KxIryO2 (with intended nominal composition and ) were grown from metallic K and Ir starting materials placed inside Al2O3 crucibles in air, similar to the method used recently for the crystal growth of Li2IrO3 Freund et al. (2015). Ir metal powder was placed at the bottom of the growth crucible, above which Al2O3 fragments were placed to allow nucleation of crystals at sharp edges. K metal was then placed on top of the Al2O3 fragments and the crucible heated to 1070 ∘C in 12 hrs and left there for 70 hrs before cooling to room temperature over 12 hrs.
SXD experiments were performed at room temperature using a laboratory based Oxford Diffraction Supernova diffractometer fitted with a Mo Kα x-ray source. Over thirty crystals (with an approximate diameter of 50-100 m) from different synthesized batches were screened to test for consistency in the diffraction patterns. The data sets measured for structural refinement using fullprof Rodríguez-Carvajal (1993) contained approximately full spheres of diffraction peaks in reciprocal space, giving between 2000 and 10000 statistically significant diffraction intensities depending on sample size.
Variable temperature resistance measurements were performed using a Quantum Design Physical Properties Measurement System. A 2-point contact method was employed using long, parallel silver paint electrodes on the surface of a flat-plate single crystal. The average distance between electrodes was , and a 100 excitation current was used at all temperatures.
Complementary ab-initio density functional theory structural relaxation calculations within the proposed structural framework (Fig. 1), and with variable potassium compositions , were performed using the Vienna Simulation Package (VASP) Kresse and Hafner (1993); Kresse and Furthmüller (1996); Kresse and Furthm??ller (1996) adopting the Perdew-Burke-Ernzerhof generalized gradient approximation (GGA) Perdew et al. (1996) and the projector augmented wave method Blöchl (1994). In order to study fractional occupancies in KxIr1-x/4O2 with the possibility of also describing Ir and K vacancies, we used the virtual crystal approximation (VCA). In this approach the crystal structure is kept with the primitive-cell periodicity, but it is composed of fictitious ‘virtual’ atoms that interpolate between the behavior of the Ir (or K) atoms and vacancies. The validity of such an approximation for simulating possible vacancy effects has been tested in the past Mazin (2010) and we have performed supercell calculations for some computationally feasible cases such as . After carefully checking the convergence of the results with respect to the cutoff energy and the number of k-points, we adopted a cutoff energy of 520 eV and k-points generated by a 12 12 6 Monkhorst-Pack grid. The density of states for theoretically proposed K2IrO3 within GGA including relativistic effects were performed with the linearized augmented plane wave (LAPW) method implemented in WIEN2k Blaha et al. (2001) with a mesh of 1000 points in the first Brillouin zone and RKmax was set to 8. The exchange parameters were estimated using the exact diagonalization method of Ref. Winter et al., 2016a.
III Results
The SXD diffraction patterns from a range of samples fell into two distinct types: Type I, which could be indexed by a hexagonal unit cell with similar lattice parameters to KxCoO2 Jansen and Hoppe (1974), and Type II, which showed additional super-cell peaks attributed to a in-plane supercell. Below we present for each case the key features of the diffraction pattern, the structural refinement analysis, and a detailed comparison with ab-initio structural relaxation calculations.
III.1 Type I: Triangular Structure ()
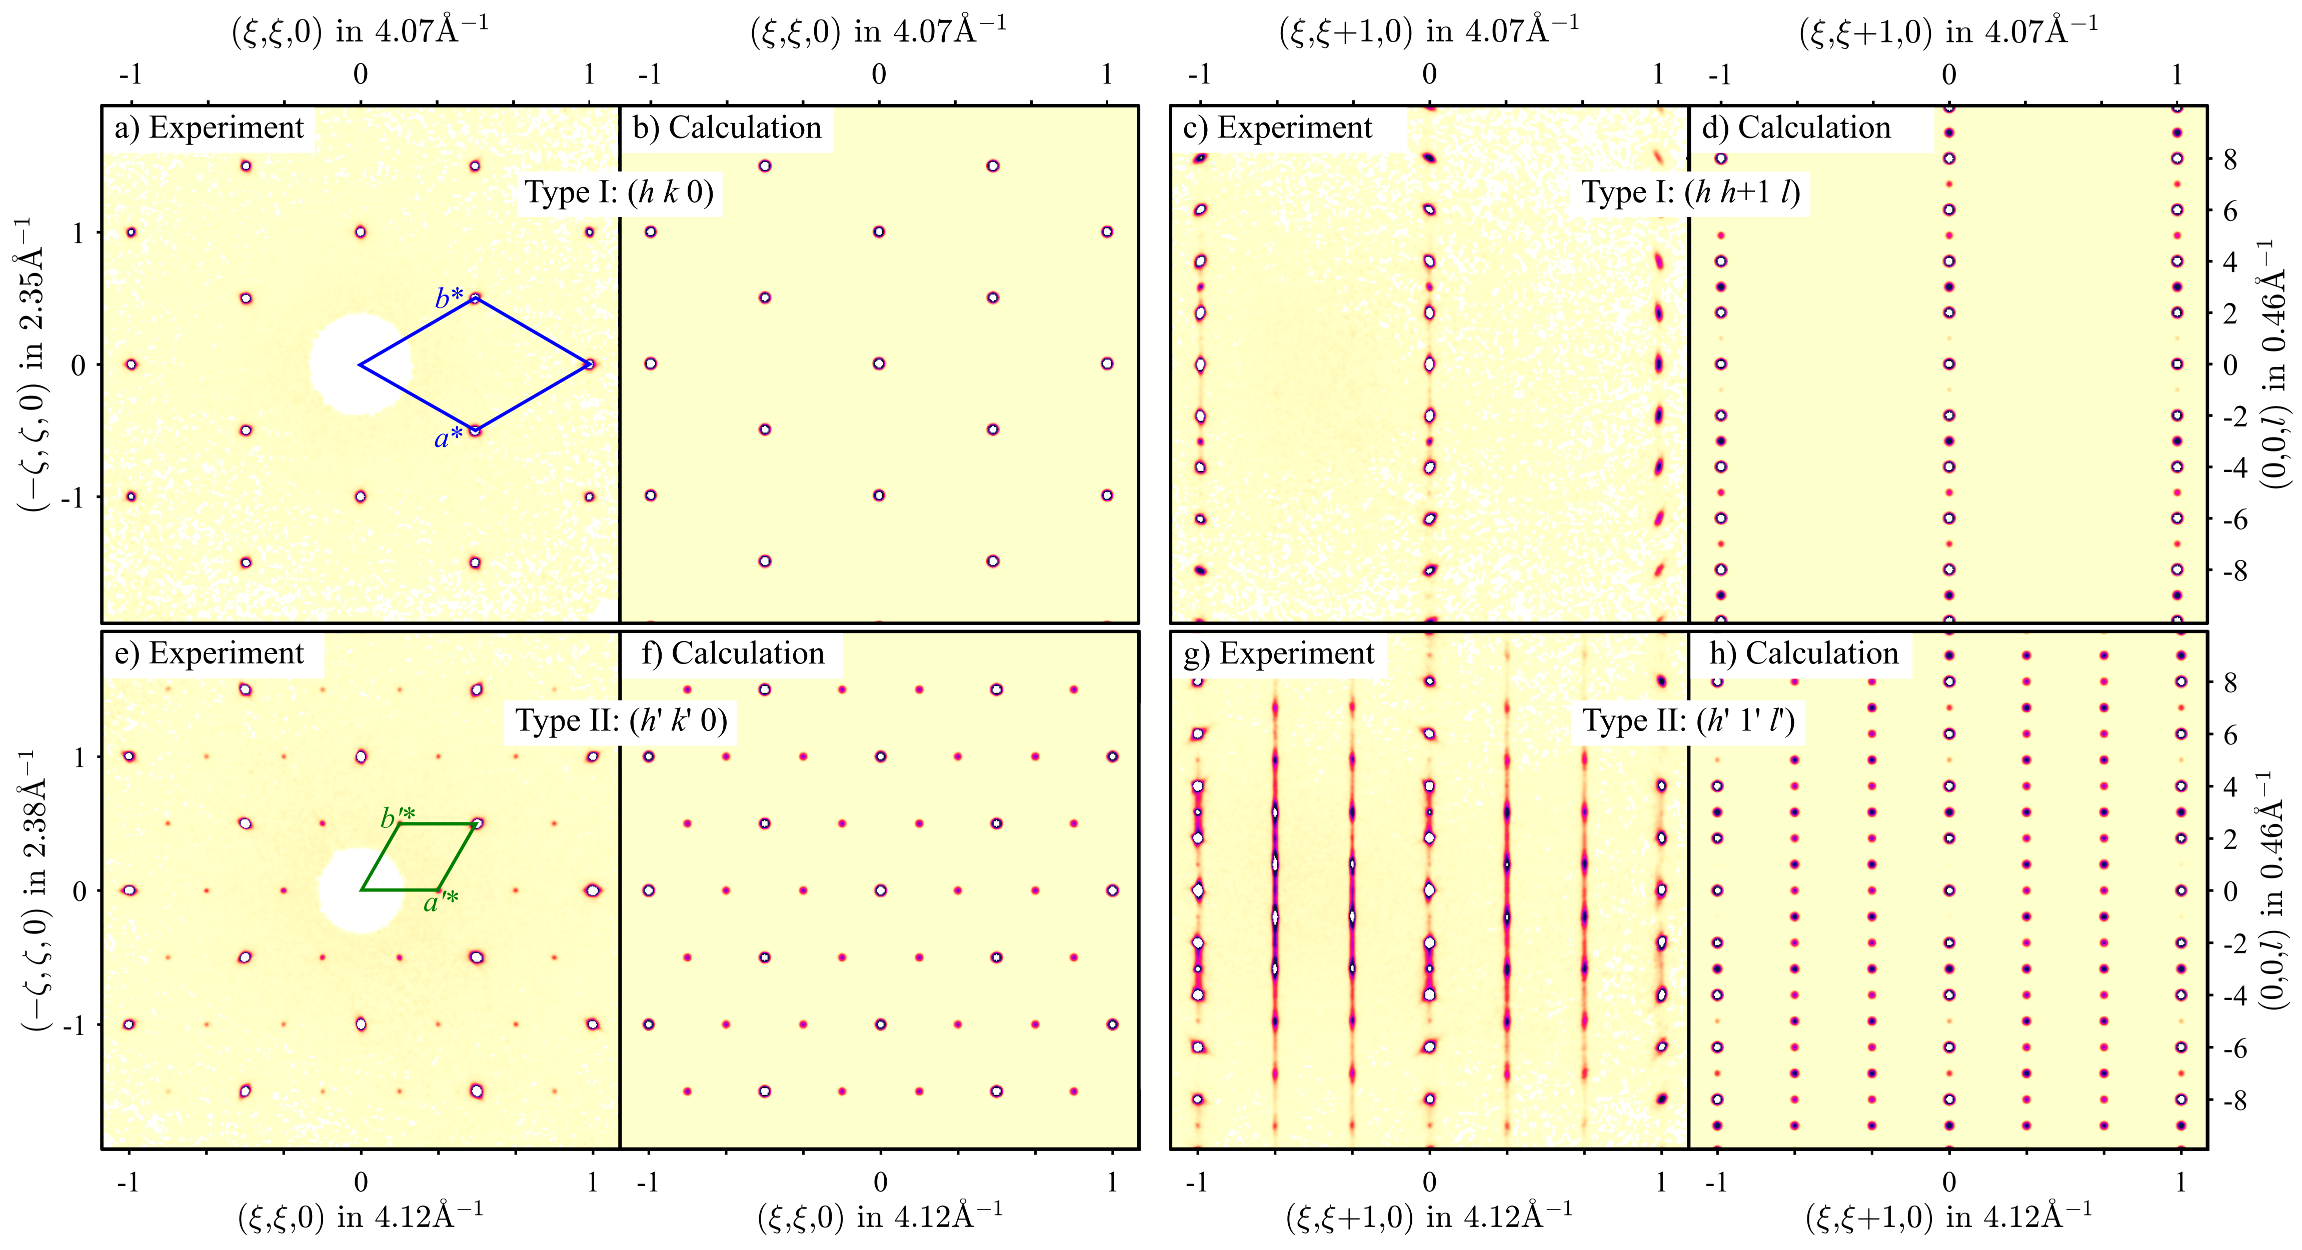
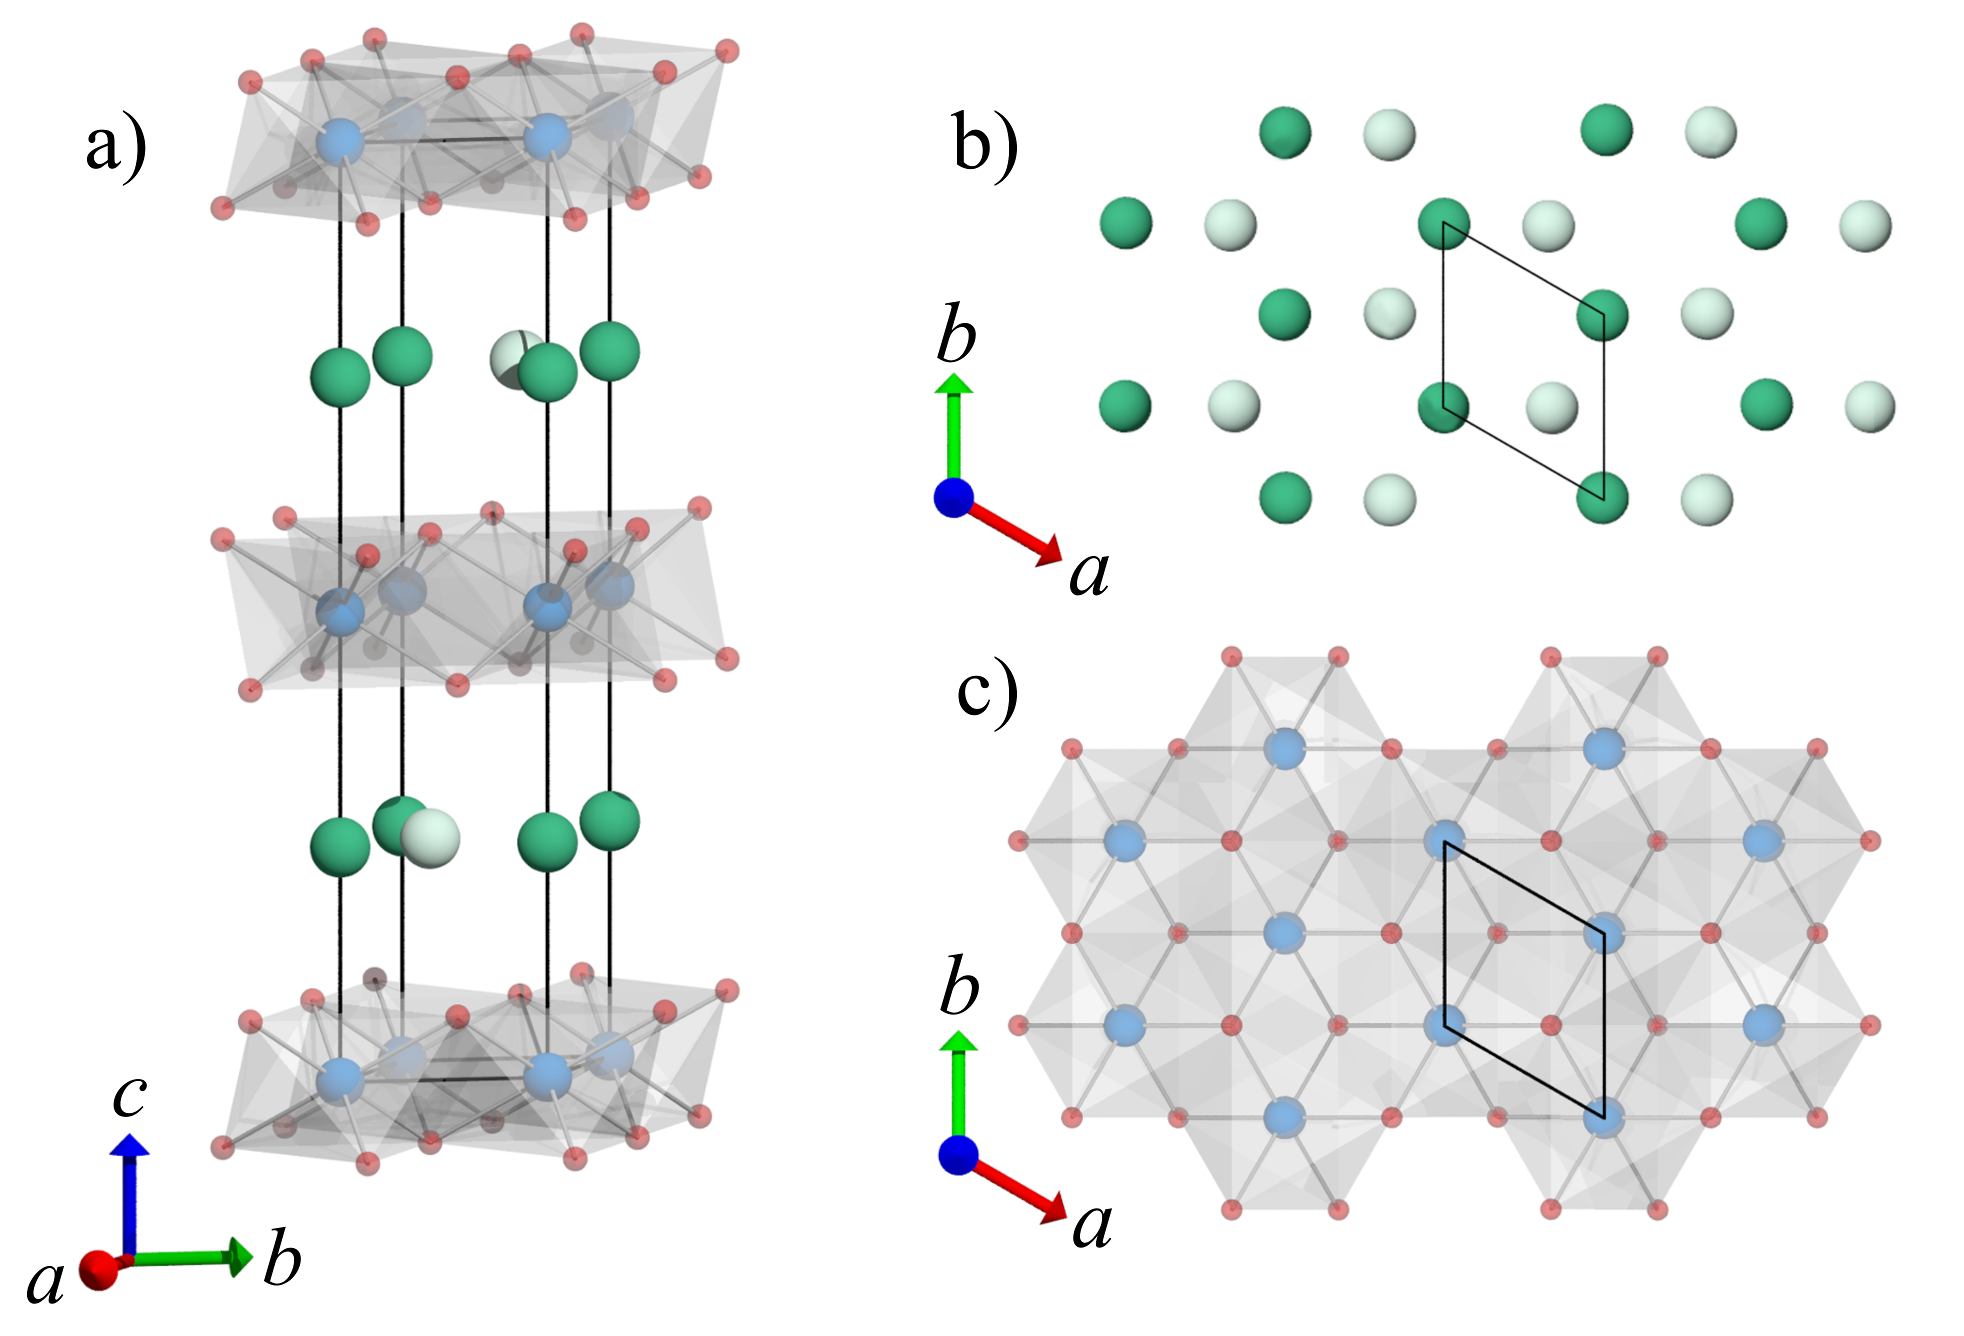
A high quality set of Type I diffraction data measured from a representative single crystal (with a refined composition of , see below) (open red star in Fig. 1) was selected for quantitative analysis. Over 99% of the diffraction peaks could be indexed using a primitive hexagonal unit cell with parameters and . Figures 2a) and c) show the diffraction patterns in and reciprocal lattice planes, respectively, where wavevector components are expressed with reference to the above hexagonal unit cell metric. The key features can be naturally explained by having triangular layers of edge-sharing IrO6 octahedra successively stacked with a 180∘ rotation around , which forms the basic two-layer structural framework of KxCoO2 Jansen and Hoppe (1974). In this structural model, the main diffraction peaks (=even) have the dominant contribution from the triangular transition metal substructure, and the weak peaks at odd and or , integer (see Fig. 2c) are due to the 180∘ rotation of the oxygen octahedra between successive layers. In this structural framework potassium ions can be located between layers bonded to the oxygens above and below, either with a trigonal prismatic coordination as in KxCoO2 Jansen and Hoppe (1974), for which there are two symmetry inequivalent triangular substructures (labelled K1 and K2, see dark and light green spheres in Figure 3b, respectively), or with a linear coordination forming a third possible triangular substructure (labelled K3) similar to O-Ag-O in delafossite -AgNiO2 Sörgel and Jansen (2005).
To test if the data could be described by the same structural model as KxCoO2 data reduction was performed within the respective Laue class. This yielded , showing this space group to be in excellent quantitative agreement with the diffraction pattern symmetry. The crystal structure model was first tested assuming all sites were fully occupied (test composition KIrO2, with potassium on one of the K1, K2, or K3 triangular substructures). In each case 7 free parameters were refined: the fractional coordinate of oxygen, 2 anisotropic (in-plane and out-of-plane) atomic displacement parameters (a.d.p.) for each cation, 1 isotropic a.d.p. for oxygen, and a global scale. The case where potassium was linearly coordinated (K3) could be immediately ruled out. Rietveld refinement of the model with potassium located on either K1 or K2 gave similar results with reasonable goodness-of-fit parameters (, , ). However, the anisotropic a.d.p.s for potassium always indicated significant delocalisation within the -plane.
Occupation factors were then introduced as free parameters for the Ir site and the two potassium substructures (K1 and K2), which led to an excellent fit (, , ), and indicated a partial but equal occupation of both K1 and K2 sublattices and a composition consistent with iridium (also partially occupied) being in a 4+ oxidation state. We note that partial occupation of the K1 and K2 sublattices was also found in KxCoO2, suggesting a common feature of this structural framework. A final model was refined against the data, in which the potassium partial occupation was varied freely but constrained to be the same on both K1 and K2 sublattices, and the iridium occupation constrained to satisfy charge neutrality for valence 4+. The goodness-of-fit (, , ) was comparable to the fully unconstrained refinement above, indicating that these constraints adequately describe a minimal model for the Type I crystal structure, as detailed in Table 1 and shown in Figure 3. The resulting cation-oxygen bond lengths are also given in Table 1. The good agreement between the experimental and calculated diffraction pattern is illustrated for the plane in Fig. 2a) and b), for the plane in Fig. 2c) and d), and for all measured reflections in Figure 8 of Appendix B.
| Cell parameters | |||||
|---|---|---|---|---|---|
| Space group: (#194) | |||||
| () | 3.0909(2) | 3.0909(2) | 13.720(2) | ||
| Volume () 113.52(2) | |||||
| Atomic fractional coordinates | |||||
| Atom | Site | Occ. | |||
| Ir | 0 | 0 | 0 | 0.847(8) | |
| K1 | 0 | 0 | 1/4 | 0.307(8) | |
| K2 | 2/3 | 1/3 | 1/4 | 0.307(8) | |
| O | 1/3 | 2/3 | 0.074(1) | 1 | |
| Atomic displacement parameters () | |||||
| Ir | U11 = U22 = 0.0076(7) | U33 = 0.0161(7) | |||
| K1 | U11 = U22 = 0.16(3) | U33 = 0.03(1) | |||
| K2 | U11 = U22 = 0.16(3) | U33 = 0.03(1) | |||
| O | Uiso = 0.010(4) | ||||
| Selected bond lengths () | |||||
| K1(K2) - O 3.01(1) | |||||
| Ir - O 2.050(7) | |||||
| Data reduction (: 5.12%) | |||||
| measured reflections: 2277 | |||||
| independent reflections ): 88 | |||||
| fitted parameters: 8 | |||||
We note that no diffuse scattering is apparent in the diffraction pattern indicating a well-ordered structure with no stacking faults, which are quite common in other layered structures. In the present case the absence of stacking faults may be due to the particular stacking sequence where any in-plane shift would involve a change in the inter-layer bonding geometry.
DFT calculations were employed to test the Type I structural model, which was found to be stable for the refined composition. Relaxation of the atomic fractional coordinates within the experimentally determined unit cell metric gave a small shift in the oxygen coordinate from the empirical value of 0.074(1) to 0.05896.
To summarise, the Type I crystal structure adopted by the KxIr1-x/4O2 solid solution is composed of triangular layers of edge-sharing Ir1-x/4O6 octahedra, where every iridium site is partially occupied and equivalent by the translational symmetry of the lattice. Successive layers are stacked with a 180∘ rotation around , and potassium ions fill the inter-layer space with an equal, partial occupation of two offset triangular substructures. Finally, the K:Ir composition ratio was found to be consistent with an Ir4+ valence.
III.2 Type II: Honeycomb Structure ()
A Type II SXD data set measured from a representative sample (with a refined composition of , see below) (filled red star in Fig. 1) was selected for analysis. The diffraction patterns show all the features of Type I, but with additional peaks clearly observed at ()(1/3,1/3,0) positions with , , , integers, as shown by comparing Fig. 2c) and g). The additional diffraction peaks indicate a tripling of the unit cell in the plane. In this case the diffraction data can be indexed with a super-cell with respect to the “parent” Type I hexagonal cell, and refinement against the diffraction data gave the lattice parameters and (primes are used throughout to reference the triple-cell metric). The triple cell diffraction peaks are sizeable in intensity compared to the main triangular structure peaks, indicating that they originate from atomic ordering of iridium ions, which are the dominant scatterer with 77 electrons compared to K (19 electrons) and oxygen (16 electrons). The triple cell can be naturally explained if the iridium vacancies are no longer randomly distributed on all sites of the triangular structure, but are located only at the centres of a honeycomb structure of fully-filled iridium sites, as indicated schematically in Fig. 1 top right. The above triple cell metric contains two honeycomb layers, where the honeycomb centres can be stacked either eclipsed (straight on top), or staggered (with an in-plane offset). The presence of strong triple-cell peaks at odd indicates a staggered arrangement, as eclipsed stacking would only give triple cell peaks with even . We find that such a structure can be described in the space group, which is a triple cell super-space group of the triangular structure, (in Appendix A we show that this is a unique solution based on symmetry arguments and physical constraints). This structural model is illustrated in Fig. 4. We note that, compared to the “parent” in Fig. 3, the unit cell is rotated by 30∘ around and the unit cell origin is shifted by . There are now three symmetry-distinct iridium sites, Ir1 (Wyckoff position ), Ir2 () and Ir3 (). Within the symmetry, Ir1 has eclipsed stacking whereas Ir2 and Ir3 have staggered stacking. Having established that the diffraction pattern is consistent with staggered honeycomb centres, we therefore place the iridium vacancies at the Ir3 () site (choosing the Ir2 site leads to an equivalent description of the final structure).
The respective Laue class was used in the data reduction, giving good agreement (). A full structural model was parameterised as given in Table 2 and refined against the data. A good agreement with the data was achieved (shown in Figure 9 of Appendix B) with reliability parameters , , and . The resultant structure is summarised in Table 2 (including cation-oxygen bond lengths), and is shown in Figure 4. As before, the cation occupations were constrained to impose uniform partial occupation of potassium sites (K11 and K12 form one triangular substructure, K2 the other), as well as the 4+ oxidation state of iridium, while allowing the K:Ir ratio to vary. The occupations of Ir sites that compose the honeycomb structure (Ir1 and Ir2) were fixed to one, whilst the site in the honeycomb centre (Ir3) was allowed to adopt a partial occupation. Relaxing these constraints did not significantly improve the fit, showing again that iridium adopts the 4+ oxidation state, which then dictates the iridium occupation of the honeycomb centres for a given amount of potassium in the (K11,K12) and K2 triangular substructures. Comparison between the experimental and calculated diffraction patterns is illustrated for the plane in Fig. 2e) and f), and for the plane in Fig. 2g) and h). All features are well reproduced, with the exception of the diffuse scattering which occurs between successive triple cell peaks along . This diffuse scattering could be naturally understood as arising from faults in the stacking of the honeycomb centres, i.e. if every so often the honeycomb centre would randomly shift from the nominal position to one of the other neighbouring iridium sites. Since this involves no change in the inter-layer bonding geometry this stacking fault would be expected to have a very small energy cost.
| Cell parameters | |||||
| Space group: (#182) | |||||
| (): 5.2823(2), 5.2823(2), 13.5437(7) | |||||
| Volume () 327.28(3) | |||||
| Atomic fractional coordinates | |||||
| Atom | Site | Occ. | |||
| Ir1 | 0 | 0 | 1/4 | 1 | |
| Ir2 | 1/3 | 2/3 | 1/4 | 1 | |
| Ir3 | 2/3 | 1/3 | 1/4 | 0.35(8) | |
| K11 | 0 | 0 | 0 | 0.43(3) | |
| K12 | 1/3 | 2/3 | -0.006(4) | 0.43(3) | |
| K2 | 0 | 0.341(9) | 0 | 0.43(3) | |
| O | 0.319(5) | 0.334(5) | 0.1733(9) | 1 | |
| Atomic displacement parameters () | |||||
| Ir1 | U11 = U22 = 0.011(1) | U33 = 0.022(3) | |||
| Ir2 | U11 = U22 = 0.0044(6) | U33 = 0.011(1) | |||
| Ir3 | Uiso = 0.021(3) | ||||
| K11, K12 | U11 = U22 = 0.13(2) | U33 = 0.059(9) | |||
| K2 | U11 = 0.13(2), U22 = 0.08(3) | U33 = 0.059(9) | |||
| O | Uiso = 0.004(3) | ||||
| Selected bond lengths () | |||||
| K11 - O 2.91(2) | Ir1 - O 2.02(2) | ||||
| K12 - O 2.92(5) | Ir2 - O 2.01(2) | ||||
| K2 - O 2.90(3), 2.93(3), 2.97(3) | Ir3 - O 2.11(3) | ||||
| Data reduction (: 6.35%) | |||||
| measured reflections: 9755 | |||||
| independent reflections ): 234 | |||||
| fitted parameters: 8 | |||||
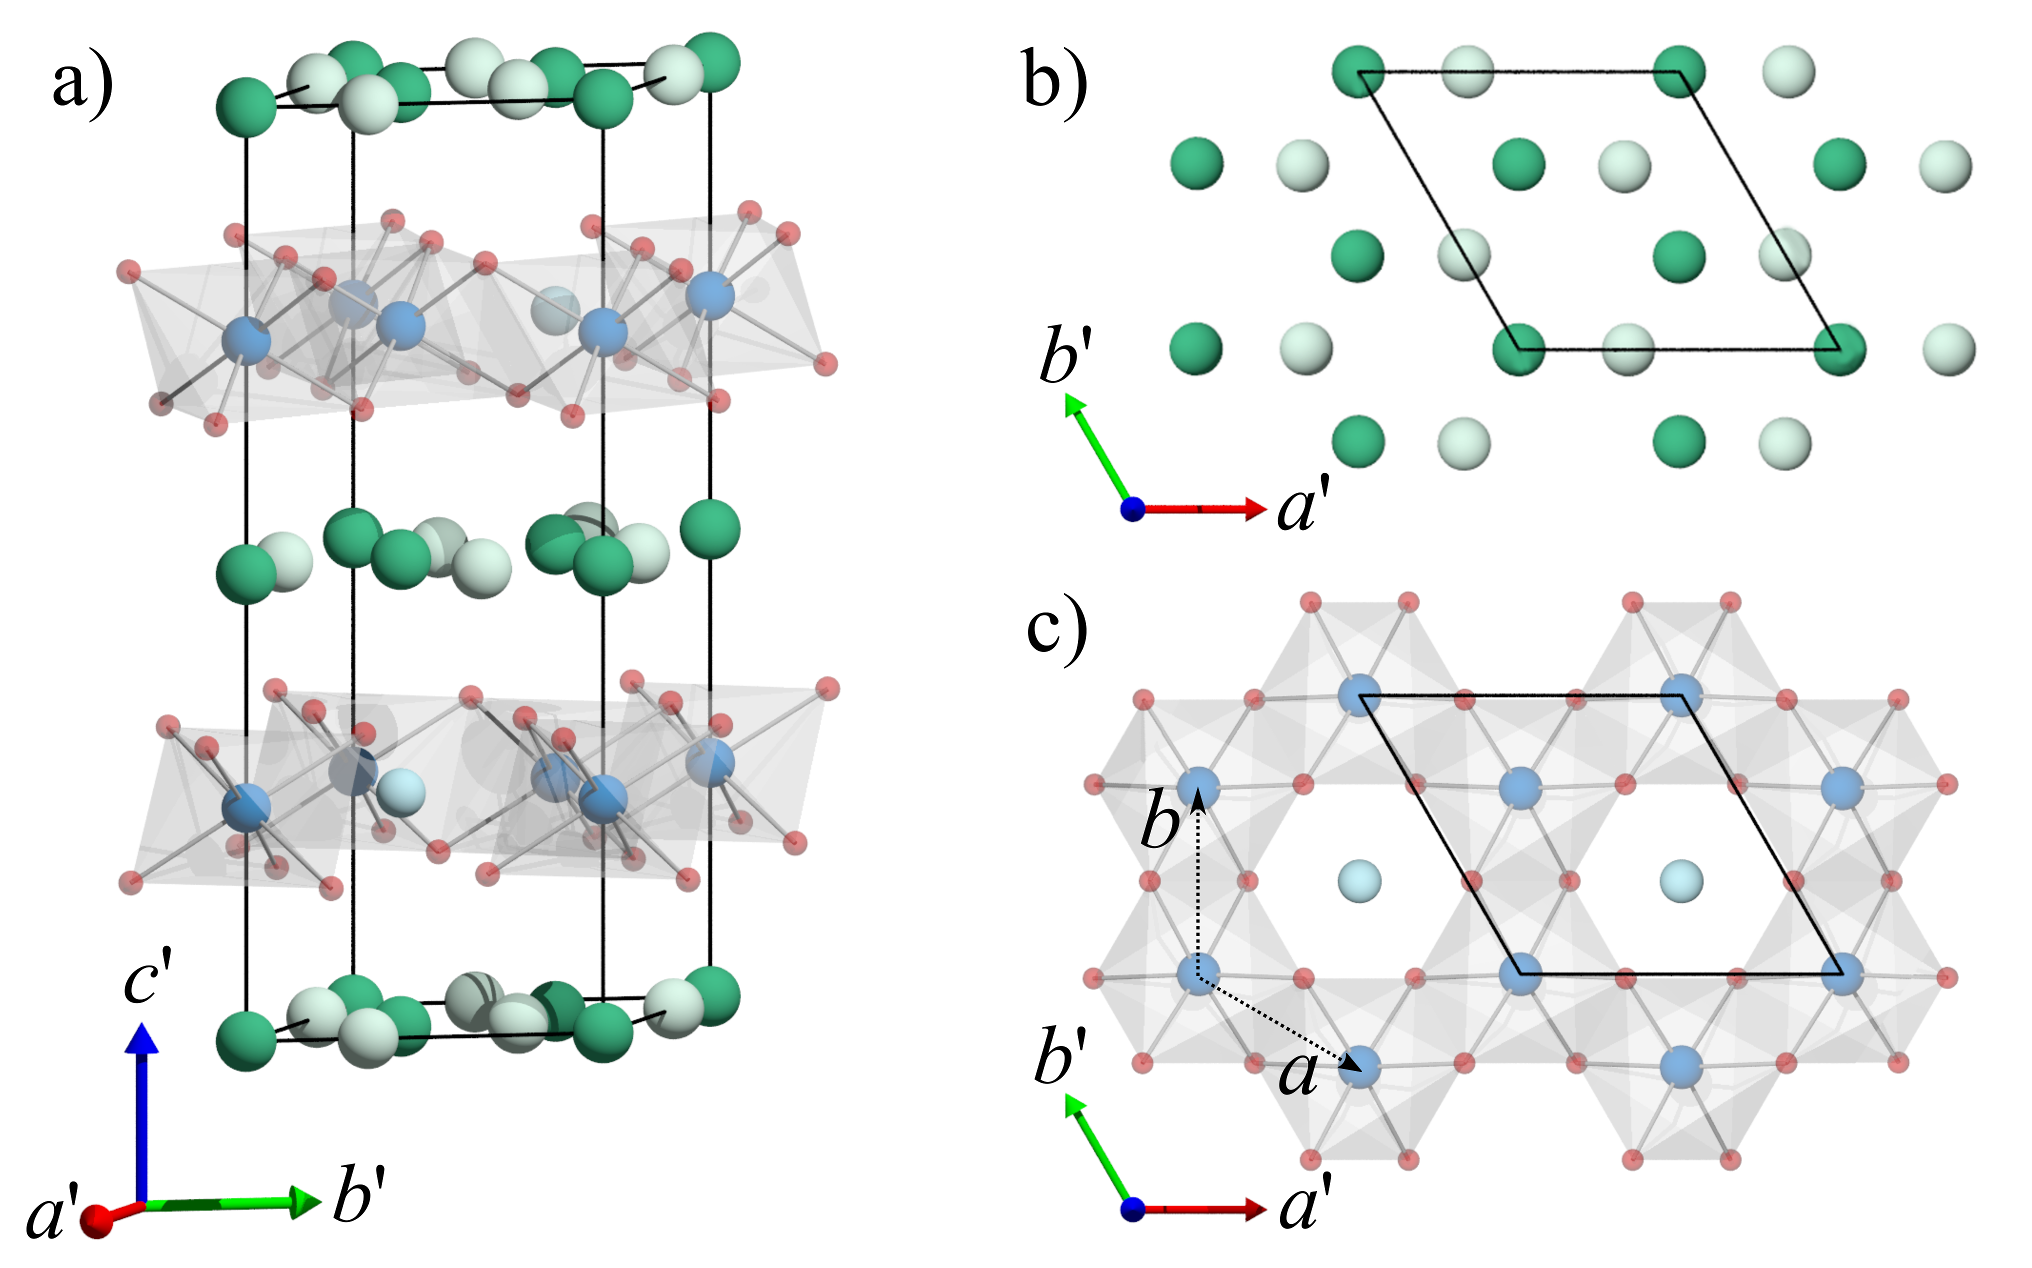
The composition of this sample was refined to K0.85Ir0.79O2. We note that, compared to the Type I sample reported above, the increased potassium content is consistent with the contraction of the lattice parameter through greater inter-layer bonding (the same effect is observed in NaxCoO2 Huang et al. (2004)). Furthermore, the plane was found to contract upon formation of the honeycomb layers. DFT calculations were used to test the structural model, which was found to be stable for the refined composition. Relaxation of the atomic fractional coordinates within the experimentally determined unit cell metric gave small shifts () in all but one of the freely varying atomic fractional coordinates. A significant shift in the K12 coordinate, located directly above or below the honeycomb centre, was found to be strongly dependent upon the iridium occupation of the honeycomb centre (Ir3) site. A DFT relaxation performed on model structures with extremal compositions K0.1Ir0.975O2 (0.925 Ir3 occupation) and K1Ir0.75O2 (0.25 Ir3 occupation) gave K12 coordinates of -0.015 and -0.058, respectively, clearly indicating that in theory the K12 potassium ion relaxes towards the honeycomb centre in the absence of an Ir3 ion. It was therefore surprising to find that the experimental K12 coordinate was refined to -0.006(4), despite the relatively low occupation of the Ir3 site. This discrepancy can be reconciled by considering the preferential occupation of (K11,K12) or K2 triangular substructures for both extremes of Ir3 occupation. Further DFT relaxations demonstrated that the K2 site is preferentially occupied when the Ir3 occupation is low, and that the (K11,K12) sites are preferentially occupied when the Ir3 occupation is close to one. Although we have to consider an average occupation of potassium sites in the SXD data analysis, it is unphysical for both to be (partially) occupied in the same unit cell. A more realistic picture is one in which extended regions of the sample have potassium located in either the (K11,K12) or the K2 sites. If the former region also has an Ir3 occupation close to one, as indicated by DFT, the K12 ion never has the opportunity to relax into the honeycomb centres and its coordinate will refine to on average, independent of the average Ir3 site occupation.
In summary, the Type II crystal structure adopted by the KxIr1-x/4O2 solid solution is composed of honeycomb layers of edge-sharing Ir4+O6 octahedra, where every iridium site of the honeycomb is fully occupied, but the honeycomb centre has a reduced iridium occupation. Neighbouring honeycomb layers are related by a 180∘ rotation. Potassium ions fill the inter-layer space with an equal, partial occupation of two triangular substructures such that for a given K:Ir compositional ratio iridium maintains a 4+ oxidation state.
We note that the Type II structure is different to that of other structures of stacked honeycombs of edge-shared IrO6 octahedra. In particular, in the layered iridates Na2IrO3 Choi et al. (2012); Hwan Chun et al. (2015) and -Li2IrO3 Williams et al. (2016) successive honeycombs are stacked with a constant in-plane offset perpendicular to an Ir-Ir bond, leading to an overall monoclinic (C2/m) structure, with a typical spacing between adjacent layer centres of and , respectively. To the contrary, in honeycomb KxIryO2 successive honeycomb centres are stacked with an alternating in-plane offset parallel to an Ir-Ir bond, resulting in a two-layer hexagonal structure (, Fig. 4), with a spacing between layer centres of .
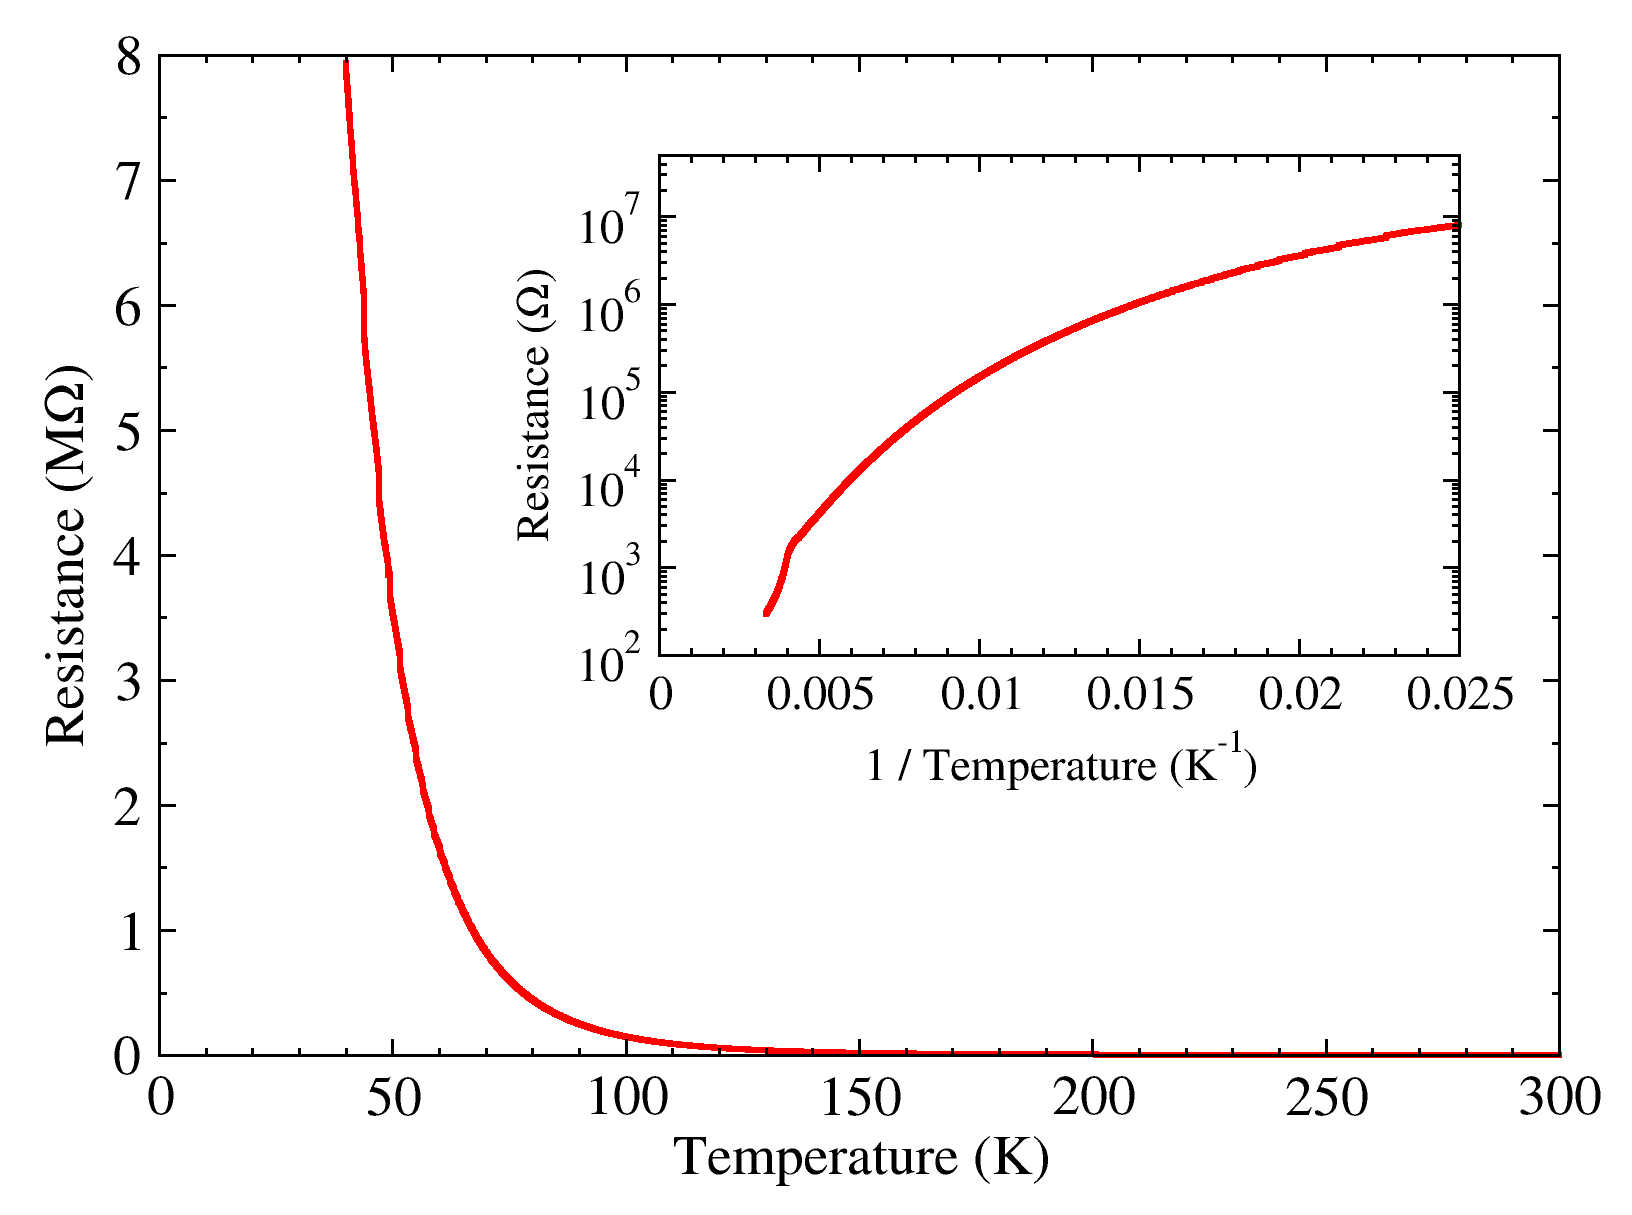
III.3 Resistivity
The DC electrical resistance at the surface of a KxIr1-x/4O2 single crystal was measured as a function of temperature (Figure 5). The resistance was found to rapidly increase upon cooling, clearly demonstrating insulating behaviour, and hence directly supporting our previous hypothesis that the KxIr1-x/4O2 materials are Mott insulators. The inset to Figure 5 shows the same resistance data on an Arrhenius plot. The non-linearity indicates a departure from conventional activated behaviour, as was observed for the related spin-orbit Mott insulator Na2IrO3 Singh and Gegenwart (2010). An anomalous drop in the resistance above K is visible in the Figure 5 inset near 1/T = 0.004 K-1. No such anomaly was observed in Na2IrO3 Singh and Gegenwart (2010), which may indicate a cross-over between two different conduction processes, and we note that the partial occupation of potassium sites may introduce significant ionic conductivity in KxIr1-x/4O2.
IV Discussion
In order to further substantiate our proposed phase diagram (Fig. 1) we performed a series of DFT calculations to explore the boundary between Type I and Type II structures, as well as the structures of the end systems (IrO2 and the hypothetical K2IrO3). For the former case, we carried out structural relaxations of KxIr1-x/4O2 at various fractional occupancies between x = 0.616 and 0.868 within the VCA approximation as described in Section II. While for the calculations converge into a Type I structure, for the relaxed structures are compatible with a Type II structure establishing the region between as the phase boundary between the two structural models. Interestingly, the transition region is close to equal amounts of Ir and K.
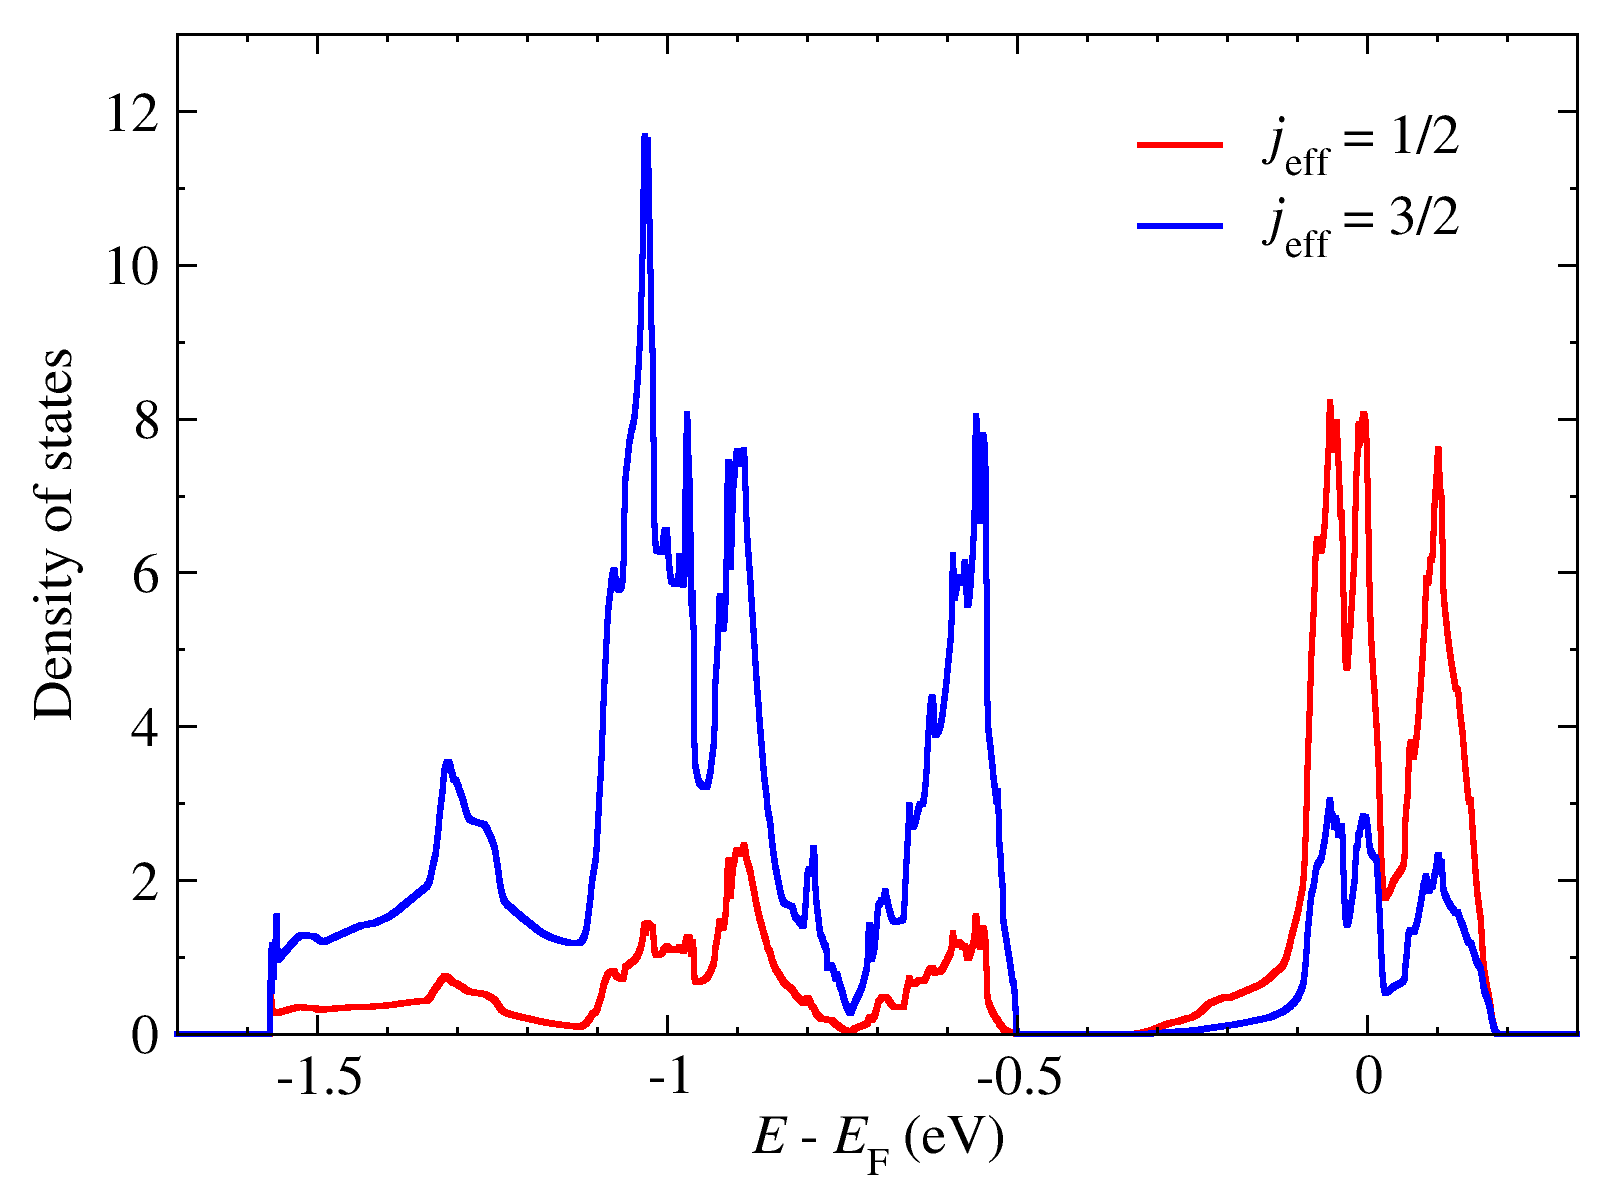
The analysis of the end compounds in Fig. 1 brings a few new aspects into our study. For IrO2 we found that the most frequently adopted rutile structure Goldschmidt et al. (1926) is only about 224.4 meV/atom (in GGA+SOC calculations) more stable than the (hypothetical) Type I structure consisting of triangular layers of Ir. Actually, similar conclusions were drawn by a recent study on a two-dimensional variant of IrO2 Smolyanyuk et al. (2019). Our observation suggests that a structural phase transition between the Type I structure and the rutile structure is to be expected at very low values. On the other hand, for the far right hypothetical end compound K2IrO3, DFT structural relaxation calculations suggest that the honeycomb structure is locally stable (for the predicted structural parameters see Table 6 in Appendix C) even though relatively small K-O bond lengths of 2.45 Å at the honeycomb centre are found (for comparison, the K-O bond length at the honeycomb centres in K2PbO3 is 2.76 at room temperature Delmas et al. (1976)). While this structure may not be realizable at ambient conditions, it could be explored by high-pressure synthesis techniques. The electronic properties of the theoretically-proposed K2IrO3 reveal a similar spin-orbit-assisted-Mott-insulator behavior to the layered honeycomb materials -Li2IrO3 Winter et al. (2016b), Na2IrO3 Foyevtsova et al. (2013) and -RuCl3 Johnson et al. (2015). Fig. 6 shows the relativistic (GGA+SO) density of states to be dominantly with a small contribution from at the Fermi level. Addition of a small onsite Coulomb repulsion U (not shown) opens accordingly a gap in the density of states.
Based on the relativistic basis, we calculated the effective model for the Z-bond
| (1) | |||
| (2) |
and found (, , , ) (-3.2, -23.2, -1.6, 9.7) meV. Remarkably, these values situate this system near the Kitaev limit.
Finally, as discussed in Section III, our relativistic DFT calculations for KxIr1-x/4O2 for all values are compatible with the assumption of a Ir4+ oxidation state and the presence of vacancies. In this case, previous model calculations Kim et al. (2017) including spin-orbit coupling, electronic correlations and crystal-field effects show that these systems are in the regime of spin-orbit Mott insulators.
V Conclusion
In summary, we have reported structural studies of recently-synthesized single crystals of KxIryO2, with potassium intercalating triangular layers of edge-sharing IrO6 octahedra. We have proposed that the strong spin-orbit coupling of iridium cations disfavours fractional Ir valence and metallic conductivity (as observed in the iso-structural families with Ir replaced by Co or Ru), but instead stabilises a spin-orbit Mott insulator with all Ir sites in the 4+ oxidation state. In this case, charge neutrality for different potassium compositions, , is achieved via the introduction of Ir vacancies, . We have presented structural relaxation calculations that predict that the vacancies are randomly distributed over the triangular Ir substructure up to a critical concentration, , above which they order at the centres of a honeycomb structure of fully-occupied Ir sites. The two structural models either side of were refined against representative x-ray diffraction data sets, which were both found to be in excellent quantitative agreement with ab-initio calculations. Our results suggest that KxIr1-x/4O2 may realize a platform to explore Kitaev magnetism of strong spin-orbit coupled magnetic moments in a structural framework that interpolates between triangular and honeycomb structures.
Acknowledgements.
RDJ acknowledges support from a Royal Society University Research Fellowship, RV acknowledges support from the Deutsche Forschungsgemeinschaft (DFG) through grant VA117/15-1, IB acknowledges support from a University of Oxford Clarendon Fund Scholarship, and KM acknowledges University Grants Commission - Council of Scientific & Industrial Research India for a fellowship. This research was partially supported by the European Research Council (ERC) under the European Union’s Horizon 2020 research and innovation programme Grant Agreement Number 788814 (EQFT) and by the EPSRC (UK) under Grant No. EP/M020517/1.References
- Rau et al. (2015) J. G. Rau, E. K.-H. Lee, and H.-Y. Kee, Annual Review of Condensed Matter Physics 7, 195 (2015).
- Winter et al. (2017) S. M. Winter, A. A. Tsirlin, M. Daghofer, J. van den Brink, Y. Singh, P. Gegenwart, and R. Valentí, J, Phys: Condens. Matter 29, 493002 (2017).
- Williams et al. (2016) S. C. Williams, R. D. Johnson, F. Freund, S. Choi, A. Jesche, I. Kimchi, S. Manni, A. Bombardi, P. Manuel, P. Gegenwart, and R. Coldea, Phys. Rev. B 93, 195158 (2016).
- Hwan Chun et al. (2015) S. Hwan Chun, J.-W. Kim, J. Kim, H. Zheng, C. C. Stoumpos, C. D. Malliakas, J. F. Mitchell, K. Mehlawat, Y. Singh, Y. Choi, T. Gog, A. Al-Zein, M. M. Sala, M. Krisch, J. Chaloupka, G. Jackeli, G. Khaliullin, and B. J. Kim, Nat. Phys. 11, 462 (2015).
- Banerjee et al. (2016) A. Banerjee, C. Bridges, J.-Q. Yan, A. Aczel, L. Li, M. Stone, G. Granroth, M. Lumsden, Y. Yiu, J. Knolle, D. Kovrizhin, S. Bhattacharjee, R. Moessner, D. Tennant, D. Mandrus, and S. Nagler, Nature Materials 59, 733 (2016).
- Takayama et al. (2015) T. Takayama, A. Kato, R. Dinnebier, J. Nuss, H. Kono, L. S. I. Veiga, G. Fabbris, D. Haskel, and H. Takagi, Phys. Rev. Lett. 114, 077202 (2015).
- Biffin et al. (2014a) A. Biffin, R. D. Johnson, S. Choi, F. Freund, S. Manni, A. Bombardi, P. Manuel, P. Gegenwart, and R. Coldea, Phys. Rev. B 90, 205116 (2014a).
- Biffin et al. (2014b) A. Biffin, R. D. Johnson, I. Kimchi, R. Morris, A. Bombardi, J. G. Analytis, A. Vishwanath, and R. Coldea, Phys. Rev. Lett. 113, 197201 (2014b).
- Rousochatzakis et al. (2016) I. Rousochatzakis, U. K. Rössler, J. van den Brink, and M. Daghofer, Phys. Rev. B 93, 104417 (2016).
- Kimchi and Vishwanath (2014) I. Kimchi and A. Vishwanath, Phys. Rev. B 89, 014414 (2014).
- Huang et al. (2004) Q. Huang, M. L. Foo, R. A. Pascal, J. W. Lynn, B. H. Toby, T. He, H. W. Zandbergen, and R. J. Cava, Phys. Rev. B 70, 184110 (2004).
- Jansen and Hoppe (1974) M. Jansen and R. Hoppe, Z. Anorg. Allg. Chem. 408, 97 (1974).
- Hironaka et al. (2017) Y. Hironaka, K. Kubota, and S. Komaba, Chem. Commun. 53, 3693 (2017).
- Nakamura et al. (1996) S. Nakamura, J. Ohtake, N. Yonezawa, and S. Iida, J. Phys. Soc. Japan 65, 358 (1996).
- Shibasaki et al. (2010) S. Shibasaki, T. Nakano, I. Terasaki, K. Yubuta, and T. Kajitani, Journal of Physics: Condensed Matter 22, 115603 (2010).
- Zhang et al. (2013) B.-B. Zhang, S.-T. Dong, Y. B. Chen, L.-Y. Zhang, J. Zhou, S. H. Yao, Z.-B. Gu, S.-T. Zhang, and Y.-F. Chen, Cryst. Eng. Comm. 15, 5050 (2013).
- Kim et al. (2017) A. J. Kim, H. O. Jeschke, P. Werner, and R. Valenti, Physical review letters 118, 086401 (2017).
- Delmas et al. (1976) C. Delmas, G. Demazeau, M. Devalette, C. Fouassier, and P. Hagenmuller, Journal of Solid State Chemistry 19, 87 (1976).
- Freund et al. (2015) F. Freund, S. C. Williams, R. D. Johnson, R. Coldea, P. Gegenwart, and A. Jesche, Scientific Reports 6, 35362 (2015).
- Rodríguez-Carvajal (1993) J. Rodríguez-Carvajal, Physica B 192, 55 (1993).
- Kresse and Hafner (1993) G. Kresse and J. Hafner, Phys. Rev. B 47, 558 (1993).
- Kresse and Furthmüller (1996) G. Kresse and J. Furthmüller, Phys. Rev. B 54, 11169 (1996).
- Kresse and Furthm??ller (1996) G. Kresse and J. Furthm??ller, Computational Materials Science 6, 15 (1996).
- Perdew et al. (1996) J. P. Perdew, K. Burke, and M. Ernzerhof, Phys. Rev. Lett. 77, 3865 (1996).
- Blöchl (1994) P. E. Blöchl, Phys. Rev. B 50, 17953 (1994).
- Mazin (2010) I. I. Mazin, Physical Review B 81, 140508(R) (2010).
- Blaha et al. (2001) P. Blaha, K. Schwarz, G. K. H. Madsen, D. Kvasnicka, and J. Luitz, (2001).
- Winter et al. (2016a) S. M. Winter, Y. Li, H. O. Jeschke, and R. Valentí, Phys. Rev. B 93, 214431 (2016a).
- Sörgel and Jansen (2005) T. Sörgel and M. Jansen, Z. Anorg. Allg. Chem. 631, 2970 (2005).
- Choi et al. (2012) S. K. Choi, R. Coldea, A. N. Kolmogorov, T. Lancaster, I. I. Mazin, S. J. Blundell, P. G. Radaelli, Y. Singh, P. Gegenwart, K. R. Choi, S.-W. Cheong, P. J. Baker, C. Stock, and J. Taylor, Phys. Rev. Lett. 108, 127204 (2012).
- Singh and Gegenwart (2010) Y. Singh and P. Gegenwart, Phys. Rev. B 82, 064412 (2010).
- Goldschmidt et al. (1926) V. Goldschmidt, T. Barth, D. Holmsen, G. Lunde, and W. Zachariasen, (1926).
- Smolyanyuk et al. (2019) A. Smolyanyuk, M. Aichhorn, I. Mazin, and L. Boeri, arXiv preprint arXiv:1907.01966 (2019).
- Winter et al. (2016b) S. M. Winter, Y. Li, H. O. Jeschke, and R. Valenti, Physical Review B 93, 214431 (2016b).
- Foyevtsova et al. (2013) K. Foyevtsova, H. O. Jeschke, I. I. Mazin, D. I. Khomskii, and R. Valenti, Physical Review B 88, 035107 (2013).
- Johnson et al. (2015) R. D. Johnson, S. C. Williams, A. A. Haghighirad, J. Singleton, V. Zapf, P. Manuel, I. I. Mazin, Y. Li, H. O. Jeschke, R. Valenti, and R. Coldea, Physical Review B 92, 235119 (2015).
- Campbell et al. (2006) B. J. Campbell, H. T. Stokes, D. E. Tanner, and D. M. Hatch, J. Appl. Crystallogr. 39, 607 (2006).
- Stokes et al. (2007) H. T. Stokes, D. M. Hatch, and B. J. Campbell, “Isotropy,” (2007).
Appendix A Symmetry Analysis
In this Appendix we present a symmetry analysis of the phase transition from the parent triangular structure (Type I) to the honeycomb super-structure (Type II), based on symmetry-adapted modes of atomic site occupations, and we conclude that the proposed space group is the unique solution to describe the Type II structure. The analysis calls upon two results drawn directly from the diffraction data presented in the main text. Firstly, the triple cell peaks can be indexed using the propagation vector , defined with respect to the parent hexagonal lattice. Secondly, the intensity of the triple cell peaks is of a similar order of magnitude to the main diffraction peaks, indicating that their origin lies in a modulation of iridium site occupancies.
We define the occupation of iridium site as
| (3) |
where is the amplitude of mode , is the scalar value of mode at site , and the sum is taken over all modes. There are 6 iridium sites in the super-cell, for which there are 4 physically real, linearly independent symmetry-adapted modes for , and 2 linearly independent symmetry-adapted modes for , as calculated using isodistortCampbell et al. (2006); Stokes et al. (2007) and given in Table 3.
| Fractional Coordinates | modes | modes | ||||||
| Site | Parent | super-cell | ||||||
| Ir1_1 | 1 | 0 | 1 | 0 | 1 | 1 | ||
| Ir2_1 | -1/2 | -1/2 | -1/2 | -1/2 | 1 | 1 | ||
| Ir3_1 | -1/2 | 1/2 | -1/2 | 1/2 | 1 | 1 | ||
| Ir1_2 | 1 | 0 | -1 | 0 | 1 | -1 | ||
| Ir2_2 | -1/2 | 1/2 | 1/2 | -1/2 | 1 | -1 | ||
| Ir3_2 | -1/2 | -1/2 | 1/2 | 1/2 | 1 | -1 | ||
We can assume that the phase transition between triangular and honeycomb structures is driven by a primary order parameter (OP) associated with an irreducible representation (irrep) of . This primary OP may couple to secondary, structural OPs associated with other or irreps (i.e. coupling to the totally symmetric representation, , is always allowed by symmetry). The -point reducible representation for the atomic occupation of the iridium sites (Wyckoff site 2a in the parent space group ), decomposes into two 2D irreducible representations, and . Similarly, the -point reducible representation decomposes into two 1D irreducible representations, and .
Using isodistortCampbell et al. (2006); Stokes et al. (2007) we have determined all super-space groups of the parent structure that correspond to the symmetry-distinct directions of the primary OPs in the space spanned by the and irreps (Table 4). In all cases the super-cell is defined using the basis with respect to the parent. For all super-space groups there is no origin shift, except for where the origin is shifted by (0,0,1/4) with respect to the parent. For each super-space group listed in Table 4 we give the irrep. of the primary symmetry breaking OP and the respective symmetry-adapted mode(s). We also list the secondary modes (and their irreps., given in parenthesis), which are symmetry allowed within the given super-space group and can couple to the primary order parameter. We note that if the phase transition involves secondary modes it will necessarily be of first order.
| Space | Irreducible | Primary | Secondary |
|---|---|---|---|
| group | representations | modes | modes |
| () | |||
| () | , | ||
| (, ) | , | ||
| (, , ) | , , | ||
| (, , ) | , | , , , |
As shown in the main text, the Type II honeycomb structure can be identified by additional diffraction peaks when compared to the diffraction pattern of the parent, Type I structure. These additional peaks satisfy the reflection conditions or and (, integers) where, as in the main text, primed indices indicate that the wavevector components are defined with respect to the super-cell. Corresponding diffraction reflection conditions derived from structure factor calculations of the symmetry adapted modes are given in Table 5. We find that the observed reflection conditions are only consistent with either or being the primary OP mode. We can rule out as it corresponds to an unphysical imbalance in the total iridiuim occupaction of neighbouring layers, and hence we find this symmetry analysis to be in full support of the experimentally determined Type II honeycomb structure with space group presented in the main text.
| Mode | Reflection conditions (, integers) | |
|---|---|---|
| or | ||
| or | ||
| or | ||
| or | ||
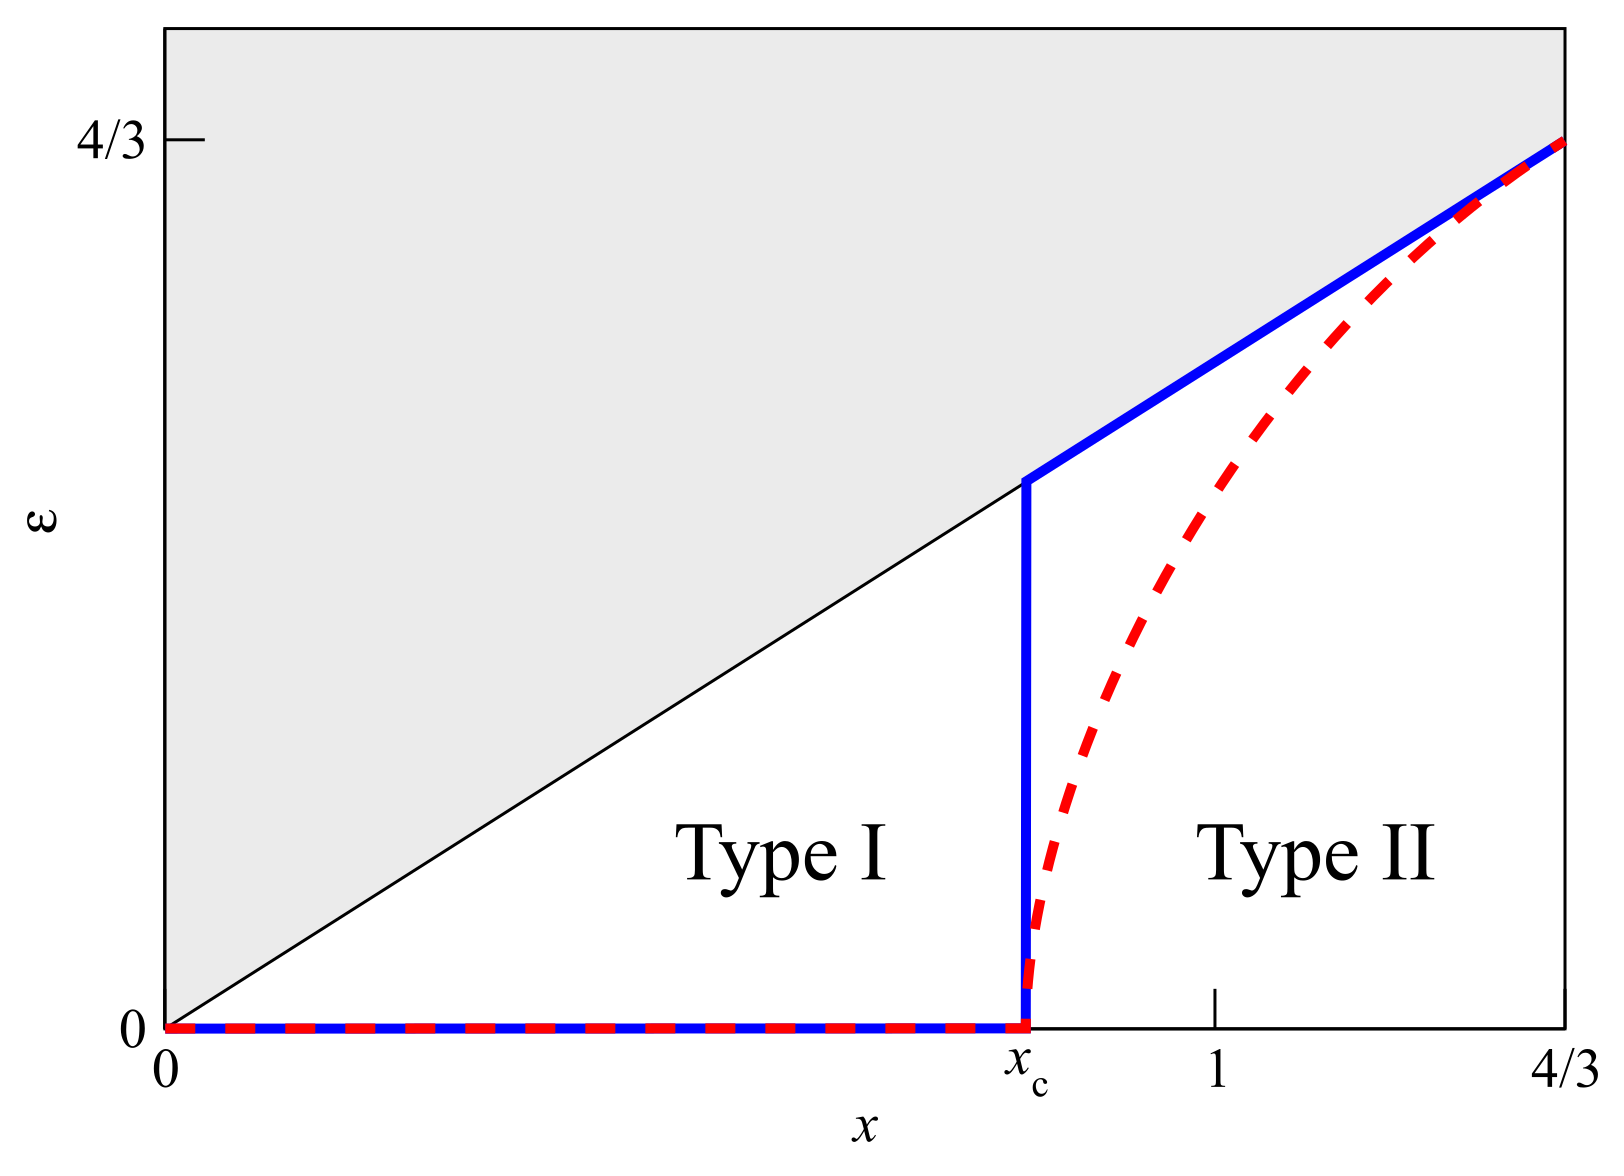
We can now construct a symmetry-based model for the occupation of the iridium sites that fully captures the structural evolution of KxIr1-x/4O2 as a function of , from the parent Type I phase to the lower symmetry, Type II phase, as hypothesised in the Introduction. Consider the linear combination of , , and modes,
| (4) |
where the parameter is the potassium composition. The amplitude describes the iridium site occupation, and is the order parameter describing the Type I to Type II structural phase transition (the leads to two equivalent descriptions of the Type II structure related by an origin shift). The prefactor of the second term is chosen such that (see below). In the Type I phase , and the iridium sublattice is uniformly depleated. Just above a critical composition, , the parameter and a phase transition to the Type II structure occurs. This parameter space is summarised in Figure 7. It is required that to avoid unphysical site occupancies (grey shaded region Figure 7). Immediately above , may jump to its maximium value and continue to grow as . In this case the honeycomb structure is always fully occupied, with all iridium vacancies located at the honeycomb centres (blue solid line in Figure 7). Alternatively, may grow gradually (red dashed line in Figure 7), giving a uniformly depleated honeycomb structure, but with vacancies preferentially located at the honeycomb centres. In both cases the phase transition is first order, but weakly so in the latter. We note that the x-ray diffraction data cannot distinguish between the two scenarios, so for concreteness in the analysis presented in the main text we assumed that iridium vacancies are located only at the honeycomb centres (blue line scenario in Fig. 6) at site Ir3, which corresponds to the minus sign in the second term of Equation 4.
Appendix B X-ray diffraction goodness-of-fit
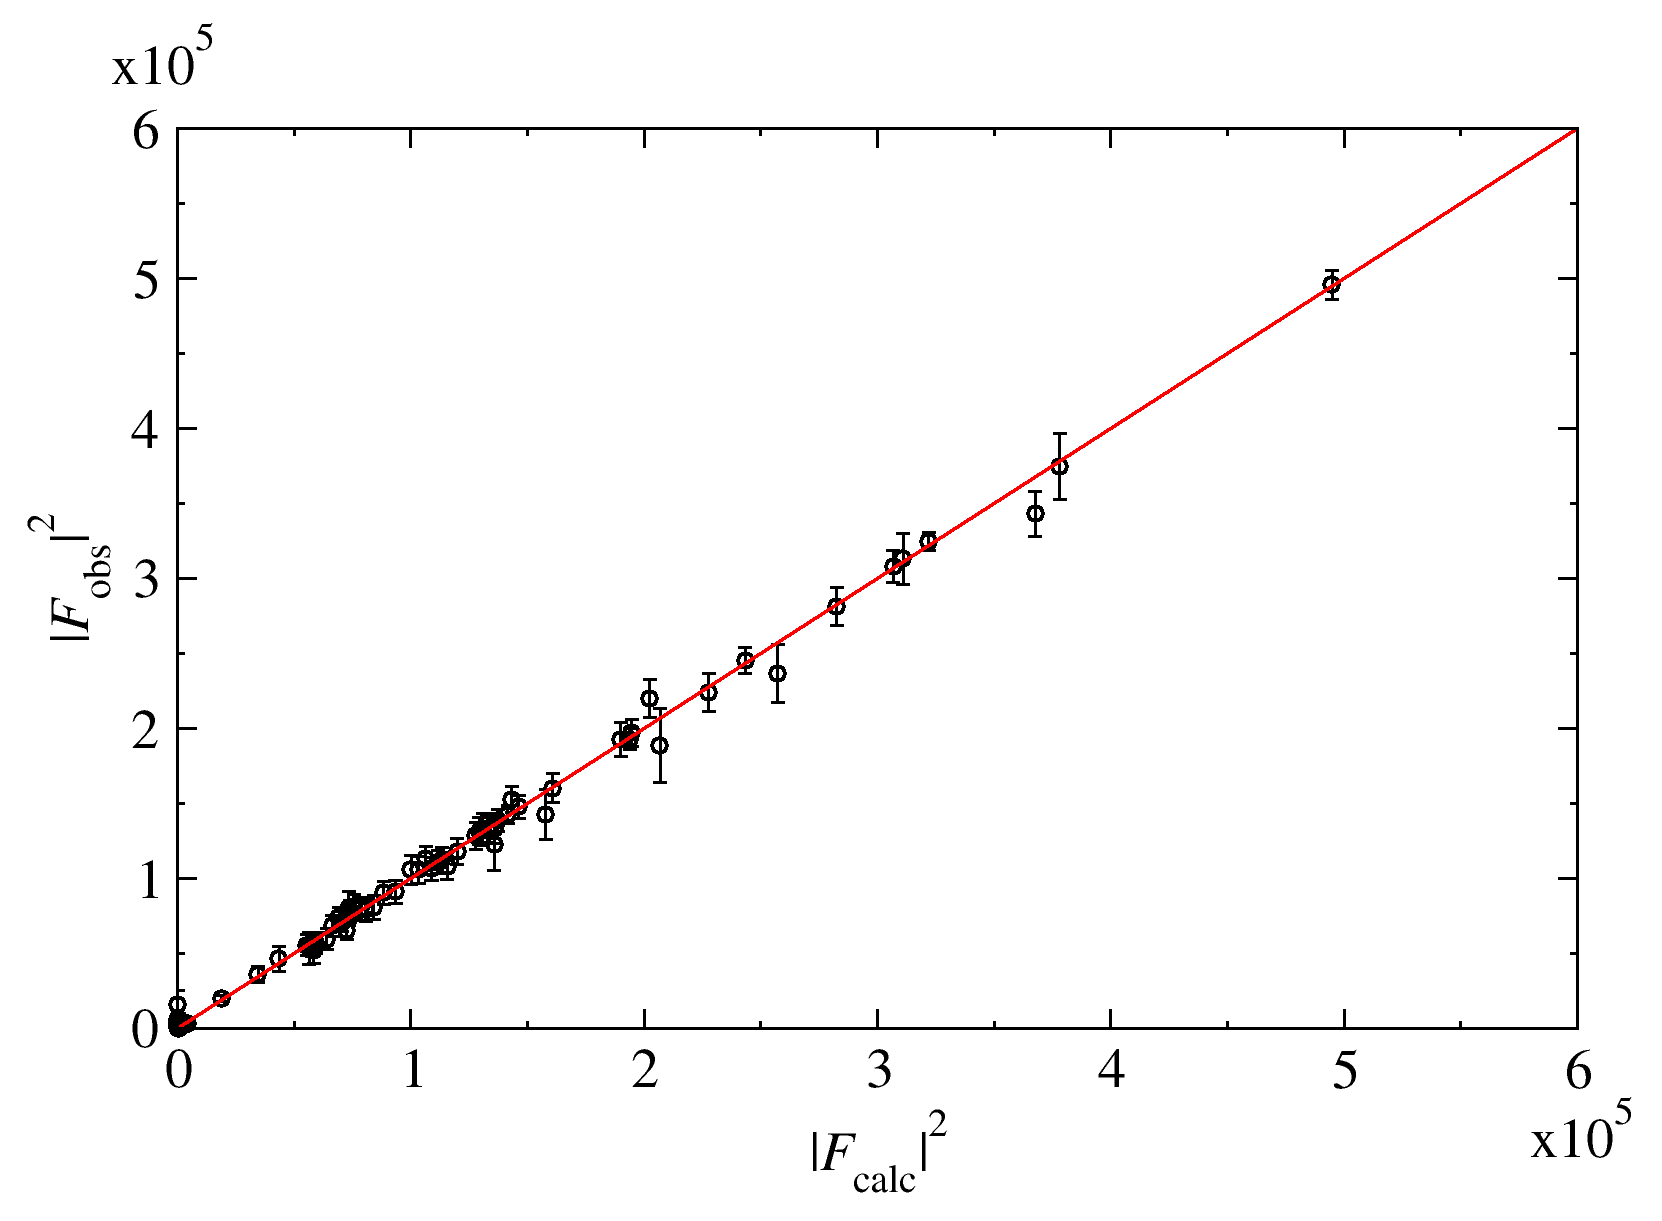
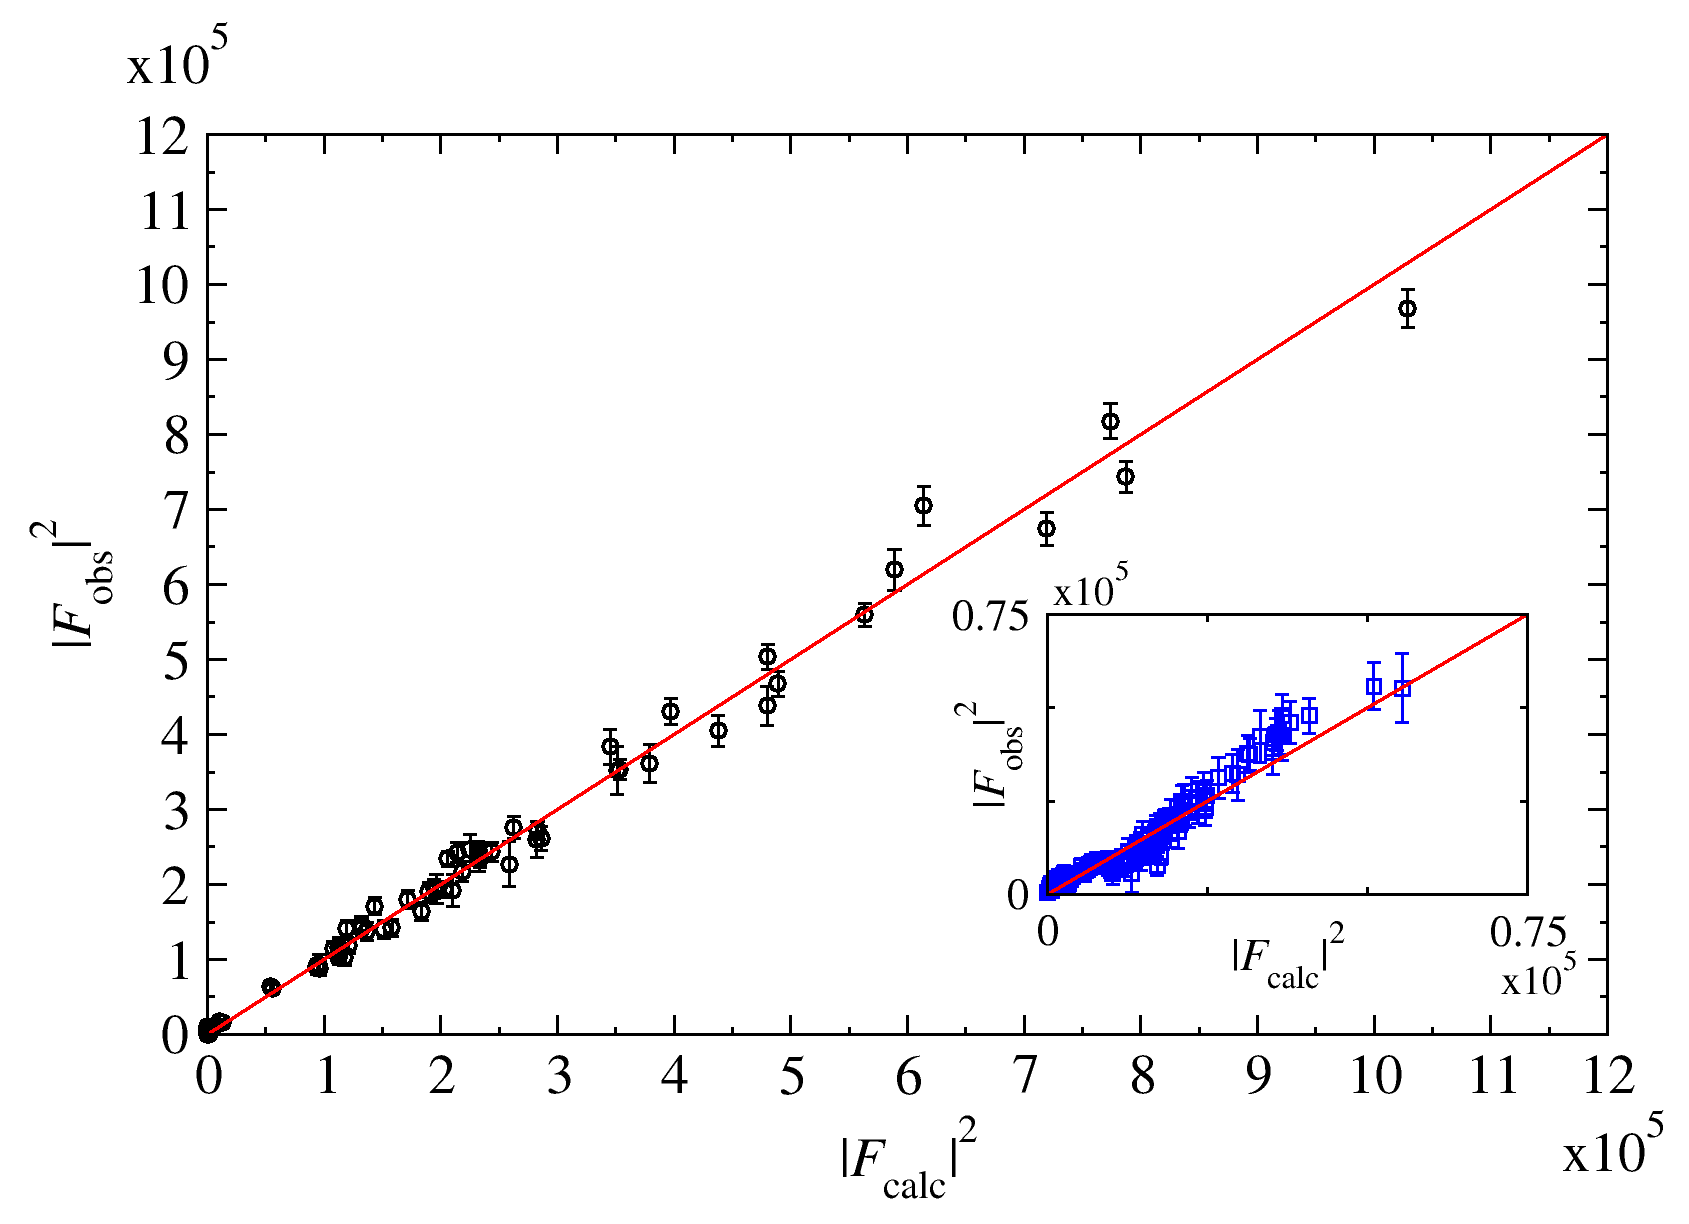
In this Appendix we show the measured, Lorentz-corrected x-ray diffraction intensities, , plotted against calculated values from the Rietveld refinement of the Type I (Figure 8) and Type II (Figure 9) structural models described in the main text. In both figures the ‘parent’ diffraction intensities are plotted as black circles, and the triple-cell peaks of the Type II honeycomb structure are shown in the inset to Figure 9 (blue squares). The average amplitude (square root of ) of the triple cell peaks is approximately 30% of the average parent peak amplitude, indicating that their origin lies in a super-structure modulation of the strongly scattering iridium sublattice.
Appendix C Theoretical K2IrO3 crystal structure
In this Appendix we tabulate crystal structure parameters for the theoretically proposed end-member composition K2IrO3. Note that the previously named ‘Ir3’ site is relabelled ‘K3’ as for this structure it is solely occupied by potassium.
| Cell parameters | |||||
| Space group: (#182) | |||||
| (): 5.282, 5.282, 13.544 | |||||
| Volume () 327.25 | |||||
| Atomic fractional coordinates | |||||
| Atom | Site | Occ. | |||
| Ir1 | 0 | 0 | 1/4 | 1 | |
| Ir2 | 1/3 | 2/3 | 1/4 | 1 | |
| K3(Ir3) | 2/3 | 1/3 | 1/4 | 1 | |
| K2 | 0 | 0.34107 | 0 | 1 | |
| O | 0.33275 | 0.26870 | 0.15667 | 1 | |
| Selected bond lengths () | |||||
| K2 - O 2.5654, 2.8580, 2.9000 | Ir1 - O 2.0511 | ||||
| K3 - O 2.4515 | Ir2 - O 2.0550 | ||||