uPredict: A User-Level Profiler-Based Predictive Framework
for Single VM Applications in Multi-Tenant Clouds
Abstract.
Most existing studies on performance prediction for virtual machines (VMs) in multi-tenant clouds are at system level and generally require access to performance counters in hypervisors. In this work, we propose uPredict, a user-level profiler-based performance predictive framework for single-VM applications in multi-tenant clouds. Here, three micro-benchmarks are specially devised to assess the contention of CPUs, memory and disks in a VM, respectively. Based on measured performance of an application and micro-benchmarks, the application and VM-specific predictive models can be derived by exploiting various regression and neural network based techniques. These models can then be used to predict the application’s performance using the in-situ profiled resource contention with the micro-benchmarks. We evaluated uPredict extensively with representative benchmarks from PARSEC, NAS Parallel Benchmarks and CloudSuite, on both a private cloud and two public clouds. The results show that the average prediction errors are between 9.8% to 17% for various predictive models on the private cloud with high resource contention, while the errors are within 4% on public clouds. A smart load-balancing scheme powered by uPredict is presented and can effectively reduce the execution and turnaround times of the considered application by 19% and 10%, respectively.
1. Introduction
Cloud computing has been adopted by many organizations as their main computing infrastructure due to its low cost of ownership and flexible resource management (RightScale, 2018). However, applications running on the clouds, especially on the public clouds, usually share hardware resources with other virtual machines (VMs) and applications from other cloud users/tenants. Such hardware resource sharing among multiple tenants causes resource contention, which in turn degrades the performance of applications running on clouds (Leitner and Cito, 2016). Moreover, the resource contention can vary due to changes of co-located VMs and their applications, which makes a target cloud application experience uncontrolled performance variations and fluctuations at runtime (Iosup et al., 2011; Ostermann et al., 2010).
However, to maximize the cost benefits of cloud deployments with optimal resource allocation (Mao and Humphrey, 2011; Malawski et al., 2012), or to satisfy the timeliness requirements of time-sensitive applications (Begam et al., 2018), cloud users may need to have an accurate knowledge of the performance of their applications. For such a purpose, cloud users need facilities and tools to predict the performance of their applications under various levels of resource contention at runtime. While there have been many studies proposed to predict an application’s performance under hardware resource contention (Delimitrou and Kozyrakis, 2013b; Romero and Delimitrou, 2018; Mars et al., 2011; Tang et al., 2013; Novaković et al., 2013; Mishra et al., 2017), they usually rely on the access to and control over the underlying execution environment, which makes them not applicable for cloud users.
Cloud services are typically offered to users as black boxes, where a user cannot control the cloud execution environment to specify the set of VMs/applications that should be executed together to share hardware resources. As a result, it is hard for a cloud user to obtain an isolated execution environment to profile an application’s contention sensitivity on the cloud service’s hardware as did in prior work (Delimitrou and Kozyrakis, 2013b; Romero and Delimitrou, 2018; Mars et al., 2011). Moreover, as cloud users cannot select the co-runners of their applications, they have to measure or estimate the severity of resource contention and the associated impacts on their applications’ performance during execution. Given that cloud users generally have no direct access to the underlying hardware components and virtual machine hypervisors, they usually cannot utilize common execution inspection tools used by prior studies, such as hardware performance monitoring units (PMU), to obtain accurate estimations on the impact of the contention (Tang et al., 2013; Novaković et al., 2013; Mishra et al., 2017).
Therefore, it is imperative to design and develop performance prediction schemes for ordinary cloud users. Although some recent studies have addressed this problem, there are still some limitations. In (Yadwadkar et al., 2017), Yadwadkar et al. developed PARIS, which exploits resource profiling information to predict the performance of an application in a VM when it is deployed on different public cloud services. Similarly, Scheuner and Leitner employed micro-benchmarks to test and predict the performance of different types of VMs across public cloud services (Scheuner and Leitner, 2018), where a large number of micro-benchmarks have been deployed. Although these studies can predict an application’s average performance on various VMs and/or different cloud services, they cannot be utilized to predict the in-situ performance of an application while taking the runtime resource contention into consideration. An in-situ performance prediction model enables the users to schedule their tasks/requests to the VMs that provide the best performance during execution and thus to improve their quality of services (as illustrated with the case study in Section 5.6).
In this paper, focusing on single-VM applications, we propose uPredict, a user-level profiler-based predictive framework in multi-tenant Infrastructure-as-a-Service (IaaS) clouds. Here, to profile and assess the resource contention of a target VM that is caused by the colocated unknown VMs and their applications on the same host, three micro-benchmarks are devised to probe its CPUs, memory and disks, respectively. Note that, such resource contention can have various impacts on performance of different applications. To establish application-specific relationship between its performance and the profiled resource contention, the micro-benchmarks and an application are executed sequentially and repeatedly in a given VM to collect their performance data while the colocated unknown VMs/applications on the same host may change over time.
With the in-situ profiled resource contention of a VM by the micro-benchmarks and the measured performance of an application, the application/VM-specific performance predictive models can be built to learn the application’s sensitivity to the contention of different resources. In this work, we considered both regression and machine learning based techniques, including 2-degree polynomial regression (Zou and Hastie, 2005; Tibshirani, 1996; Hoerl and Kennard, 1970; Zhang, 2004), Support Vector Regression (SVR) (Gunn et al., 1998) and Neural Networks (NN) models (Hecht-Nielsen, 1992). The polynomial models are selected as they are fast to train and may work well if the relationship between an application’s performance and the profiled data from the micro-benchmarks is indeed polynomial. The SVR and NN models are selected for cases where the relationships are more complex than polynomial. Once an application/VM specific predictive model is derived, the micro-benchmarks can be executed to profile the VM’s resource contention in the current execution environment and the profiled resource contentiousness can be fed into the model to predict the application’s execution times.
We have evaluated uPredict extensively using the representative benchmark applications from PARSEC (Bienia, 2011), NAS Parallel Benchmarks (NPB) (Bailey, 2011) and CloudSuite (Ferdman et al., 2012) in three different clouds, including a private cloud with OpenStack, Amazon Web Services (AWS) (Amazon Web Services, [n. d.]) and Google Compute Engine (GCE) (Google Compute Engine, [n. d.]). First, we validated uPredict in the private cloud where the resource contention was introduced in a controlled manner through changing the number of background VMs and their applications after each given interval. The predicted performance using the predictive models for the considered benchmark applications is shown to be close to and follow the same pattern as the measured one, which in turn indicates that the micro-benchmarks can effectively assess the severity of resource contention when the background VMs/applications change. This illustrates the feasibility of performance prediction using uPredict for ordinary cloud users without the need of knowing or controlling the underlying execution environment.
The prediction errors (i.e., accuracy) of the considered predictive models were also evaluated. The results show that, for the considered applications and VMs, the NN-based models are generally more accurate with the average prediction errors being 9.8%, 3.8% and 3.4% for the private cloud, AWS and GCE, respectively. In comparison, the polynomial regression and SVR models perform slightly worse in the private cloud that has high resource contention with the average prediction errors being 17% and 13%, respectively. However, on AWS and GCE where the level of contention is lower than our private cloud, the polynomial regression models and SVR models have almost the same prediction errors on average compared to those of NN-based models. However, we would like to point out that, the NN-based models require hyperparameter optimizations, which can introduce larger training overheads.
As an application of uPredict, a case study on load-balancing for two VM servers on two different host machines was presented. For comparison, we considered a simple queue-based load-balancing scheme that makes load distribution based on the queue length (i.e., the number of requests) on each VM server without considering their resource contention. The results show that the uPredict based load-balancing can achieve about 19% reduction in average application execution times and 10% reduction in their turnaround times.
The main contributions of this work are summarized as follows:
-
(1)
A user-level profiler-based predictive framework, uPredict, is proposed, which aims at providing accurate performance prediction of single-VM applications for ordinary cloud users in multi-tenant cloud environment without the knowledge and controlling of co-located VMs and their applications;
-
(2)
Three micro-benchmarks are specially devised to profile and assess the contention of CPUs, memory and disks of a VM, respectively; Using the in-situ profiled resource contention data, both regression and neural network (NN) based techniques are exploited to build application/VM-specific performance predictive models;
-
(3)
The proposed framework, micro-benchmarks and various predictive models are evaluated extensively with the representative benchmark applications from several benchmark suites in both private and public clouds; A case study of utilizing uPredict in a smart load-balancing scheme was also investigated; The evaluation results show the feasibility and effectiveness of uPredict for ordinary cloud users.
The rest of the paper is organized as follows. Section 2 reviews closely related work. Section 3 discusses the micro-benchmarks that are devised to profile and assess the resource contention of a VM in multi-tenant environment. Section 4 presents the proposed uPredict framework and several predictive models. The experimental setups and evaluation results are discussed in Section 5. Section 6 points out the limitations of this study and our future works. Section 7 concludes the paper.
2. Closely Related Work
Cloud Performance Variation Analysis. Many research studies have observed and analyzed the performance variations of cloud applications (Schad et al., 2010; Hwang et al., 2016; Ou et al., 2013). Iosup et al. were among the first reporting the performance variations in public clouds (Iosup et al., 2011). The same research group also conducted an in-depth analysis of the performance variation on production public clouds (Ostermann et al., 2010; Iosup et al., 2011). Leitner and Cito conducted a performance analysis on multiple public clouds and observed that the resource contention is a major cause for single VM performance variations (Leitner and Cito, 2016). In a more recent study, Maricq et al. also presented large amount of data, suggesting the extensiveness of performance fluctuation in the clouds (Maricq et al., 2018). Our work is inspired by these studies on cloud performance variations.
Contention-aware Performance Prediction from Cloud Service Provider’s Perspective. There has been a flurry of research works on predicting application performance under resource contention from the perspective of cloud service providers and data center operators. Paragon is a heterogeneity and interference-aware data center scheduler (Delimitrou and Kozyrakis, 2013b). To make scheduling decisions, Paragon profiled its applications in a controlled environment to determine their contentiousness and sensitivity to contention. Quasar estimated the resources that a data center application required to meet its QoS goals by profiling its performance on specific hardware running with specific micro-benchmarks (Delimitrou and Kozyrakis, 2014). The idea of Paragon and Quasar was later extended to consider multiple levels of hardware heterogeneity in data centers (Romero and Delimitrou, 2018). Bubble-up characterized the sensitivity of a data center application and predicted the application’s performance under contention by injecting pressure into the memory system. (Mars et al., 2011). Bubble-flux dynamically injected pressure into the memory system to measure the application’s instantaneous sensitivity to contentions using readings from hardware Performance Monitoring Units (PMUs) (Yang et al., 2013). Govindan et al. designed synthetic benchmarks to clone the cache behaviors of a set of applications, which were later used to profile and predict the performance degradation when two applications running together (Govindan et al., 2011). Q-Clouds dynamically adapted the resource allocations for co-running VMs based on the run-time performance obtained from PMUs (Nathuji et al., 2010). ESP predicted the performance impact of contentions for a known set of applications using regularization (Mishra et al., 2017). Oktopus improved the performance predictability of a cloud system by offering virtualized network interfaces (Ballani et al., 2011).
These cloud-provider-side prediction methodologies typically required the control of the execution environment in their profiling phases, including directly specifying the hardware platforms and the co-running tasks used in the profiling. Many of these studies also assumed a known set of applications that might be executed and/or required accesses to low-level hardware PMUs. Our work, however, aims at performance prediction for ordinary cloud users who have no control of the execution environments, no knowledge of the co-running applications and no access to the hardware PMUs.
Performance Prediction from User’s Perspective. There were also studies on cloud performance prediction techniques for cloud users. Scheuner and Leitner employed micro-benchmarks to test and predict the performance of different types of VM instances across public cloud services (Scheuner and Leitner, 2018). They considered 23 different micro-benchmarks and validated the methodology against two applications. The authors also observed that not all micro-benchmarks were necessary for performance prediction. uPredict, however, employed a much smaller but clearly defined set of micro-benchmarks and was validated against 17 benchmarks with various behaviors.
PARIS predicts the performance of an application when it is deployed on different types of cloud instances (Yadwadkar et al., 2017). PARIS did not consider the impact of resource contention and experienced up to 50% RSME (Root Mean Squared Error). Li et al. predicted the performance of cloud applications when they were allocated with a different number of CPUs (Li et al., 2017). Ernest built performance models based on the behavior of the job on small inputs and then predicted the performance on larger data sets (Venkataraman et al., 2016). Baughman et al. employed online and offline profiling to predict an application’s performance when deployed on certain VM types with certain inputs (Baughman et al., 2018). Mariani et al. proposed to let cloud service providers build performance models to help user predict the performance of High-performance Computing (HPC) applications running on different VM types (Mariani et al., 2017). Wolf et al. proposed a method to automatically model the performance of HPC applications from limited profiling data to identify scalability bottlenecks (Wolf et al., 2016). PRIONN is an automated run time and I/O usage prediction tool for HPC clusters (Wyatt et al., 2018). Zhai et al. investigated large-scale HPC application performance prediction with deterministic replay (Zhai et al., 2016). Clemente-Castello et al. proposed a methodology to predict MapReduce application’s performance in hybrid clouds (Clemente-Castello et al., 2018). Friese et al. presented a novel hierarchical critical path analysis methodology to predict the performance of irregular applications (Friese et al., 2017). Jiang et al. proposed a model to predict whether a type of VM should be provisioned for a specific tier (e.g., web server and database) of a web application (Dejun et al., 2011). This model, however, does not consider the impact of resource contention. Farley et al. proposed a strategy to estimate the future performance of a VM based on the observed performance or resource usages (Farley et al., 2012).
Unlike uPredict, these studies did not intend to predict the performance of cloud applications under currently observed level of resource contention in multi-tenant clouds.
3. VM Performance Profiling
In a multi-tenant cloud environment, a VM normally shares and contends for the underlying hardware resources with other colocated VMs and applications. The deliverable performance to user applications by a VM depends heavily on resource contention in CPUs, memory and disks, especially for single-VM applications with limited network activities. Given that ordinary cloud users do not have access to hardware performance counters in the hypervisor and underlying hardware of the host machine, we focus on user-level profiling techniques to obtain the in-situ resource contention of a VM. Note that, although cloud users can retrieve the utilization of various (virtual) resources from a VM, such information does not reflect resource contention due to other colocated VMs and thus cannot indicate its actual performance. For example, a reading of 100% CPU utilization from a VM just indicates that all its virtual CPUs are fully utilized by user applications without any insight regarding to the actual deliverable performance for the applications.
Therefore, to infer the perceivable performance from the perspective of cloud user applications regarding to the resource contention of a VM, we employ several micro-benchmarks to assess its resource contention due to interference from other collocated VMs and applications on the same host machine. Intuitively, the slowed (or fastened) progress of a micro-benchmark reflects the increased (or decreased) contention for the corresponding resource. There are many micro-benchmarking tools available. Some are designed by vendors (e.g., Intel’s VTune Amplifier (Intel VTune Amplifier, [n. d.])). Some are open-source benchmarks (e.g., lmBench3 (LMbench, [n. d.]) and iozone). However, we decide to design and implement our own set of micro-benchmarks because of the limitations with existing micro-benchmarks and tools. Tools from the vendors may use Performance Monitoring Unit (PMU) counters (e.g., Intel VTune) to analyze the application behavior (e.g. cache miss). These tools are not applicable for cloud users, as cloud users do not have accesses to these low-level performance counters. Open-source benchmarks have restricted behaviors, such as the execution length and memory access patterns. Therefore, open-source benchmarks cannot be used in their original form. Because of these limitations, we implemented our own micro-benchmarks for the profiling. Our micro-benchmarks are based on the open-source benchmarks. However, they are designed to allow variable execution times (and thus variable profiling execution lengths) and variable memory/storage memory access patterns. By experimenting with different execution times and access patterns, it is possible to find the best profiling methodology empirically.
Prior work has shown that resource contention mainly happens in CPUs, memory, storage and network resources (Delimitrou and Kozyrakis, 2013b). Note that, for single-VM applications, the impact of network contention is negligible. Hence, we designed three micro-benchmarks for uPredict to probe the contention of CPUs, memory and disks, respectively. In the following paragraphs, we explain the detailed design of our micro-benchmarks.
3.1. Micro-benchmarks
CPUs: For contention in CPUs, a multi-threaded micro-benchmark is designed to stress the performance of the virtual CPUs of a given VM. Here, each thread maintains an in-register counter that is initiated with zero. During execution, the thread repeatedly increments the counter for a fixed amount of profiling execution time specified by the user. Such in-register operations ensure that the micro-benchmark’s performance is not affected by memory at runtime and thus examine the contention in CPUs to the maximum extent. The number of threads deployed in this micro-benchmark will be equal to the number of virtual CPUs of the target VM. The total number of increment operations carried out by all threads for the in-register counter will be recorded. In the end, this number () will be used as the indicator of the progress of this benchmark and the contention level for the virtual CPUs in the target VM.
Memory: Similarly, the memory micro-benchmark will try to stress the memory bandwidth of the target VM to the maximum extent. This micro-benchmark accesses a 2GB array with a stride of 128 byes. The objective of such a memory access pattern is to ensure that each data access is issued to off-core memory rather than the caches. Again, the number of threads in the micro-benchmark equals to the number of virtual CPUs in the VM and each thread will access an equal portion of the array and increases the local counter by one for each access. The total number of memory accesses by all threads in a specific amount of profiling time for this micro-benchmark () will provide us the insight into the memory contention and its impacts on performance experienced by user applications in the target VM.
Disk I/Os: For I/O performance of the target VM, we design the disk micro-benchmark that reads 256MB data from the VM’s disk with the page size of 4KB, and by each disk access the local counter value will be incremented. During the execution of this micro-benchmark, the OS file cache should be disabled to all file operations access the disk. Four threads are use for this micro-benchmark to fully exercises the disk without causing too much internal I/O contention. Again, the total number of disk access operations within a specific profiling time for this micro-benchmark () is use to assess the contention level of the VM’s disk operations.
These micro-benchmarks will be invoked sequentially right before the execution of a user’s application to get the in-situ resource contention for the respective resources.
3.2. The Length of Profiling Executions
Although it is desirable to reduce profiling overhead, short executions of the micro-benchmarks may not be able to completely capture the actual severity of resource contention. For majority of the experiments conducted in this paper, we executed each micro-benchmarks for 3 seconds to ensure the actual severity of contention was properly captured. In Section 5.5, we conducted a sensitivity test on how the length of profiling affects uPredict’s accuracy. The sensitivity test shows that 3 seconds indeed can provide accurate profiling results, while lower profiling length may also suffice.
4. User-Level Predictive Framework
In this section, we first present an overview of uPredict: a user-level profiler-based predictive framework. Then, based on regression and neural-network techniques, several predictive models are discussed that have different complexities and capabilities.
4.1. Overview of uPredict
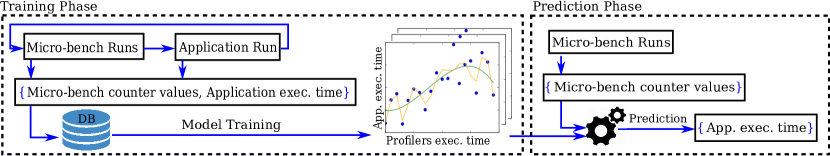
Figure 1 shows the overview of uPredict and illustrates the workflow of performance modeling and prediction for an application running on a VM in a multi-tenant cloud. There are two major phases in uPredict: the training and prediction phases. The first step in the training phase is to collect the training performance data. Here, in each iteration, the three micro-benchmarks are executed first for a fixed amount of time and their access counter values being denoted as to assess the in-situ contentiousness of CPUs, memory and disks of a VM, respectively. Then, the target application is executed right after the micro-benchmarks with its execution time being denoted as . The access counter values of micro-benchmarks and execution times of the application will form a data tuple , which represents the implicit relationship between the application’s performance and the profiled resource contention by the micro-benchmarks.
A set of training data tuples needs to be collected by repeating the above process for the target application and VM, where the resource contention from other VMs and applications on the same host machine can vary. The data tuples can then be used to train various application and VM specific performance predictive models based on different regression and neural network techniques, as discussed next. The number of data tuples in the training set can affect the accuracy of the derived models and the trade-offs are evaluated in Section 5. The second phase of performance prediction utilizing the derived predictive models is detailed in Section 4.3.
4.2. Predictive Models in uPredict
The key step in the training phase is to learn the relationship between the application execution time and the resource contention represented by the micro-benchmarks’ access counter values from the collected data tuples and derive a predictive model. That is, the parameters of the function in Equation (1) need to be learned.
| (1) |
where the exact form of the function and its parameters depend on the specific regression or machine-learning technique being used.
In other words, we use the micro-benchmark access counter values as the features to predict the execution time of the target application. Intuitively, the access counter values of micro-benchmarks are the indicators of contention severity of different resources, which are in turn used to predict the execution time of the application as shown in Section 4.3. Note that, the execution time of an application may also depend on its input data. In this work, we assume that an application’s execution time is affected only by the resource contention from other collocated VMs and their applications on the same host machine, where the input data for the application in each execution has the same or similar size. It has been shown that many recurring cloud applications are indeed repeatedly executed with similar workloads (Alipourfard et al., 2017; Agarwal et al., 2012; Ferguson et al., 2012). Moreover, the developed predictive models can be easily extended to consider an application’s input data, especially when such data size has a known (e.g., linear) relation with the application’s execution time.
Moreover, as applications have different behaviors and sensitivities to resource contention when running in a given VM, a single predictive model may not perform well for all applications. Therefore, application and VM specific predictive models will be derived for each application running on the considered VM. In what follows, the details of several regression and neural network based modeling techniques and their training processes are presented, which generally have different complexities (thus overheads) and prediction accuracies as shown in Section 5.
4.2.1. Polynomial-Regression based Models
We first considered polynomial-regression based predictive models, which usually take a short amount of time to train and predict. Consequently, if polynomial models can provide good prediction accuracy for an application running in a VM, there is no need to employ other more expensive and heavy-headed machine-learning models. To ensure that polynomial-regression models are thoroughly evaluated, we explored four regression (model training) techniques, which are Elastic Net Regularization (Zou and Hastie, 2005), Lasso Regression (Tibshirani, 1996), Ridge Regression (Hoerl and Kennard, 1970), and Stochastic Gradient Descent (SGD) (Zhang, 2004). The exact parameters for training these models can be found in Section 5. Additionally, experiments have been conducted with linear regression and 3-degree polynomial regression. However, for the considered benchmark applications, they perform inferior comparing to 2-degree polynomial models. Therefore, we only report the results of 2-degree polynomial predictive models in this paper.
4.2.2. Support Vector Regression (SVR) based Models
We also considered Support Vector Regression (SVR) based models (Gunn et al., 1998), which may potentially provide higher accuracy than polynomial models but with larger training and prediction cost. SVR is based on the popular machine-learning classifier, Support Vector Machine (SVM), with the introduction of an alternative loss function (in our case, the popular epsilon-insensitive function) (Smola and Schölkopf, 1998). The main benefit of SVR is that it allows us to build more complex and non-linear models within reasonable amount time, as an application’s behaviors running in the clouds may not always be expressible with polynomial or linear equations of resource contention (Gunn et al., 1998).
For SVR, the function has the format as shown in Equation (2), where represents the profiled execution times from the micro-benchmarks (i.e., is the tuple ). The in Equation (2) represents the micro-benchmark execution time tuple from a training sample. The training process will determine the actual values of all ’s and the with a predefined kernel function .
| (2) |
We employed the SVR implementation from Scikit-Learn (Scikit-learn, [n. d.]) with the default Gaussian kernel, which can be expressed as,
| (3) |
The value of is also automatically determined by the Scikit-Learn implementation by default.
4.2.3. Neural Network (NN) based Predictive Models
In addtion to SVR, we also considered Neural Network (NN) based models (Hecht-Nielsen, 1992; Specht, 1991). In uPredict, NN models are configured to conduct regression analysis. These models are more generic than SVM and can approximate nearly any function, potentially allowing uPredict to model any behaviors of an application running in a VM with higher training costs (Hornik et al., 1989; Bishop, 1995). However, we have observed that the accuracy of NN models can be significantly affected by their structures, that is, the number of layers and the number of neurons in each layer. Even when the same set of training data is used, the worst NN structure can have the prediction error to be more than 10 times higher than the best one. Therefore, training NN models with good accuracy is not simply just feeding the training data into a model, it also involves optimizing the structures of the NN models. Moreover, the best NN model structure also varies for different applications and VMs, implying that uPredict methodology needs to individually optimize the model structure for each pair of application and VM. This optimization process should be automated so that ordinary cloud users, who do not have expertise in machine learning, can apply uPredict to a new application and/or VM.
To automatically optimize NN structures, we employed hyperparameter optimization techniques, including Tree-structured Parzen Estimator (TPE) approach and Bayesian Optimization (Snoek et al., 2012; Bergstra et al., 2011). Hyperparameters refer to the NN parameters defining the number of layers and the number of neurons in each layer of a NN model. Both optimization techniques conduct a search in the optimization search space of the NN models to find a structure with good accuracy. This search space defines the maximum number of layers and neurons per layer that can be used when training NN models. The TPE technique explores the search space using a tree structure following the accuracy distribution obtained from previously sampled points in the search space. The Bayesian Optimization searches for the high-accuracy NN structures through the Gaussian Process (GP), which is a non-linear regression technique. Bayesian optimization uses GP to build a regression model with the already explored NN structures and their accuracies. The regression model is then used to predict a potentially better NN structure until a fixed number of NN structures are searched.
Clearly, the accuracy of the NN models in uPredict depends on the definition of the search space. It is commonly recommended that the number of neurons per layer is typically “no more than 1/30 of the number of training cases” (Sarle, [n. d.]). As our training sets only contain up to 1,000 data samples for each benchmark application in the given VMs, we set the maximum neurons per layer to be 35 in uPredict. As neural networks with two hidden layers (four total layers) can be fully general, we define the maximum number of layers of uPredict’s NN models to be 5 (Sontag, 1992). The extra layer is added to accommodate the cases where the maximum number of neurons defined above is not large enough. In summary, uPredict employs a NN structure search space of maximum 5 fully-connected layers and maximum 35 neurons per layer. The final optimized NN models for different applications may not have the same number of layers and neurons at each layer.
Note that, in uPredict, the hyperparameter optimization for NN models is applied on the training data sets themselves instead of separate cross-validation data sets. Theoretically, training and optimizing on the same data set may lead to over-fitting and thus low prediction accuracy. However, our experiment results show that using the same data set for optimizing the NN models can still provide high accuracy for predicting the performance of the considered benchmark applications and VMs on the multi-tenant clouds.
4.3. Performance Prediction in uPredict
In the prediction phase, before running an application, the micro-benchmarks are first executed sequentially to profile the contentiousness of a VM’s CPUs, memory and disks in the current execution environment, respectively. Their access counter values, , and , are then fed into a trained model for the application to predict its execution time. Here, the profiled resource contention by the micro-benchmarks is used to estimate the contention to be experienced by the application.
For the benchmark applications used in our evaluations, they typically take less than one hour to execute and our observation shows that the resource contention is less likely to change significantly within such a short period of time, especially on the public clouds. However, when an application does experience a change in resource contention during its execution, the prediction accuracy of the derived models can be negatively affected with much higher prediction errors as shown in the evaluation results (see Section 5).
For long running applications, they will be more likely to experience changes in resource contention during their executions and a periodically re-profiling technique may be deployed to catch such changes. However, exploring such a periodic re-profiling option would require significant modifications to the model building and prediction process (to consider, for instance, re-profiling intervals), which is well beyond the scope of this paper and will be investigated in our future work.
5. Validation and Evaluations
The proposed uPredict with the aforementioned predictive models have been evaluated extensively using the representative benchmarks from several benchmark suites on different clouds. Here, we first present the experiment setups and explain the data collection process. Then, the validation of uPredict on a private cloud with controlled reource contention is discussed. By considering both a private cloud and two public clouds that represent different severity of resource contention, the prediction accuracies (i.e., errors) of the predictive models are evaluated. Lastly, we present a use case of uPredict in a smart load-balancing scheme on two cloud servers.
5.1. Experiment Setups
Representative Benchmark Applications: A total of 17 benchmarks from PARSEC (Bienia, 2011), NAS Parallel Benchmarks (NPB) (Bailey, 2011) and CloudSuite (Ferdman et al., 2012) have been considered in our evaluations. Eight of them are from PARSEC, including streamcluster, blackscholes, bodytrack, canneal, facesim, ferret, swaptions and dedup. For these PARSEC benchmarks, their native inputs were used in the experiments. Five are chosen from NPB, which are ua, lu, sp, ep and bt, and they used the class C data inputs. The other four are from CloudSuite, including In-Memory Analytic, Graph Analytic, Web Search and Data Serving. Here, the large data inputs were used for In-Memory Analytic, while Graph analytics, Web Search and Data Serving benchmarks used the default data inputs.
These 17 benchmarks are representative and cover a wide range of applications running in various clouds. In each benchmark suite, the selection of these benchmarks is a combination of technical difficulties (e.g., compilation problems), benchmarks’ resource requirements (needs of multiple VM instances or more memory) and budget limitation to run the costly experiments on AWS and GCE clouds. For all the 17 selected benchmarks, sixteen worker threads were created in their executions.
Clouds and VM Configurations: First, for the private cloud, we utilize an Ubuntu 16.04 server with two Intel Xeon E5-2630 processors (for a total of 16 cores) and 128GB memory that has OpenStack Ocata installed. Given that the selected benchmarks include parallel and data/graph analytic applications, we created a VM of 16 VCPUs and 16GB memory on OpenStack to execute these benchmarks. Moreover, to introduce resource contention into the private cloud, up to seven (7) background VMs (with the same VCPU and memory configuration as the target VM) were randomly created at runtime, which executed either CPU- or memory-intensive synthetic applications from iBench (Delimitrou and Kozyrakis, 2013a). The background VMs and their applications change after each fixed interval (e.g., 2 hours).
For public clouds, we considered both AWS EC2 and Google Cloud Engine (GCE). In AWS EC2, we used a single VM of type m5d.4xlarge to execute the selected benchmarks. Here, m5d.4xlarge is the latest general purpose VM instance with 16 CPUs and 64GB memory (Amazon Web Services, [n. d.]). The VM is configured to use an 80GB standard EBS SSD drive. We used non-dedicated VM instances so that background VMs and their applications were managed by AWS and were unknown to us. For GCE, we used a single VM of type n1-standard-16 to execute the selected benchmarks, where n1-standard-16 is the standard VM instance with 16 VCPUs and 60GB of memory (Google Compute Engine, [n. d.]). The VM is also configured with an 80GB SSD drive. Again, the background VMs and their applications were managed by GCE and were unknown to us. Both the selected VM types in the public clouds closely match CPUs and memory of the VM in our private cloud. For all the experiments on the three clouds, we used Ubuntu Server 16.04 as the OS for the created VMs.
Here, the private cloud was empolyed with two objectives: First, to validate the correctness of uPredict with controlled resource contention from the background VMs and applications; Second, to evaluate the prediction accuracy of the studied predictive models in uPredict under scenarios with extremely high resource contention, which were usually not seen in the experiments on public clouds. On the other hand, the experiments on the VMs in AWS EC2 and GCE were designed to evaluate the effectiveness of uPredict and its predictive models. We would like to evaluate whether they can indeed predict the performance of cloud applications with high accuracy from the perspective of ordinary cloud users on commercial public clouds with unknown colocated VMs and workloads.
Data Collection: As illustrated in Figure 1, a key step in the training phase of uPredict is to collect experimental data regarding to the execution times of the benchmark applications and those for the micro-benchmarks. From Section 3, the three micro-benchmarks are invoked sequentially right before the execution of a user’s application to get the in-situ resource contention, which has the total profiling overhead of roughly 9 seconds in each iteration. For the private cloud, with up to seven (7) background VMs and associated applications, we have run the 17 benchmark applications individually with the micro-benchmarks for a total of roughly 70 days. For each benchmark application, more than 1,000 data points have been collected and the first 1,000 were used in the evaluations.
For the PARSEC benchmarks that have relatively short execution times, we have executed them for about 10 days on both AWS and GCE to collect more than 1,000 data points in each cloud setting. Again, the first 1,000 were used in the evaluations. For the benchmarks in NPB and CloudSuite that take more time for executions, we run them for about 20 days on both AWS and GCE, where 777 and 688 data points have been collected for each of these benchmark applications on the two clouds, respectively, and all these data points were used in the evaluations.
For each benchmark application, 80% of the collected data points are utilized as training data to derive its regression and neural network based predictive models. The remaining 20% data points are used as testing data to evaluate the prediction accuracies (i.e., errors) of the derived predictive models. Here, instead of designating a fixed portion of 80% data points as the training data that may not reflect the same severity of resource contention experienced by the benchmark applications for the other 20%, we adopted a sampling technique to select the training data points. Specifically, for every 5 consecutive data points that are more likely to encounter similar resource contention, the first 4 of them are chosen as the training data, while the last data point is used as the testing data.
Implementation and Training of the Predictive Models: We used the scikit-learn version 0.19.2 library (Scikit-learn, [n. d.]) to implement the four different 2-degree polynomial regression models and the SVR model. In particular, for the ElasticNet and Lasso algorithms, we used an alpha of 1 as a constant and a tolerance value of 0.001 for optimization. For the Ridge algorithm, we used the same tolerance value and an alpha value of 1 as regulation strength. For the SGD algorithm, we used the following settings: squared loss, penalty L2, alpha value of 0.0001, L1 ratio of 0.15, epsilon as 0.1 and eta as 0.01. For the SVR model, we used RBF (Gaussian) kernel with a value of 1000. For all the aforementioned algorithms, we set the maximum number of iterations to 10,000. These models are denoted as 2-D poly: ElasticNet, 2-D poly: Lasso, 2-D poly: Ridge, SGD and SVR in the result figures, respectively.
The NN-based models are implemented using TensorFlow version r1.12 (Abadi et al., 2015). We considered both a fixed NN structure and the automatically optimized NN structures for each benchmark application as described in Section 4.2.3, to demonstrate the importance of hyperparameter optimization for NN models. Here, the fixed structure had 5 fully-connected layers and 35 neurons per layer, which are the same the largest NN structure of the hyperparameter optimization search space as defined in Section 4.2.3. This largest NN structure is chosen with the assumption that a more complex NN model would be expected to provide better prediction accuracy.
For hyperparameter optimizaton, we employed two libraries, HyperOpt version 0.1.1 (HyperOpt, [n. d.]) (for TPE optimization) and Scikit-optimize version 0.5.2 (Scikit-Optimize, [n. d.]) (for Bayesian Optimization). Both of the hyperparameter optimization libraries have been set to 200 iterations for finding the high-accuracy parameters. Our evaluations show that, increasing the number of iterations up to 1,000 will not significantly improve the prediction accuracy (less than 2 percent) for the resulting NN models. However, with the optimization time has a linear relation with the number of iterations, the training time can increase by up to 5 times for 1,000 iterations. The resulting NN models are denoted as NN:HyperOpt and NN: SkOpt, respectively.
5.2. Validation of uPredict
Based on the executions of two PARSEC benchmarks (Streamcluster and Cannel, which have higher prediction errors as shown later) on our private cloud, we first validated the effectiveness of uPredict. Here, Figure 2 shows the measured (actual) execution times (the blue star points in the top figures) for the two benchmarks as well as the corresponding number of background VMs and their applications (in the bottom figures) for the duration of 24 hours. Clearly, the execution times of the benchmarks can vary drastically (more than 10 times) due to variations in the severity of resource contention caused by the background VMs and their applications on the same host machine. Therefore, it is imperative to develop user-level framework and tools for ordinary cloud users to get reasonably accurate performance prediction for their applications and to support their cost effective planning and operations.
| inMem | graph | web | data | ua | lu | sp | ep | bt | sc | blackscholes | bodytrack | canneal | facesim | ferret | swaptions | dedup | |
| 2D: ElasticNet | 6.7 | 24.7 | 9.8 | 10.6 | 16.6 | 36.4 | 18.6 | 4.5 | 9.6 | 54.9 | 8.8 | 22.6 | 42.3 | 23.6 | 14.9 | 13.8 | 27.2 |
| 2D: Lasso | 6.7 | 24.7 | 9.9 | 10.6 | 16.6 | 36.4 | 18.6 | 4.5 | 9.6 | 54.9 | 8.8 | 22.6 | 42.3 | 23.6 | 14.9 | 13.6 | 27.2 |
| 2D: Ridge | 6.7 | 24.6 | 9.8 | 10.7 | 21.5 | 35.5 | 18.6 | 4.5 | 9.7 | 54.8 | 8.8 | 22.5 | 42.3 | 23.6 | 14.9 | 12.0 | 27.2 |
| 2D: SGD | 6.6 | 25.2 | 9.8 | 10.6 | 16.8 | 36.1 | 18.7 | 4.5 | 9.6 | 55.1 | 8.7 | 22.8 | 42.4 | 23.6 | 16.6 | 13.7 | 27.1 |
| SVR | 17.9 | 29.2 | 9.6 | 10.6 | 18.4 | 27.8 | 14.9 | 4.6 | 12.8 | 28.0 | 12.5 | 10.2 | 62.1 | 28.6 | 24.0 | 14.7 | 26.3 |
| NN: HyperOpt | 6.0 | 17.9 | 10.3 | 10.1 | 15.7 | 17.7 | 16.0 | 4.5 | 9.2 | 49.8 | 8.7 | 7.0 | 23.6 | 23.5 | 11.8 | 9.1 | 25.6 |
| NN: SkOpt | 5.9 | 47.5 | 10.3 | 10.0 | 15.5 | 17.7 | 17.0 | 4.5 | 9.2 | 60.4 | 8.9 | 7.0 | 18.2 | 21.6 | 11.5 | 9.0 | 28.1 |
We can see from the figures that the execution times for Streamcluster and Cannel can be as low as around 90 and 30 seconds, respectively, at the beginning of each 2-hour interval. This is due to the fact that, when the number of background VMs changes at each 2-hour interval, the executions of the interfering applications in all background VMs stop for the first 5 minutes, during which the level of resource contention is rather low.
The predicted execution times (the red x points) utilizing the derived SVR models for the two benchmarks are also shown in the top two figures, respectively. Here, it is hard (if not impossible) to associate a predicted execution time of the benchmarks with its corresponding measured one in the figures. Although the predicted execution times have several outliers for both benchmarks due to the limitations of the predictive model, especially during the transition period of changing background VMs and applications, it can be clearly seen that the pattern (or trend) of the predicted execution times closely follows that of the measured ones. Such patterns match the severity of resource contention due to the background VMs and their applications as shown in the bottom figures. Therefore, we can also say that this experiment validates our hypothesis on the devised micro-benchmarks, which can properly assess the resource contention in the target VM at runtime.
5.3. Evaluation of uPredict in a Private Cloud
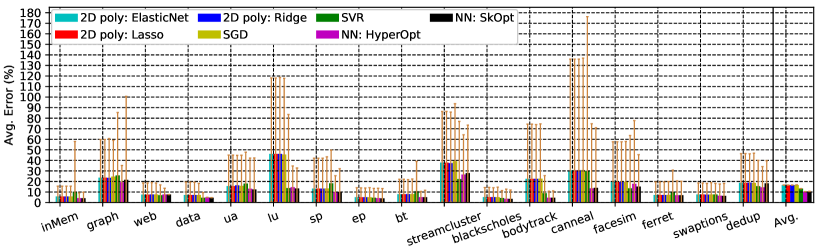
For the private cloud where the resource contention is rather high with the controlled background VMs and applications, Figure 3 shows the the prediction errors of the considered seven predictive models in uPredict for all the 17 benchmark applications. Here, the solid bars indicate the average and the associated vertical lines show the 95-percentile of the prediction errors. As explained earlier, for each benchmark, 80% of the data points were utilized to train/derive its application/VM-specific predictive models while the remaining 20% were used to test their prediction accuracies.
First, for average prediction errors, the two NN-based predictive models with hyper-parameters optimizations (i.e., NN:HyperOpt and NN:SkOpt) perform the best for almost all benchmark applications with lower than 20% errors (except streamcluster has 28% error). Moreover, the overall average prediction errors by considering all 17 benchmark applications were only 9.8% for the NN-based models. This indicates that the proposed uPredict with NN-based models can indeed provide quite accurate performance predictions for applications in a multi-tenant cloud environment even with high resource contention (where our private cloud has up to 7 background VMs). However, without hyperparameter optimizations, the fixed structure (i.e., 5 layers and 35 neurons per layer) NN models can perform rather worse with the overall average prediction errors being 60% (and up to 154% prediction errors for some benchmark applications), which is not shown in the figure.
For comparison, all four polynomial-regression based predictive models perform relatively worse with the overall prediction errors for all benchmarks being around 17%, which is about 8% higher that those of the NN-based models. One possible reason for the worse performance of the polynomial regression models compared to that of the NN-based models is that, for certain applications, the relationships between the profiling results from the micro-benchmarks and the actual execution times of the applications are not necessarily polynomial. Neural networks, on the other hand, have shown great potential in finding relationships that are neither linear nor polynomial (Zhang et al., 2001). For SVR models, while they performed relatively better than the polynomial regression models for most benchmark applications, their overall prediction accuracy is still behind the NN-based models. The results indicated that SVR models might be able to find non-polynomial relationships, however, they are not as powerful as the NN-based models for predicting the performance of cloud applications in clouds with high resource contention.
On the other hand, the prediction errors of the predictive models are application dependent and vary in quite a large range. For several applications (such as web, data, ep, blackscholes and swaptions), their 95-percentile prediction errors can be lower than 20% for all the considered predictive models. However, for other memory-intensive applications (such as lu, streamcluster and canneal), their 95-percentile prediction errors can be more than 90% for the polynomial regression predictive models. In particular, for canneal, its 95-percentile prediction error for the SVR model can be as high as 178%. Such high prediction errors for the outliers may have several causes. First, it can come from the limitations of the predictive models and the micro-benchmarks that can only profile a subset of factors that affect the performance of cloud applications. We suspect that the relatively-high errors were caused by the mismatch between the memory access patterns of the micro-benchmarks and aforementioned benchmarks. They may also be caused by the fact that the memory micro-benchmark is mainly profiling off-chip memory contention, which does not include cache access patterns.
Moreover, detailed analysis into the results shows that most of the large errors were from predicted points when there were changes in the background VMs and applications. During these changes, the micro-benchmark can profile the resource contentiousness of the startup or shutdown of background VMs. The benchmarks, however, were later executed along with iBench applications, which have different resource contentiousness. Consequently, the predicted results using the profiled resource contention during VMs startups and shutdowns were relatively inaccurate. Third, benchmark applications can have different sensitivities to the contention of various underlying hardware resources, which make some be more difficult to predict their performance accurately than the others.
Table 1 further shows the standard deviation of the prediction errors for the predictive models and benchmark applications. In general, the standard deviations for all the cases are comparable to the average prediction errors, especially for the applications that have larger error ranges (i.e., higher 95-percentile), such as lu, streamcluster (sc) and canneal. Such standard deviations indicate that it is difficult to obtain accurate and stable predicted execution times for the applications running in the cloud environment with high resource contention. However, we would like to point out that, detailed analysis shows that 75% of the predicted results have errors no more than 10% higher than the average prediction errors.
Effects of Training Data: For the two representative benchmarks, streamcluster and canneal, Figure 4 show their average prediction errors for the predictive models when different amount of training data (up to 80%) is utilized. It can be see that, the four polynomial models can achieve almost the same prediction performance for both applications with only 20% of training data being utilized. On the other hand, for the SVR and NN models, having more training data can generally improve their accuracies with reduced prediction errors (especially for the case of SVR and canneal). The results for other applications are similar, which are not shown due to space limitation. Therefore, when the training data is limited, it may be more beneficial to exploit the polynomial models instead of the complex NN models.
5.4. Evaluation of uPredict in Public Clouds
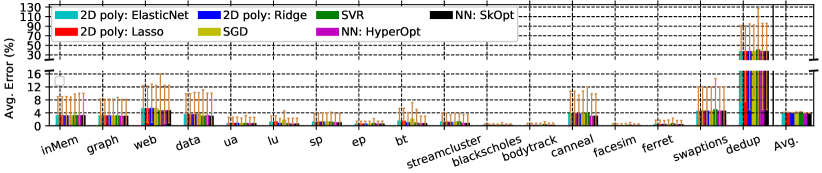
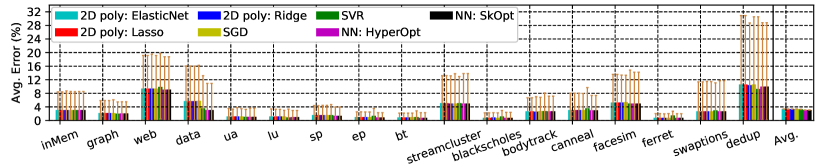
Figure 5 shows the average and 95-percentile prediction errors of the studied predictive models for the benchmarks on the two public clouds, Amazon AWS and Google GCE, respectively. Here, Figure 5a first gives the results on AWS, where all predictive models have the average prediction errors less than 7% and 95-percentile less than 14% for all benchmarks except dedup. Moreover, except for dedup, the average prediction errors of all the predictive models for all the benchmarks differ by at most 3%, which suggests that the predictive models have almost equivalent accuracy on AWS. The lower prediction errors in AWS than the private cloud are mainly due to the relatively low resource contention. The execution times of the benchmarks on AWS can fluctuate up to 25%, compared to up to 10 times fluctuation in the private cloud.
These results show that the proposed profiler-based framework with any considered predictive model can predict most single-VM benchmarks quite accurately on AWS. Hence, uPredict is feasible for ordinary AWS users to obtain accurate performance prediction without the need of the exact knowledge or control of the underlying execution environments. Although the NN-based models can provide slightly higher prediction accuracy, it takes much more time to train compared to that of polynomial regression based models, especially with the hyperparameter optimizations.
The large prediction error with dedup was caused by OS thread scheduling issue rather than the models mispredicting the impact of resource contention. We observed that dedup has two execution times on AWS, which are either about 5 seconds or about 11 seconds. Such an execution pattern is usually caused by issues other than contention (if it is caused by contention, then the execution times would be spread between these two times). Further analysis revealed that dedup created about 30 to 40 threads even when specified to use only 16 worker threads. These many threads prevented the OS from providing a stable scheduling behavior on the 16-core VM, resulting in two groups of execution times. When we reduced the worker thread count to below (which in turn reduced the total thread count), the thread scheduling was more stable, and the proposed methodology could achieve an average error less than 10% for all models. However, for consistency, the 16-worker-thread results were used in the figures.
Figure 5b further shows the results on GCE. Here, the average and 95-percentile prediction errors from all predictive models for all benchmark applications are no more than 10% and 38%. In fact, except for dedup, the 95-percentile prediction errors for all other benchmarks are less than 20%. The overall average prediction errors for all the benchmarks are less than 4% for all the studied predictive models. These results show that the proposed predictive framework is highly accurate on GCE for the considered benchmark applications as well. Combining with the findings from AWS, these results further confirm that it is feasible for ordinary cloud users to utilize uPredict to get accurate performance prediction on public clouds without the need of the exact knowledge or control of the underlying execution environments.
Moreover, similar to the results on AWS, the average prediction errors from all predictive models for the benchmarks differ by at most 2%, suggesting that these predictive models have almost equivalent performance in terms of prediction accuracy on GCE. Also, the same as in AWS results, the figure shows that the polynomial regression and SVR models are comparable to neural network models in terms of prediction accuracy, although on average the NN models provide slightly higher accuracy.

5.5. Sensitivity to Profiling Execution Length
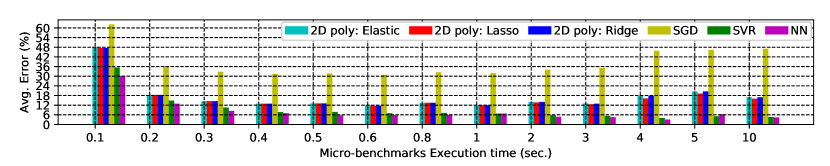
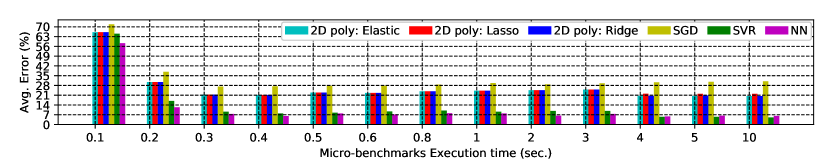
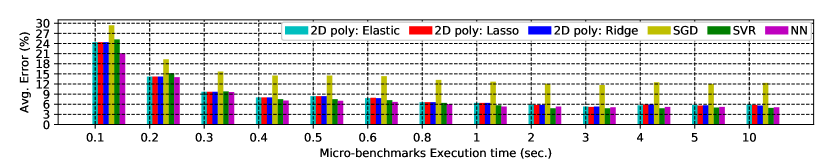
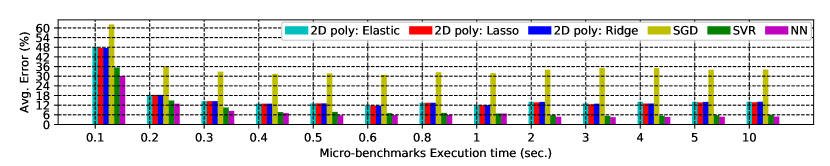
As stated in Section 3.2, the lengths of the profiling executions are important parameters for uPredict, as uPredict relies on the micro-benchmarks to provide accurate measurement of current severity of contention. Although we have been using 3-seconds of profiling executions, a smaller profiling length may already provide good knowledge on the level of contention. To evaluate the impact of profiling length on prediction accuracy, we conducted an sensitivity experiment using 5 representative applications on our private cloud.
In this sensitivity experiment, micro-benchmarks were executed with different execution time of 0.1 sec to 10 seconds before the execution of target application. Each of the five applications were executed for 800 iterations along with the micro-benchmarks. Except for the profiling length, the experiment setup was the same as discussed in Section 5.3. As described in the uPredict methodology, the application’s execution times and micor-benchmark performance were collected during this experiement. After the execution, 80% of the 800 iterations’ data (i.e., 640 data points) were used to build the uPredict prediction models using the performance results of the micro-benchmarks with different profiling lengths. These models were then tested on the rest 20% (i.e., 160) data points.
Fig. 6 shows the accuracy of these prediction models for all 5 representative benchmarks using different prediction algorithms and profiling execution lengths. As Fig. 6 shows, after profiling length of 0.4 seconds, the accuracy improvement from longer profiling runs were limited, whereas after three seconds, there was nearly accuracy improvements. These results suggested that a profiling length of 0.4 seconds may be long enough to obtain good accuracy, while there is generally no need to profiling for more than 3 seconds.
5.6. Case Study: Load-Balancing with uPredict
To illustrate the usage of uPredict, we have conducted a case study of load-balancing for two cloud servers. Here, each cloud server is a VM with the same configuration as the one in previous experiments (i.e., 16 VCPUs and 64 GB memory) and both run under OpenStack on two separate host machines. Each machine has two Intel Xeon E5-2630 processors (for a total of 16 cores) and 128GB memory. In addition to the VM acting as one cloud server, up to three (3) background VMs may be created randomly to run applications from iBench on each host machines. These background VMs/applications change at different fixed intervals on the machines.
We assume that a user-level load-balancer is adopted to direct the requests of cloud users to run the benchmark Graphics Analytic of CloudSuite to one of the two cloud servers at runtime. Three different load-balancing schemes were investigated in this study. First, the dummy load-balancer just distributes the received user requests alternatively to the two cloud servers one after the other without any information from the cloud servers being considered. Second, a simple queue-based load-balancer considers the number of requests in the waiting queues of both cloud servers and distributes a new user request to the server with a shorter waiting queue. Finally, the uPredict-based smart load-balancer considers the predicted execution times for the requests in the waiting queues based on the current profiled resource contention from the micro-benchmarks on both cloud servers. A new user request would be distributed to the server where the request is expected to complete earlier.
The first experiment was conducted for 3 days, where the user requests were periodically sent to the load-balancer starting with 12 requests per hour. The rate of incoming user requests gradually increases to 24 requests per hour and then decreases to 12 requests per hour in the end, where the request rate changes after every 4 hours for a duration of 3 days (i.e., 72 hours). With the resource contention from the background VMs/applications, the execution times for Graphics Analytic have the range from 45 seconds to about 7 mintues. The above request rate is rather high (denoted as high-load) especially at the peak rate of 24 requests per hour.
| balancers | turnaround time (s) | execution time (s) |
|---|---|---|
| dummy-alternate | 3563 | 312 |
| queue-based | 987 | 276 |
| uPredict-based | 1066 | 256 |
Table 2 shows the average turnaround and execution times for the generated requests of running Graphic Analytic under different load-balancers. Clearly, without considering resource contention and workload (i.e., queue length) on the cloud servers, the dummy-alternate scheme can result in very high turnarond time, which is more than 3 times of those for the queue-based and uPredict-based schemes. Although the queue-based scheme does not consider the resource contention, the queue length actually implies the delivered performance on each server. Hence, the average turnaround times for the queue-based and uPredict-based schemes are quite close.
For the average execution time of the requests, by avoiding the cloud server with high resource contention (implied by its queue length), the queue-based scheme can improve it for about 11.5% over dummy-alternate. Given that the uPredict-based scheme tries to execute most requests on the server that can deliver higher performance with less resource contention, its average execution time can be improved by 18% compared to that of dummy-alternate.
In the second 3-day experiment, we reduced the request rate by half through the duration (denoted as low-load), and the results are shown in Table 3. In this case, as the waiting queues on both cloud servers are empty for most of the time, the queue-based scheme performs relatively worse, where both of its average turnaround and execution times of the requests are around 12% better than those of the dummy-alternate scheme. By exploiting the resource contention on the cloud servers, the uPredict-based scheme can further improve 19% and 10% over the queue-based scheme for the average execution and turnaround times of the requests, respectively. Note that, the profiling overheads of running the micro-benchmarks in the uPredict-based scheme were already included in the resulting turnaround times of the generated requests.
| balancers | turnaround time (s) | execution time (s) |
|---|---|---|
| dummy-alternate | 360 | 339 |
| queue-based | 318 | 300 |
| uPredict-based | 287 | 242 |
6. Discussions and Future Work
Micro-Benchmarks: One of the factors affecting the accuracy of the proposed methodology is that our memory micro-benchmark only profiles the contention of off-chip memory resources and has a single memory access pattern. To improve accuracy, we will investigate micro-benchmarks with smaller working sets to profile cache contentions as well as other memory access patterns in the future. Moreover, we will study micro-benchmarks to profile the contention of network resources so that the proposed methodology can be extended to network-intensive applications.
Data-Input: The goal of this research is to investigate the feasibility of predicting cloud application’s performance under resource contention from the ordinary cloud users’ perspective. Hence, we intentionally used the same data inputs for the considered benchmarks to eliminate the impact from input variations, so that the main cause of performance fluctuation is resource contention. The evaluation can thus be focused on the proposed methodology’s accuracy to predict the impacts of resource contention. In our future work, we will extend the proposed methodology to include predictions under input data variations. Nonetheless, it is worth noting that many cloud applications, such as certain machine-learning and data parallel applications, may be repeatedly executed with similar workloads (Agarwal et al., 2012; Ferguson et al., 2012; Alipourfard et al., 2017). Therefore, the methodology presented in this paper should already work well for these applications.
Long Running Applications: The evaluation results show that the predictive models do not work well for long execution times (outliers) that were not seen in the training data. We plan to incorporate extreme value theory with Neural Network to improve the prediction accuracy for these unusual cases (Rudd et al., 2018). Moreover, for long running applications, they are more likely to experience changes in resource contention during their executions. We will consider adaptive predictive models by exploiting periodic profiling techniques in our future work.
7. Conclusions
The resource contention in multi-tenant cloud environment can cause performance fluctuations for cloud applications. Without accurate knowledge of their performance, it is very difficult for ordinary cloud users to plan their resource allocations on the clouds. In this paper, we proposed uPredict, a user-level profiler-based performance predictive framework for single-VM applications running in multi-tenant clouds. First, from the perspective of ordinary cloud users, uPredict adopts three specially devised micro-benchmarks to assess the contention of CPUs, memory and disks, respectively, in a VM. Then, predictive models based on regression and neural network (NN) techniques are developed. The proposed uPredict and the considered predictive models were evaluated extensively with representative benchmarks from PARSEC, NAS Parallel Benchmarks and CloudSuite, on one private cloud server and two public clouds (Amazon AWS and Google GCE). Our evaluation results show that, even on the private cloud that has quite high resource contention, the average prediction errors are between 9.8% to 17% for different predictive models. Here, the NN-based models with hyper-parameters optimization perform better (about 9% reduction in prediction errors) than the regression-based models but with much higher training overheads. For public clouds that normally have much less contention stable, the average prediction errors of the considered benchmarks are below 4%. A use case of uPredict in load-balancing shows that, the execution and turnaround times of the considered application can be effectively reduced by up to 19% and 10%, respectively, compared to the simple queue-based load-balancing scheme.
References
- (1)
- Abadi et al. (2015) Martín Abadi, Ashish Agarwal, Paul Barham, Eugene Brevdo, Zhifeng Chen, Craig Citro, Greg S. Corrado, Andy Davis, Jeffrey Dean, Matthieu Devin, Sanjay Ghemawat, Ian Goodfellow, Andrew Harp, Geoffrey Irving, Michael Isard, Yangqing Jia, Rafal Jozefowicz, Lukasz Kaiser, Manjunath Kudlur, Josh Levenberg, Dandelion Mané, Rajat Monga, Sherry Moore, Derek Murray, Chris Olah, Mike Schuster, Jonathon Shlens, Benoit Steiner, Ilya Sutskever, Kunal Talwar, Paul Tucker, Vincent Vanhoucke, Vijay Vasudevan, Fernanda Viégas, Oriol Vinyals, Pete Warden, Martin Wattenberg, Martin Wicke, Yuan Yu, and Xiaoqiang Zheng. 2015. TensorFlow: Large-Scale Machine Learning on Heterogeneous Systems. https://www.tensorflow.org/ Software available from tensorflow.org.
- Agarwal et al. (2012) Sameer Agarwal, Srikanth Kandula, Nico Bruno, Ming-Chuan Wu, Ion Stoica, and Jingren Zhou. 2012. Reoptimizing Data Parallel Computing. In USENIX Symposium on Networked Systems Design and Implementation.
- Alipourfard et al. (2017) Omid Alipourfard, Hongqiang Harry Liu, Jianshu Chen, Shivaram Venkataraman, Minlan Yu, and Ming Zhang. 2017. CherryPick: Adaptively Unearthing the Best Cloud Configurations for Big Data Analytics. In USENIX Symp. on Networked Systems Design and Implementation. 469–482.
- Amazon Web Services ([n. d.]) Amazon Web Services. https://aws.amazon.com/ec2/.
- Bailey (2011) David H Bailey. 2011. Nas parallel benchmarks. In Encyclopedia of Parallel Computing. Springer, 1254–1259.
- Ballani et al. (2011) Hitesh Ballani, Thomas Karagiannis, Ant Rowstron, and Paolo Costa. 2011. Towards Predictable Datacenter Networks. In The ACM SIGCOMM Conference on Data Communication (SIGCOMM’11).
- Baughman et al. (2018) M. Baughman, R. Chard, L. Ward, J. Pitt, K. Chard, and I. Foster. 2018. Profiling and Predicting Application Performance on the Cloud. In Int’l Conf. on Utility and Cloud Computing.
- Begam et al. (2018) Rehana Begam, Hamidreza Moradi, Wei Wang, and Dakai Zhu. 2018. Flexible VM Provisioning for Time-Sensitive Applications with Multiple Execution Options. In Proc. of the IEEE Int’l Conference on Cloud Computing (CLOUD).
- Bergstra et al. (2011) James Bergstra, Rémi Bardenet, Yoshua Bengio, and Balázs Kégl. 2011. Algorithms for Hyper-parameter Optimization. In Proc. of Int’l Conf. on Neural Information Processing Systems. 2546–2554.
- Bienia (2011) Christian Bienia. 2011. Benchmarking Modern Multiprocessors. Ph.D. Dissertation. Princeton University.
- Bishop (1995) Christopher M Bishop. 1995. Neural networks for pattern recognition. Oxford university press.
- Clemente-Castello et al. (2018) F. J. Clemente-Castello, B. Nicolae, R. Mayo, and J. C. Fernandez. 2018. Performance Model of MapReduce Iterative Applications for Hybrid Cloud Bursting. IEEE Transactions on Parallel and Distributed Systems (2018).
- Dejun et al. (2011) Jiang Dejun, Guillaume Pierre, and Chi-Hung Chi. 2011. Resource provisioning of web applications in heterogeneous clouds. In Proceedings of the 2nd USENIX conference on Web Application Development. USENIX Association.
- Delimitrou and Kozyrakis (2013a) C. Delimitrou and C. Kozyrakis. 2013a. iBench: Quantifying interference for datacenter applications. In IEEE International Symposium on Workload Characterization (IISWC).
- Delimitrou and Kozyrakis (2013b) Christina Delimitrou and Christos Kozyrakis. 2013b. Paragon: QoS-aware Scheduling for Heterogeneous Datacenters. In Proceedings of International Conference on Architectural Support for Programming Languages and Operating Systems (ASPLOS).
- Delimitrou and Kozyrakis (2014) Christina Delimitrou and Christos Kozyrakis. 2014. Quasar: Resource-efficient and QoS-aware Cluster Management. In Proc of Int’l Conf. on Architectural Support for Programming Languages and Operating Systems.
- Farley et al. (2012) Benjamin Farley, Ari Juels, Venkatanathan Varadarajan, Thomas Ristenpart, Kevin D. Bowers, and Michael M. Swift. 2012. More for Your Money: Exploiting Performance Heterogeneity in Public Clouds. In Proceedings of the Third ACM Symposium on Cloud Computing.
- Ferdman et al. (2012) Michael Ferdman, Almutaz Adileh, Onur Kocberber, Stavros Volos, Mohammad Alisafaee, Djordje Jevdjic, Cansu Kaynak, Adrian Daniel Popescu, Anastasia Ailamaki, and Babak Falsafi. 2012. Clearing the Clouds: A Study of Emerging Scale-out Workloads on Modern Hardware. Proceedings of the Seventeenth International Conference on Architectural Support for Programming Languages and Operating Systems (2012).
- Ferguson et al. (2012) Andrew D. Ferguson, Peter Bodik, Srikanth Kandula, Eric Boutin, and Rodrigo Fonseca. 2012. Jockey: Guaranteed Job Latency in Data Parallel Clusters. In Proc. of ACM European Conf. on Computer Systems.
- Friese et al. (2017) R. D. Friese, N. R. Tallent, A. Vishnu, D. J. Kerbyson, and A. Hoisie. 2017. Generating Performance Models for Irregular Applications. In Int’l Parallel and Distributed Processing Symposium.
- Google Compute Engine ([n. d.]) Google Compute Engine. https://cloud.google.com/.
- Govindan et al. (2011) Sriram Govindan, Jie Liu, Aman Kansal, and Anand Sivasubramaniam. 2011. Cuanta: Quantifying Effects of Shared On-chip Resource Interference for Consolidated Virtual Machines. In Proc. of ACM Symposium on Cloud Computing.
- Gunn et al. (1998) Steve R Gunn et al. 1998. Support vector machines for classification and regression. University of Southampton technical report 14, 1 (1998), 5–16.
- Hecht-Nielsen (1992) Robert Hecht-Nielsen. 1992. Theory of the backpropagation neural network. In Neural Networks for Perception. Elsevier, 65–93.
- Hoerl and Kennard (1970) Arthur E Hoerl and Robert W Kennard. 1970. Ridge regression: applications to nonorthogonal problems. Technometrics 12, 1 (1970), 69–82.
- Hornik et al. (1989) Kurt Hornik, Maxwell Stinchcombe, and Halbert White. 1989. Multilayer Feedforward Networks are Universal Approximators. Neural Networks 2, 5 (1989), 359 – 366.
- Hwang et al. (2016) K. Hwang, X. Bai, Y. Shi, M. Li, W. Chen, and Y. Wu. 2016. Cloud Performance Modeling with Benchmark Evaluation of Elastic Scaling Strategies. IEEE Transactions on Parallel and Distributed Systems 1 (2016), 130–143.
- HyperOpt ([n. d.]) HyperOpt. https://github.com/hyperopt/hyperopt.
- Intel VTune Amplifier ([n. d.]) Intel VTune Amplifier. https://software.intel.com/en-us/vtune/features/hpc-cloud.
- Iosup et al. (2011) A. Iosup, S. Ostermann, M. N. Yigitbasi, R. Prodan, T. Fahringer, and D. Epema. 2011. Performance Analysis of Cloud Computing Services for Many-Tasks Scientific Computing. IEEE Transactions on Parallel and Distributed Systems 6 (2011), 931–945.
- Iosup et al. (2011) A. Iosup, N. Yigitbasi, and D. Epema. 2011. On the Performance Variability of Production Cloud Services. In 2011 11th IEEE/ACM International Symposium on Cluster, Cloud and Grid Computing.
- Leitner and Cito (2016) Philipp Leitner and Jürgen Cito. 2016. Patterns in the Chaos&Mdash;A Study of Performance Variation and Predictability in Public IaaS Clouds. ACM Transactions on Internet Technology (TOIT) 16, 3 (2016).
- Li et al. (2017) H. Li, Y. Wu, Y. Chen, C. Wang, and Y. Huang. 2017. Application Execution Time Prediction for Effective CPU Provisioning in Virtualization Environment. IEEE Transactions on Parallel and Distributed Systems 11 (2017), 3074–3088.
- LMbench ([n. d.]) LMbench. http://www.bitmover.com/lmbench/.
- Malawski et al. (2012) Maciej Malawski, Gideon Juve, Ewa Deelman, and Jarek Nabrzyski. 2012. Cost- and Deadline-constrained Provisioning for Scientific Workflow Ensembles in IaaS Clouds. In Proceedings of the International Conference on High Performance Computing, Networking, Storage and Analysis.
- Mao and Humphrey (2011) Ming Mao and Marty Humphrey. 2011. Auto-scaling to Minimize Cost and Meet Application Deadlines in Cloud Workflows. In Proc. of Int’l Conf. for High Performance Computing, Networking, Storage and Analysis.
- Mariani et al. (2017) G. Mariani, A. Anghel, R. Jongerius, and G. Dittmann. 2017. Predicting Cloud Performance for HPC Applications: A User-Oriented Approach. In Int’l Symp. on Cluster, Cloud and Grid Computing.
- Maricq et al. (2018) Aleksander Maricq, Dmitry Duplyakin, Ivo Jimenez, Carlos Maltzahn, Ryan Stutsman, and Robert Ricci. 2018. Taming Performance Variability. In 13th USENIX Symposium on Operating Systems Design and Implementation (OSDI 18).
- Mars et al. (2011) Jason Mars, Lingjia Tang, Robert Hundt, Kevin Skadron, and Mary Lou Soffa. 2011. Bubble-Up: Increasing Utilization in Modern Warehouse Scale Computers via Sensible Co-locations. In Proceedings of Annual IEEE/ACM International Symposium on Microarchitecture.
- Mishra et al. (2017) N. Mishra, J. D. Lafferty, and H. Hoffmann. 2017. ESP: A Machine Learning Approach to Predicting Application Interference. In IEEE International Conference on Autonomic Computing (ICAC).
- Nathuji et al. (2010) Ripal Nathuji, Aman Kansal, and Alireza Ghaffarkhah. 2010. Q-clouds: Managing Performance Interference Effects for QoS-aware Clouds. In Proceedings of ACM European Conference on Computer Systems.
- Novaković et al. (2013) Dejan Novaković, Nedeljko Vasić, Stanko Novaković, Dejan Kostić, and Ricardo Bianchini. 2013. DeepDive: Transparently Identifying and Managing Performance Interference in Virtualized Environments. In USENIX Annual Technical Conference (USENIX ATC).
- Ostermann et al. (2010) Simon Ostermann, Alexandria Iosup, Nezih Yigitbasi, Radu Prodan, Thomas Fahringer, and Dick Epema. 2010. A Performance Analysis of EC2 Cloud Computing Services for Scientific Computing. In Cloud Computing. Springer Berlin Heidelberg.
- Ou et al. (2013) Z. Ou, H. Zhuang, A. Lukyanenko, J. K. Nurminen, P. Hui, V. Mazalov, and A. Yla-Jaaski. 2013. Is the Same Instance Type Created Equal? Exploiting Heterogeneity of Public Clouds. IEEE Transactions on Cloud Computing 2 (2013), 201–214.
- RightScale (2018) RightScale. 2018. State of the Cloud Report.
- Romero and Delimitrou (2018) Francisco Romero and Christina Delimitrou. 2018. Mage: Online and Interference-Aware Scheduling for Multi-Scale Heterogeneous Systems. In Proceedings of International Conference on Parallel Architectures and Compilation Techniques (PACT).
- Rudd et al. (2018) Ethan M Rudd, Lalit P Jain, Walter J Scheirer, and Terrance E Boult. 2018. The Extreme Value Machine. IEEE Transactions on Pattern Analysis and Machine Intelligence 40, 3 (2018), 762–768.
- Sarle ([n. d.]) Warren S. Sarle. Neural Network FAQ. ftp://ftp.sas.com/pub/neural/FAQ.html.
- Schad et al. (2010) Jörg Schad, Jens Dittrich, and Jorge-Arnulfo Quiané-Ruiz. 2010. Runtime Measurements in the Cloud: Observing, Analyzing, and Reducing Variance. Proceedings of VLDB Endowment 1-2 (2010), 460–471.
- Scheuner and Leitner (2018) J. Scheuner and P. Leitner. 2018. Estimating Cloud Application Performance Based on Micro-Benchmark Profiling. In IEEE International Conference on Cloud Computing.
- Scikit-learn ([n. d.]) Scikit-learn. http://scikit-learn.org/stable/.
- Scikit-Optimize ([n. d.]) Scikit-Optimize. https://github.com/scikit-optimize.
- Smola and Schölkopf (1998) A. J. Smola and B. Schölkopf. 1998. On a Kernel-Based Method for Pattern Recognition, Regression, Approximation, and Operator Inversion. Algorithmica 22, 1 (01 Sep 1998), 211–231.
- Snoek et al. (2012) Jasper Snoek, Hugo Larochelle, and Ryan P Adams. 2012. Practical Bayesian Optimization of Machine Learning Algorithms. In Advances in Neural Information Processing Systems 25, F. Pereira, C. J. C. Burges, L. Bottou, and K. Q. Weinberger (Eds.). Curran Associates, Inc., 2951–2959.
- Sontag (1992) E. D. Sontag. 1992. Feedback Stabilization using Two-hidden-layer Nets. IEEE Transactions on Neural Networks 3, 6 (Nov 1992), 981–990.
- Specht (1991) D. F. Specht. 1991. A General Regression Neural Network. IEEE Transactions on Neural Networks 2, 6 (1991), 568–576.
- Tang et al. (2013) Lingjia Tang, Jason Mars, Wei Wang, Tanima Dey, and Mary Lou Soffa. 2013. ReQoS: Reactive Static/Dynamic Compilation for QoS in Warehouse Scale Computers. In Proceedings of International Conference on Architectural Support for Programming Languages and Operating Systems.
- Tibshirani (1996) Robert Tibshirani. 1996. Regression shrinkage and selection via the lasso. Journal of the Royal Statistical Society. Series B (Methodological) (1996), 267–288.
- Venkataraman et al. (2016) Shivaram Venkataraman, Zongheng Yang, Michael Franklin, Benjamin Recht, and Ion Stoica. 2016. Ernest: Efficient Performance Prediction for Large-Scale Advanced Analytics. In USENIX Symposium on Networked Systems Design and Implementation (NSDI).
- Wolf et al. (2016) Felix Wolf, Christian Bischof, Alexandru Calotoiu, Torsten Hoefler, Christian Iwainsky, Grzegorz Kwasniewski, Bernd Mohr, Sergei Shudler, Alexandre Strube, Andreas Vogel, and Gabriel Wittum. 2016. Automatic Performance Modeling of HPC Applications. In Software for Exascale Computing - SPPEXA 2013-2015.
- Wyatt et al. (2018) Michael R. Wyatt, II, Stephen Herbein, Todd Gamblin, Adam Moody, Dong H. Ahn, and Michela Taufer. 2018. PRIONN: Predicting Runtime and IO Using Neural Networks. In Proc. of Int’l Conf. on Parallel Processing.
- Yadwadkar et al. (2017) Neeraja J. Yadwadkar, Bharath Hariharan, Joseph E. Gonzalez, Burton Smith, and Randy H. Katz. 2017. Selecting the Best VM Across Multiple Public Clouds: A Data-driven Performance Modeling Approach. In Proceedings of ACM Symposium on Cloud Computing (SoCC).
- Yang et al. (2013) Hailong Yang, Alex Breslow, Jason Mars, and Lingjia Tang. 2013. Bubble-flux: Precise Online QoS Management for Increased Utilization in Warehouse Scale Computers. In Proc. of Int’l Symp on Computer Architecture.
- Zhai et al. (2016) J. Zhai, W. Chen, W. Zheng, and K. Li. 2016. Performance Prediction for Large-Scale Parallel Applications Using Representative Replay. IEEE Trans. Comput. (2016).
- Zhang et al. (2001) G Peter Zhang, B Eddy Patuwo, and Michael Y Hu. 2001. A Simulation Study of Artificial Neural Networks for Nonlinear Time-series Forecasting. Computers & Operations Research 28, 4 (2001), 381–396.
- Zhang (2004) Tong Zhang. 2004. Solving Large Scale Linear Prediction Problems Using Stochastic Gradient Descent Algorithms. In Proceedings of International Conference on Machine Learning.
- Zou and Hastie (2005) Hui Zou and Trevor Hastie. 2005. Regularization and variable selection via the elastic net. Journal of the Royal Statistical Society: Series B (Statistical Methodology) 67, 2 (2005), 301–320.