A Flaring AGN In a ULIRG candidate in Stripe 82
Abstract
We report the discovery of a mid-infrared variable AGN which is hosted by an ultraluminous infrared galaxy (ULIRG) candidate in the Sloan Stripe 82 field. WISE J030654.88+010833.6 is a red, extended galaxy, which we estimate to be at a photometric redshift of 0.28 z 0.31, based on its optical and near-infrared spectral energy distribution (SED). The factor of two variability over 8 years seen in the WISE 3.4 and 4.6 m wavelength channels is not clearly correlated with optical variability in archival data. Based on our estimation of the physical parameters of the host galaxy, J030654.88+010833.6 is possibly a composite AGN/starburst ULIRG in a phase where high star formation 70 M⊙ year-1 is occurring. Our estimate of the black hole mass to stellar mass ratio also appears to be consistent with that of broad line AGN in the local universe. The long-term variability of J030654.88+010833.6 as seen in the WISE W1 and W2 light curves is likely due to variations in the accretion rate, with the energy being reprocessed by dust in the vicinity of the AGN.
1 Introduction
An active galactic nucleus (AGN) is powered by the accretion of matter onto a supermassive black hole (SMBH). Hence their occurrence rates trace the formation and growth of SMBH over cosmic time (Peterson, 1997). AGN can exhibit flux variation on timescales ranging from minutes to years over the entire electromagnetic spectrum (Fitch et al., 1967). The underlying physics of the variability is not clearly understood. It is suggested that on short timescales, disk instabilities play a significant role (Kawaguchi et al., 1998), while on longer timescales, the fueling of gas into the nuclear regions and regulation through feedback processes dominate (e.g Hopkins et al., 2012).
AGN represent an evolutionary phase for many galaxies and AGN feedback is expected to have a significant impact on the star formation of the host galaxy. The ultraviolet (UV) - optical part of the Spectral Energy Distribution (SED) of an AGN is dominated by emission from the inner accretion disk (e.g. Shakura & Sunyaev, 1973). The dusty region at larger distances from the accretion disk, often referred as the ‘dusty torus’ absorbs the light of the accretion disk and re-emits it in the near- and mid-infrared (IR), dominating the SED at wavelengths longer than 1.0 m. The variability of an AGN not only places size limits on the accretion disk but also traces gas inflows and outflows around the AGN (Shields, 1978). Obscuration by gas and dust during the early stages of black hole growth, in the early stages of a merger, can suppress the UV-optical continuum of AGN, until AGN feedback becomes strong enough to clear out the gas from the central regions of the galaxy (Hopkins et al., 2005). For a better understanding of the AGN astrophysics, a combination of observations in the time-domain and across multiple wavelengths is necessary.
Ultra-Luminous InfraRed Galaxies (ULIRG) are classically defined as galaxies with . In the local universe, these are thought to be driven by mergers between gas-rich galaxies, where the interaction triggers dust-enveloped starburst and AGN activity (Gao & Solomon, 2004). One of the promising ways to disentangle the source of power (AGN vs. starburst) is using the mid-IR (MIR) and far-IR (FIR) color diagnostic (e.g. Kirkpatrick et al., 2013). The MIR emission from an obscured AGN appears to be dominated by hot dust emission which exceeds the photospheric emission from low-mass and evolved stars as well as the hot dust and PAH emission from star-forming regions.
In this paper, we focus on a MIR variable AGN J030654.88+010833.6 (hereafter, WISE-J0301) discovered in WISE data in the Sloan Stripe 82 field. The extreme MIR variability found in the WISE 3.4 and 4.6 m bands is associated with smaller variability in the reddest optical bands. It has a bright optical, MIR, radio, X-ray and a faint ultraviolet source associated with it. SED fitting to the UV-near IR (NIR) photometry results in a photometric redshift of 0.28 z 0.31.
Using the template SED of Mrk231 (Sanders et al., 1988) to fit the MIR photometry, we identify the WISE-J0301 host galaxy as a ULIRG. MIR variable AGN are extremely rare. To put it in context, Assef et al. (2018) find 162 MIR variable AGN, with detection by FIRST at 1.4GHz (over 10,000 deg2), out of a WISE catalog of 4.5 million AGN candidates. WISE-J0301 is one of the few objects of this type (MIR variability with radio detection showing no optical variability) found in the past and provides a rare opportunity to put important constraints on the growth of SMBHs and their connection to galaxy evolution at late cosmic times.
This paper is organized as follows. Section 2 describes the source selection and multi-wavelength photometry of WISE-J0301, ranging from UV to radio from different broadband photometric surveys. Section 3 summarizes the process leading to optical and infrared light curves. Using these light curves we demonstrate variability in the infrared brightness and in the 3.4 to 4.6 m spectral index. Section 4 presents the best fit SED based on observed photometry in order to derive the physical parameters of the host galaxy. We present our interpretation in Section 5 and conclude with the results in Section 6.
2 Source selection and its multi-wavelength properties
In the course of a multi-wavelength search for MIR variable AGN in the 270 deg2 Sloan Digital Sky Survey (SDSS) Stripe 82 field, we selected potential AGN candidates using the WISE all-sky catalog and the color selection criterion outlined in Stern et al. (2012). The WISE W1 and W2 bands are centered at 3.4 and 4.6 m, respectively. mag (Vega) identifies 51 AGN candidates per square degree to a depth of W2 = 15.0 mag (Vega). We then construct the light curves for each AGN candidate using WISE single exposure images which is explained in detail in Section 3.
WISE-J0301 stands out among 300 AGN, whose light curves were visually inspected, with what appears to be an extreme MIR variability of 0.6 magnitudes which roughly corresponds to a flux density ratio of 1.7. The variability is seen over a time frame of 8 years (with a gap of 3.5 years after the WISE all-sky survey) and is correlated in both W1 and W2 filters of WISE. In addition, we find four other MIR variable AGN, with a variability of 0.4 magnitudes
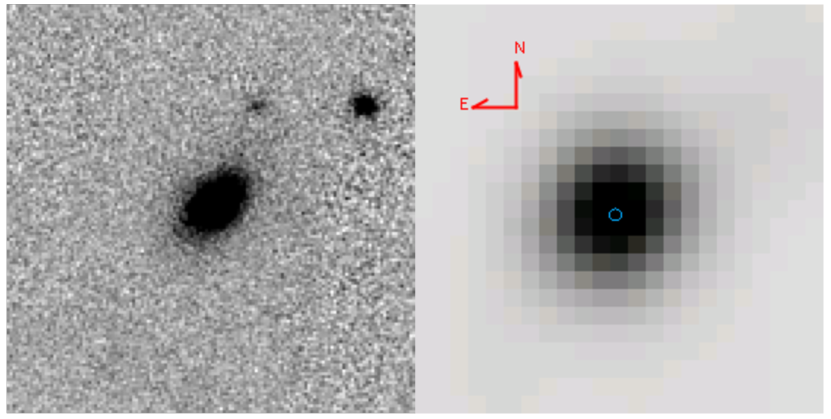
WISE-J0301 has an (RA, Dec) of (46.728676, 1.142683) and has high signal to noise detections across different surveys ranging from UV wavelengths to radio wavelengths. SDSS DR14 (Abolfathi et al., 2018) and Pan-STARRS photometry (Chambers et al., 2016a) for WISE-J0301 are broadly consistent with each other (see Table 1). WISE-J0301 appears to be a red extended galaxy in these imaging datasets (Figure 1). We also obtain UV photometry from the GALEX point source catalog provided by Martin et al. (2005). Infrared photometry is obtained from WISE All-Sky Release (Wright et al., 2010) and 2MASS point source catalog (Skrutskie et al., 2006) search service provided by the Infrared Science Archive (IRSA)111http://irsa.ipac.caltech.edu/. WISE-J0301 also has a radio detection in NVSS 1.4GHz band (Condon et al., 1998). These photometric measurements are summarized in Table 1 below.
In order to understand better the nature of the MIR variability, we also obtain multi-epoch optical photometry from the Catalina Real-Time Transient Survey (CRTS, Drake et al. 2009), and PanSTARRS surveys (Chambers et al., 2016b).
| Filter Name | MagAB/Flux(mJy) | |
|---|---|---|
| GALEX FUV | 0.15 | 22.870.34 |
| GALEX NUV | 0.23 | 23.400.50 |
| SDSS uModel | 0.36 | 21.270.18 |
| SDSS gModel | 0.47 | 19.390.02 |
| SDSS rModel | 0.62 | 18.050.01 |
| SDSS iModel | 0.75 | 17.530.01 |
| SDSS zModel | 0.88 | 17.200.01 |
| PanSTARRS gKron | 0.47 | 19.450.02 |
| PanSTARRS rKron | 0.62 | 18.330.01 |
| PanSTARRS iKron | 0.75 | 17.780.01 |
| PanSTARRS zKron | 0.88 | 17.590.02 |
| PanSTARRS yKron | 0.96 | 17.400.02 |
| 2MASS J | 1.23 | 17.250.11 |
| 2MASS H | 1.66 | 16.950.09 |
| 2MASS Ks | 2.16 | 16.330.06 |
| WISE W1 | 3.4 | 15.920.02 |
| WISE W2 | 4.6 | 15.360.02 |
| WISE W3 | 12.0 | 14.360.04 |
| WISE W4 | 22.0 | 12.560.11 |
| Spitzer IRAC ch-1 | 3.6 | 15.480.002 |
| Spitzer IRAC ch-2 | 4.5 | 15.170.001 |
| NVSS 1.4GHz | 2.14 | 14.650.08 / 5.00.04 |
3 Variability in the infrared and optical light
3.1 MIR variability
The infrared light curves in WISE W1 and W2 bands, are generated for each AGN candidate by applying standard aperture photometry on publicly available WISE single exposure (Level 1b) images acquired from IRSA image service222http://irsa.ipac.caltech.edu/applications/wise/. The Single-exposure WISE images contain a large and diverse quantity of image artifacts. To overcome these, we restrict ourself to good quality images and apply the following quality control criteria as suggested by the WISE team333http://wise2.ipac.caltech.edu/docs/release/allsky/expsup/sec2_4b.html:
| (1) | |||
| SAA_SEP > 0, and | (2) | ||
| (3) |
Equation 1 is a good overall quality score. This parameter is available in the Single-exposure (level 1b) Frame Metadata table and can assume the values of 0, 5, and 10. The images with are poor-quality frames and not considered science worthy. These images may be affected by a combination of artifacts, included but not limited to, high pixel noise, high background, and degraded image quality due to spacecraft jitter. Equation 2 ensures that the images were taken when the
spacecraft was well outside the nominal boundaries of South Atlantic Anomaly and Equation 3 selects images that are not affected by the worst of moonlight contamination. Almost 25-30 of images which fail to meet the standards stated above are excluded from our analysis.
Each WISE single exposure image is accompanied by a corresponding bit-wise encoded mask image. We use the bitwise value assigned to each pixel in an image to mask out bad pixels. A bad pixel can be affected by one or more systematic artifacts like, saturation, dead pixel, high dark current amongst others. However, we ensure that there are no bad pixels within the photometry extraction aperture.
More detail on this can be found in the WISE data product explanatory supplement.444{http://wise2.ipac.caltech.edu/docs/release/allsky/expsup/sec4_4a.html#maskdef} We apply a circular aperture with radius fixed at 6 arc-seconds at AGN positions to estimate flux densities. To estimate the sky background and photometric uncertainty, we use a circular annulus around the source position with radii 3-3.5 times the aperture radius. A sigma clipped median provides a robust estimate for background levels while accounting for potential contamination of the background value by unrelated sources. An aperture radius of 6, which is the spatial resolution (full width at half maximum) in WISE W1 and W2 channels, helps us avoid contamination from nearby sources. However, this results in a loss of estimated flux for which we apply aperture correction using standard stars.
The aperture corrections are derived by comparing
our aperture fluxes with the source catalog W1MPRO fluxes for a large number of stars (50). We estimate aperture corrections of 0.26 and 0.31 mags in WISE W1 and W2 channels, respectively. Our estimates for aperture corrections are consistent with similar estimates made by WISE team.555{http://wise2.ipac.caltech.edu/docs/release/allsky/expsup/sec4_4c.html#circ} Although aperture corrections are slightly sensitive to the source spectral index across the bandpass, with sources having redder spectra having larger corrections, this correction is small and therefore ignored. Also, even though the source is extended in the ground-based optical data, it is only marginally resolved at WISE resolution and so the
aperture corrections for a 6 radius aperture derived through the reference stars should be reasonably accurate.
We use Photutils (Bradley et al., 2018) package distributed with Astropy (Astropy Collaboration et al., 2013) python module for employing aperture photometry.
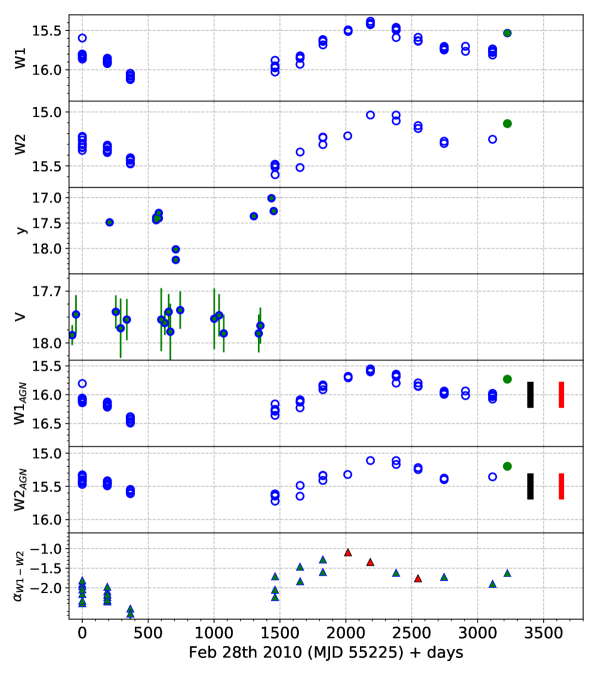
We present the light curves for WISE-J0301 generated from WISE W1 and W2 single exposure images in the top two panels of Figure 2. WISE magnitudes are normally expressed in the Vega system. Here, we have converted the magnitudes to the AB system.666W1AB = W1MPRO(Vega) + 2.699, W2AB = W2MPRO(Vega) + 3.339 For generating these light curves, we have combined data from all different periods of WISE observations including NEOWISE (Mainzer et al., 2011). The 3.5 years of gap in WISE light curves around MJD 55725 come from the period after the all-sky survey when the telescope was in hibernation. We see a clear evidence of variability of 0.6 - 0.7 magnitudes which are correlated in both the MIR channels of WISE. Using the SED modeling described in the next section, we estimate the contributions to the photometry from the stars within the host galaxy in WISE W1 and W2 filters to be 370 and 260 Jy, respectively. Subtracting these flux densities from the light curves enables us to analyze the variability of only the AGN. The photometric uncertainties in single epoch magnitudes are 0.03 mag.
The last data point in each of the panels in Figure 2 (except panel 3 [and 4]) is from the first epoch of our observations of WISE-J0301 using Spitzer IRAC channel 1 2 (corresponding to 3.6 and 4.5m). We employ aperture photometry on Spitzer post-BCD (basic calibrated data) science level images using the same procedure applied on WISE images. We use an aperture of radius 6 arc-seconds to estimate flux densities and a sigma clipped median in the circular annulus to estimate the background flux. We then apply an aperture correction of 1.047, corresponding to the aperture radius, on the fluxes obtained from aperture photometry-we have similar caveats for this aperture correction as noted above for WISE data. We estimate the spectral index () using the fluxes in Spitzer IRAC ch-1 2. This spectral index is used to determine the color corrections that need to be applied to the Spitzer IRAC fluxes. Having derived the aperture and color-corrected final flux densities in Spitzer IRAC ch-1 2, we re-estimate the spectral index. This spectral index in combination with Spitzer flux densities is used to estimate the flux densities in WISE W1 and W2 channels using the power-law in equation 5. Details on aperture corrections and color-corrections applied here are explained in the Spitzer IRAC instrument handbook.777{https://irsa.ipac.caltech.edu/data/SPITZER/docs/irac/iracinstrumenthandbook/}
The bottom panel of the Figure 2 shows the W1-W2 spectral index as a function of time using a simple power law:
| (4) | |||||
| (5) |
For spectral index, we only use the data on WISE W1 and W2 which have the same observation date. We see the variability in the spectral index between . A steep negative spectral index typically indicates synchrotron radiation although a significant contribution from hot dust and/or the redshifted 3.3m polycyclic aromatic hydrocarbon feature into the WISE 4.5m bandpass cannot be ruled out (Draine & Li, 2007). For example, we estimate using the Draine & Li (2007) models that the hot dust continuum can have an while the 3.3m PAH can result in an . Thus, varying the ratio of hot dust to PAH can account for the range of alpha that we observe.
3.2 Optical variability
Once we had identified WISE-J0301 in the MIR light curves, we investigated this variability further using the optical light curve taken from publicly available data of CRTS (Drake et al., 2009) shown in the fourth panel of Figure 2. CRTS data is taken in an unfiltered optical light which is later calibrated to a Johnson V-band ( 0.55 m) zero-point. CRTS has 340 observations on WISE-J0301 with a baseline of 8 years between September 14, 2005 to Oct 26, 2013.888{https://heasarc.gsfc.nasa.gov/cgi-bin/Tools/xTime/xTime.pl} Here, we group the data together in similar time-bins as the WISE data and use the median value to provide better visibility of the trend. The gaps in the optical light curve are inherent in the CRTS data and not a consequence of grouping the data. We do not see any clear evidence of variability in the optical light curve. However, a variability of 0.3 mag or less would be hard to detect due to the sensitivity and larger photometric uncertainties of CRTS.
A comparison between the time-averaged SDSS and PanSTARRS photometry in Table 1 shows very significant variability in the redder optical bands, even after accounting for differences in how the photometry is performed. Specifically, we see variability of 0.39 mags in , 0.25 mags in , 0.28 mags in , which is smaller than what we see in the WISE bands. PanSTARRS DR2 also provides 10 epochs of photometry between MJD 55433 and 57000 overlapping with the early part of the WISE light curve as shown in Figure 2. Those data show clear evidence of a factor of 3 variability with a minimum in the band flux density at about MJD of 56000. This mostly corresponds with the gap in the WISE light curve and therefore it is challenging to use this to estimate a time delay between the optical and mid-infrared variability. The absence of variability in the CRTS optical data is therefore because the spectral index of the emission is steep which results in most of the emission being in the redder bands. Thus, for this source at least, the CRTS data are insensitive to the variability.
The red colors of the source in the optical and strong MIR emission suggests that the light at longer wavelengths may be dominated by hot dust emission in the vicinity of the AGN. In canonical accretion disk models, the short wavelength emission arises from the hot accretion disk around the black hole which is then thermally reprocessed by dust at larger distances (e.g. Peterson, 1997). In this particular case, the spectral index of just the time-varying component of optical emission is rather steep; the spectral index of the time varying component of emission between the and bands is , steeper than but similar to that in the WISE bands. Furthermore, the absence of similarly strong variability in the shortest wavelength optical band (e.g. ) argues in favor of dust extinction internal to the host galaxy being responsible for suppressing that emission since extinction is a factor of 3 higher in the band than in the band. We also calculate that it is not possible for the entire optical through MIR emission to arise from an extincted accretion disk since it would require 30 mags of visual extinction, implying a much steeper optical slope than observed and a correction to the X-ray luminosity of a factor of 40, which appears inconsistent with the correction estimated in Section 5.4.
In the next section, we use the multi-wavelength photometry summarized in Table 1 to model the SED of the host galaxy and derive physical parameters.
4 SED Modeling: Deriving Physical Parameters
In order to understand the nature of the galaxy that is hosting such an AGN, we derive the properties of the stellar population using the high signal to noise photometry obtained from different surveys ranging from UV-radio wavelengths (Table 1) with an exception of FIR999We searched both the Akari and Herschel archives and did not find any detections in the former or data in the case of the latter..
We fit Flexible Stellar Population Synthesis (FSPS) models (Conroy et al., 2009) to the UV-NIR SED using the EAZY package (Brammer et al., 2008) to derive a redshift and physical properties of WISE-J0301. EAZY uses a linear combination of 12 galaxy templates derived from FSPS models. This method was originally implemented for a different set of templates within EAZY (Brammer et al., 2008) but has since been modified to use the FSPS templates.
While SED fitting, we exclude MIR photometry to avoid bands where the AGN and/or dust emission may be dominating. We estimate a photometric redshift (photo-z) with 9 bands of GALEX+SDSS+2MASS, and 10 bands of GALEX+SDSS u+Pan-STARRS+2MASS, separately, as shown in Table 2. Independent estimates of redshift using the Sloan and Pan-STARRS are slightly different from each other, with SDSS and with Pan-STARRS, although Pan-STARRS provides a better statistics. The differences between the two observations are mainly because optical photometry are taken at different time epochs and are variable. Moreover, the photo-z estimate with Pan-STARRS benefits from using more bands with an additional y-band and thus has smaller value.
In addition, since there is an evidence for AGN contributions in the red optical bands, we also fit the SED using 24 AGN and hybrid templates (AGN+host galaxy) of Salvato et al. (2009). The Pan-STARRS photometry is best fitted by the hybrid template (S0-70_QSO2-30) constructed using 70% S0 galaxy and 30% type 2 QSO and the derived photo-z is , identical to the one derived from the FSPS galaxy templates. The value however is worse with AGN templates (8.48 vs. 3.23) because of a lack of flexibility of the SED fitting using a limited number of templates. When fitting to the SDSS photometry with these templates, the fits prefer a different hybrid template (S0-10_QSO2-90) and results in with a significantly larger () value than Pan-STARRS, indicating a poor fit.
Even though the values using SDSS data are worse when using both galaxy and AGN templates, we cannot conclusively rule out different photo-z estimates obtained from SDSS and Pan-STARRS based on the fact that the multiwavelength data were all taken at different epochs and their magnitudes even at the same wavelengths are variable as shown in Table 1. However, since the photo-z derived from a hybrid template using SDSS is a large deviation from other estimates and with the poorest , we think it is reasonable to exclude this redshift estimate. We therefore conclude that the redshift of WISE-J0301 is . The results of SED fits are summarized in Table 2.
| GALEX + SDSS + 2MASS | GALEX + Pan-STARRS + 2MASS | |
|---|---|---|
| Template | ||
| Galaxy | 0.31 11.13 | 0.28 3.23 |
| AGN+Galaxy | 0.47 18.35 | 0.28 8.48 |
We note that our redshift estimate of is different from the photo-z, 0.215, obtained by SDSS using KD-tree machine learning method (Alam et al., 2015). Unlike SDSS which only used , our estimates also take into account the GALEX UV and 2MASS NIR photometry in addition to the optical photometry. It is well-known that the accuracy of photo-z depends on the quality of photometry and broad wavelength coverage with many photometric bands in observed galaxy SEDs (Dahlen et al., 2010). Thus, the photo-z estimate here would be more robust for our object with multi-wavelength photometry having high signal-to-noise ratios.
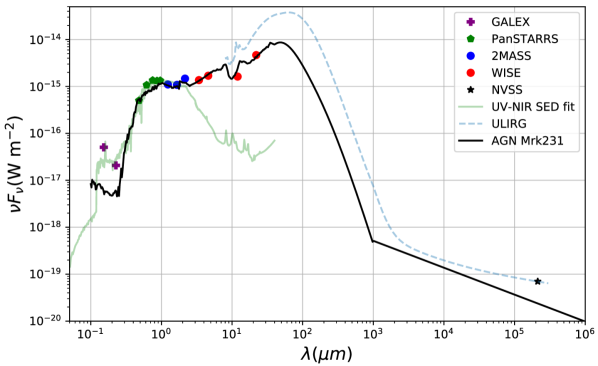
Since the data seems to suggest that WISE-J0301 is an obscured AGN, we fit the SED to a prototypical nearby obscured AGN, Mrk 231 (). At the best fit redshift of 0.28, the Mrk 231 template from Chary & Elbaz (2001) shows a good fit to the observed MIR photometry with a 5.5, after applying a scaling factor of 0.45. In Figure 3, we plot the results of SED fit to the best-fitted galaxy template (green) and Mrk0231 template (black) with over-plotted observed photometry from GALEX, PanSTARRS, 2MASS, WISE, and NVSS. The EAZY and Mrk 231 fits are used to estimate the physical parameters of the host galaxy which are tabulated in Table 3. We note that due to the variability in the optical photometry in the reddest bands, the derived parameters are uncertain at the 30% level. In Section 5, we discuss our interpretation of these results.
5 results and analysis
5.1 WISE-J0301 and Mrk231: Similarities and differences
It is important to point out the key similarities as well as the differences between WISE-J0301 and Mrk231. While the Mrk231 mid- and far-infrared SED can be scaled to fit the observed photometry of WISE-J0301 extremely well, our extracted WISE photometry of Mrk231 does not show long-term MIR variability like WISE-J0301 with a W1 and W2 brightness of 10.1 and 9.5 mags (AB), respectively. Mrk231 does show extreme variability at radio frequencies (Reynolds et al. 2013) with a range in 20 GHz flux densities of 75-275 mJy. We currently do not have any multi-epoch radio observations for WISE-J0301 to ascertain its radio variability. We however note that the radio to mid-infrared flux density ratio of WISE-J0301 is higher by a factor of 2.3 compared to Mrk231 as shown in Figure 3, suggesting an additional component of radio emission, likely from the AGN.
5.2 Optical-IR light curves
The evidence of MIR variability is clear in the WISE W1 and W2 light curves (Figure 2). A 0.9 magnitude peak to peak variation, roughly corresponding to a flux ratio of 2, is observed between MJD-55625 to MJD-57425. However, extrapolating the light curve trend in the empty region between MJD-55625 to MJD-56675, we expect WISE-J0301 to be faintest around MJD-56025, which is not dissimilar from the minimum in the band light curve. The MIR and optical variability combined with the radio luminosity of the source, which exceeds 1024 W Hz-1, is a definitive indicator of AGN activity at the center of WISE-J0301.
Rotating radio jet models have been successful in explaining the long-term variability (10 years) of extragalactic radio sources in Planck compact source catalog (Chen et al., 2013). We made an attempt to model the variability of WISE-J0301 using rotating radio-jet model. Although the radio-jet model fits the light curve data prior to MJD-58025 very well, the latest observations from NEOWISE and Spitzer are inconsistent with the model. Further multi-epoch observations from Spitzer will provide more clarity on the variability and origin of emission as shown in the Figure 2.
It appears more likely that the long-term variability of WISE-J0301 is simply due to variations in the accretion rate onto the black hole, a hypothesis which is a common scenario adopted for variable AGN (Peterson, 1997). Due to obscuration by dust in the host galaxy, possibly in the form of a torus, only the red, relatively unextincted wavelengths of this emission are detected. The dust in the torus absorbs the short-wavelength emission and re-emits it at mid- and far-infrared wavelengths. The hot dust, at temperatures of around 700 K is the component that is seen in the WISE bands. This scenario would show a lag in the light curves between the optical and mid-infrared bands depending on the light travel time from the AGN to the surrounding torus. Future observations with Spitzer and data releases from PanSTARRS will be able to measure this time delay and assess the validity of this hypothesis.
5.3 Spectral energy distribution
We have shown that the UV-NIR photometry of WISE-J0301, obtained from GALEX, PanSTARRS, and 2MASS, is well fit by stellar populations continuum model (solid green curve in Figure 3). This is used to place constraints on the stellar mass and star formation rate (SFR) of the galaxy We estimate the stellar mass and unobscured SFR from SED fits to be 1.9 1011 M⊙, and 0.71 M⊙ year-1, respectively.
We also have shown that a Mrk 231 template shows a reasonable fit to the overall SED of this source while noting that dusty starburst templates which have the standard radio-IR correlation (dashed line in Figure 3, e.g. Chary & Elbaz, 2001) violate the WISE 12 and 22 m photometry. This indicates that the brightness of WISE-J0301 in the radio radio is unlikely to be due to star formation and is dominated by AGN emission.
As mentioned below, a scaling factor of 0.45 is applied for the Mrk231 template to fit the MIR luminosity of WISE-J0301. This scaling provides us with an estimate of flux densities at FIR wavelengths for WISE-J0301 where we currently do not have any observations. We integrate the estimated IR flux from m to obtain an 9.0 1011 L⊙ L8-1000μm (LIR) 1.5 1012 L⊙ which suggest that the host galaxy is likely a ULIRG to within the uncertainties. More recent studies of Mrk231 and similar low redshift AGN/ULIRG (Veilleux et al., 2009; Weedman et al., 2005), estimate the AGN contribution to the bolometric luminosity to be 70-80%, consistent with the weakness of the PAH features in its mid-infrared SED. Assuming a 75% contribution from AGN and the remaining 25% from star formation, the SFR is estimated to be 70 M⊙/yr (100 times the SFR estimated from UV photometry). We examined the Infrared Astronomical Satellite (IRAS; Neugebauer et al. (1984)) data on WISE-J0301, using the SCANPI data service at IRSA, and found no detection in any of the 4 IRAS bands.101010https://irsa.ipac.caltech.edu/applications/Scanpi/ The baseline noise combined between 60 and 100 m implies a 1- on FIR flux of 7.23 10. This gives a 1- equivalent in SFR of 67 M which broadly is consistent with the SFR estimate from scaled Mrk231 template. Overall, these estimates lead us to conclude that WISE-J0301 is possibly a ULIRG with strong AGN activity and some star-formation in it.
It has long been believed that ULIRGs, at low redshifts, are driven by mergers between gas-rich galaxies, where the interaction triggers dust-enveloped starburst and AGN activity (Gao & Solomon, 2004). We do not see any obvious evidence of merger activity in the images obtained in PanSTARRS and WISE W1 bands (Figure 1). This suggests the possibility that the host galaxy is at a very late stage of merger hence showing a smooth extended shape at the resolution of the data.
5.4 Constraints on Black Hole Mass
We next constrain the mass of the BH at the center of WISE-J0301. Given the similarity between the SED of this object and Mrk 231, and the fact that the SED is dominated by AGN emission, one estimate comes from the direct scaling factor. The black hole at the center of AGN Mrk231 has an estimated mass of 2.3 108 (Leighly et al., 2014). As stated before, we estimate a scaling of 0.45 for AGN Mrk231 to fit the observed MIR luminosity of WISE-J0301. If we assume that the FIR SED of this object is similar to that of Mrk231, we derive an upper limit on the mass of the BH at the center of WISE-J0301 to be 1.0 108 .
We also extracted the X-ray brightness of WISE-J0301 from archival Chandra X-ray data. We find LX-ray 2 1043 ergs s-1. In order to correct for absorption to the X-ray brightness, we need to use the MIR - X-ray luminosity correlation demonstrated by Lutz et al. (2004). We estimate a 6 m flux density from only the variable component of WISE W1, and W2 fluxes (stellar component subtracted) using a simple power-law shown in Equation 4. We estimate L6μm 6 1044 ergs s-1 which indicates an absorption-correction of 5 to the measured X-ray flux. Assuming LX-ray 0.1 LBol, consistent with the measured 6m luminosity, the absorption-corrected X-ray luminosity of LX-ray 1 1044 ergs s-1 places a lower limit on the BH mass of 1.0 107 , assuming Eddington limited accretion;
| (6) |
where MBH is the mass of the central BH. Naturally, if the accretion rate were sub-Eddington, the resultant black hole mass would be much higher. Furthermore, if WISE-J0301 turns out to be brighter than Mrk231 in FIR, it could either imply a higher accretion rate or a higher star-formation rate than in Mrk231.
It is interesting to analyze the properties of WISE-J0301 in the context of BH to stellar mass relations of AGN in the low-z universe (Reines & Volonteri, 2015). For the estimated stellar mass of 2 1011 M⊙, a BH mass of 107 M⊙ is substantially below the canonical black hole to stellar mass relationship presented in McConnell & Ma (2013). However, a BH mass of 108 M⊙ is consistent with the relationship found for broad line AGN, arguing in favor of the higher value and suggesting that the FIR SED of this source may indeed be similar to Mrk231.
| SFRUV | 0.71 /yr |
|---|---|
| Stellar Mass | |
| LUV-NIR | - |
| SFR8-1000μm(SFR | 70 /yr |
| L8-1000μm (LIR) | - |
| BH MASS |
6 Conclusions and future works
WISE J030654.88+010833.6 (WISE-J0301) at redshift, 0.28 0.31, is one of the few known MIR variable, radio detected AGN hosted in a ULIRG which shows optical variability at redder wavelengths. The model SED fit to the UV-MIR photometry combined with AGN Mrk231 template fit to MIR photometry indicate that WISE-J0301 could possibly be a composite AGN/starburst ULIRG in a phase where high star formation (SFR 70 M⊙ year-1) is occurring. The black hole to stellar mass ratio of WISE-J0301 also appears to be consistent with that of broad line AGN in the local universe. Our estimates of the SFRIR and BH mass of WISE-J0301 are highly uncertain and based on scaling the Mrk231 SED template to the MIR photometry. We currently do not have any publicly available spectra or FIR photometry for WISE-J0301 which would provide more robust estimates of these parameters. The optical and MIR images do not show any clear evidence of merger activity which is popularly believed to be the driving force behind ULIRG at lower redshifts. This could possibly be an indicator of the fact that WISE-J0301 is at a very late stage of a merger. The long-term MIR variability, combined with the red optical colors of the emission, seems to suggest that the variability is because of variations in the accretion rate of the black hole which is partly obscured by dust. The dust thermally reprocesses some of the luminosity emitted by the accretion disk; thus the variation in mid-infrared luminosity should lag that seen in the optical bands by the light travel time across a dusty torus.
In the future, we plan to obtain FIR measurements for WISE-J0301, which is necessary to disentangle the contribution of the AGN and star formation to the bolometric luminosity. Further, we currently have a Spitzer space telescope DDT approved program to extend the MIR light curves by 6 months, post NEOWISE (June 2019), which when combined with future PanSTARRS data will allow us to further investigate the origins of MIR variability. WISE-J0301 provides us with a rare opportunity to put important constraints on the growth of SMBH and their connection to galaxy evolution at late cosmic times.
7 ACKNOWLEDGMENTS
This work was supported by Joint Survey Processing (JSP) at IPAC/Caltech which is aimed at combined analysis of Euclid, LSST, and WFIRST. Funding for JSP has been provided by NASA grant 80NM0018F0803.
This publication makes use of data products from the Wide-field Infrared Survey Explorer, which is a joint project of the University of California, Los Angeles, and the Jet Propulsion Laboratory/California Institute of Technology, funded by the National Aeronautics and Space Administration.
This research has also made use of the NASA/IPAC Extragalactic Database (NED) which is operated by JPL/Caltech, under contract with NASA. Ned Wright’s Cosmology Calculator was also used in preparing this paper.
We thank the Spitzer Science Center Director and observation support team for an award of Director’s Discretionary Time for this project.
Funding for the Sloan Digital Sky Survey IV has been provided by the Alfred P. Sloan Foundation, the U.S. Department of Energy Office of Science, and the Participating Institutions. SDSS acknowledges support and resources from the Center for High-Performance Computing at the University of Utah. The SDSS web site is www.sdss.org.
SDSS is managed by the Astrophysical Research Consortium for the Participating Institutions of the SDSS Collaboration including the Brazilian Participation Group, the Carnegie Institution for Science, Carnegie Mellon University, the Chilean Participation Group, the French Participation Group, Harvard-Smithsonian Center for Astrophysics, Instituto de Astrofísica de Canarias, The Johns Hopkins University, Kavli Institute for the Physics and Mathematics of the Universe (IPMU) / University of Tokyo, the Korean Participation Group, Lawrence Berkeley National Laboratory, Leibniz Institut für Astrophysik Potsdam (AIP), Max-Planck-Institut für Astronomie (MPIA Heidelberg), Max-Planck-Institut für Astrophysik (MPA Garching), Max-Planck-Institut für Extraterrestrische Physik (MPE), National Astronomical Observatories of China, New Mexico State University, New York University, University of Notre Dame, Observatório Nacional / MCTI, The Ohio State University, Pennsylvania State University, Shanghai Astronomical Observatory, United Kingdom Participation Group, Universidad Nacional Autónoma de México, University of Arizona, University of Colorado Boulder, University of Oxford, University of Portsmouth, University of Utah, University of Virginia, University of Washington, University of Wisconsin, Vanderbilt University, and Yale University.
The Pan-STARRS1 Surveys (PS1) have been made possible through contributions of the Institute for Astronomy, the University of Hawaii, the Pan-STARRS Project Office, the Max-Planck Society and its participating institutes, the Max Planck Institute for Astronomy, Heidelberg and the Max Planck Institute for Extraterrestrial Physics, Garching, The Johns Hopkins University, Durham University, the University of Edinburgh, Queen’s University Belfast, the Harvard-Smithsonian Center for Astrophysics, the Las Cumbres Observatory Global Telescope Network Incorporated, the National Central University of Taiwan, the Space Telescope Science Institute, the National Aeronautics and Space Administration under Grant No. NNX08AR22G issued through the Planetary Science Division of the NASA Science Mission Directorate, the National Science Foundation under Grant No. AST-1238877, the University of Maryland, and Eotvos Lorand University (ELTE).
The Catalina Real-time Transient survey is funded by the National Aeronautics and Space Administration under Grant No. NNG05GF22G issued through the Science Mission Directorate Near-Earth Objects Observations Program. The CRTS survey is supported by the U.S. National Science Foundation under grants AST-0909182.
References
- Abolfathi et al. (2018) Abolfathi, B., Aguado, D. S., Aguilar, G., et al. 2018, ApJS, 235, 42
- Alam et al. (2015) Alam, S., Albareti, F. D., Allende Prieto, C., et al. 2015, ApJS, 219, 12
- Assef et al. (2018) Assef, R. J., Stern, D., Noirot, G., et al. 2018, ApJS, 234, 23
- Astropy Collaboration et al. (2013) Astropy Collaboration, Robitaille, T. P., Tollerud, E. J., et al. 2013, A&A, 558, A33
- Bradley et al. (2018) Bradley, L., Sipocz, B., Robitaille, T., et al. 2018, astropy/photutils: v0.5, doi:10.5281/zenodo.1340699
- Brammer et al. (2008) Brammer, G. B., van Dokkum, P. G., & Coppi, P. 2008, ApJ, 686, 1503
- Chambers et al. (2016a) Chambers, K. C., Magnier, E. A., Metcalfe, N., et al. 2016a, ArXiv e-prints, arXiv:1612.05560
- Chambers et al. (2016b) —. 2016b, arXiv e-prints, arXiv:1612.05560
- Chary & Elbaz (2001) Chary, R., & Elbaz, D. 2001, ApJ, 556, 562
- Chen et al. (2013) Chen, X., Rachen, J. P., López-Caniego, M., et al. 2013, A&A, 553, A107
- Condon et al. (1998) Condon, J. J., Cotton, W. D., Greisen, E. W., et al. 1998, AJ, 115, 1693
- Conroy et al. (2009) Conroy, C., Gunn, J. E., & White, M. 2009, ApJ, 699, 486
- Dahlen et al. (2010) Dahlen, T., Mobasher, B., Dickinson, M., et al. 2010, ApJ, 724, 425
- Draine & Li (2007) Draine, B. T., & Li, A. 2007, ApJ, 657, 810
- Drake et al. (2009) Drake, A. J., Djorgovski, S. G., Mahabal, A., et al. 2009, ApJ, 696, 870
- Fitch et al. (1967) Fitch, W. S., Pacholczyk, A. G., & Weymann, R. J. 1967, ApJ, 150, L67
- Gao & Solomon (2004) Gao, Y., & Solomon, P. M. 2004, ApJ, 606, 271
- Hopkins et al. (2012) Hopkins, P. F., Hayward, C. C., Narayanan, D., & Hernquist, L. 2012, MNRAS, 420, 320
- Hopkins et al. (2005) Hopkins, P. F., Hernquist, L., Martini, P., et al. 2005, ApJ, 625, L71
- Kawaguchi et al. (1998) Kawaguchi, T., Mineshige, S., Umemura, M., & Turner, E. L. 1998, ApJ, 504, 671
- Kirkpatrick et al. (2013) Kirkpatrick, A., Pope, A., Charmandaris, V., et al. 2013, ApJ, 763, 123
- Leighly et al. (2014) Leighly, K. M., Terndrup, D. M., Baron, E., et al. 2014, The Astrophysical Journal, 788, 123
- Lutz et al. (2004) Lutz, D., Maiolino, R., Spoon, H. W. W., & Moorwood, A. F. M. 2004, A&A, 418, 465
- Mainzer et al. (2011) Mainzer, A., Bauer, J., Grav, T., et al. 2011, ApJ, 731, 53
- Martin et al. (2005) Martin, D. C., Fanson, J., Schiminovich, D., et al. 2005, ApJ, 619, L1
- McConnell & Ma (2013) McConnell, N. J., & Ma, C.-P. 2013, ApJ, 764, 184
- Neugebauer et al. (1984) Neugebauer, G., Habing, H. J., van Duinen, R., et al. 1984, ApJ, 278, L1
- Oke & Gunn (1983) Oke, J. B., & Gunn, J. E. 1983, ApJ, 266, 713
- Peterson (1997) Peterson, B. M. 1997, An Introduction to Active Galactic Nuclei
- Planck Collaboration et al. (2014) Planck Collaboration, Ade, P. A. R., Aghanim, N., et al. 2014, A&A, 571, A16
- Reines & Volonteri (2015) Reines, A. E., & Volonteri, M. 2015, ApJ, 813, 82
- Reynolds et al. (2013) Reynolds, C., Punsly, B., O’Dea, C. P., & Hurley-Walker, N. 2013, ApJ, 776, L21
- Salvato et al. (2009) Salvato, M., Hasinger, G., Ilbert, O., et al. 2009, ApJ, 690, 1250
- Sanders et al. (1988) Sanders, D. B., Soifer, B. T., Elias, J. H., et al. 1988, ApJ, 325, 74
- Shakura & Sunyaev (1973) Shakura, N. I., & Sunyaev, R. A. 1973, A&A, 24, 337
- Shields (1978) Shields, G. A. 1978, in BAAS, Vol. 10, Bulletin of the American Astronomical Society, 690
- Skrutskie et al. (2006) Skrutskie, M. F., Cutri, R. M., Stiening, R., et al. 2006, AJ, 131, 1163
- Stern et al. (2012) Stern, D., Assef, R. J., Benford, D. J., et al. 2012, ApJ, 753, 30
- Veilleux et al. (2009) Veilleux, S., Rupke, D. S. N., Kim, D.-C., et al. 2009, ApJS, 182, 628
- Weedman et al. (2005) Weedman, D. W., Hao, L., Higdon, S. J. U., et al. 2005, ApJ, 633, 706
- Wright et al. (2010) Wright, E. L., Eisenhardt, P. R. M., Mainzer, A. K., et al. 2010, AJ, 140, 1868