VISON: An Ontology-Based Approach for
Software Visualization Tool Discoverability
Abstract
Although many tools have been presented in the research literature of software visualization, there is little evidence of their adoption. To choose a suitable visualization tool, practitioners need to analyze various characteristics of tools such as their supported software concerns and level of maturity. Indeed, some tools can be prototypes for which the lifespan is expected to be short, whereas others can be fairly mature products that are maintained for a longer time. Although such characteristics are often described in papers, we conjecture that practitioners willing to adopt software visualizations require additional support to discover suitable visualization tools. In this paper, we elaborate on our efforts to provide such support. To this end, we systematically analyzed research papers in the literature of software visualization and curated a catalog of 70 available tools that employ various visualization techniques to support the analysis of multiple software concerns. We further encapsulate these characteristics in an ontology. VISON, our software visualization ontology, captures these semantics as concepts and relationships. We report on early results of usage scenarios that demonstrate how the ontology can support (i) developers to find suitable tools for particular development concerns, and (ii) researchers who propose new software visualization tools to identify a baseline tool for a controlled experiment.
I Introduction
Complex questions may arise during software development [1, 2, 3, 4]. Over the last two decades, many software visualizations have been presented in the research literature and shown to be suitable to address some of these questions [5]. However, there is still little evidence of where and how software visualizations are being discovered and adopted by practitioners. To find a suitable tool, practitioners need to examine aspects such as the development tasks supported by the tool, the required execution environment, the level of maturity of the tool, and whether there is a maintenance plan for future improvements and bug fixes. For example, practitioners can be reluctant to adopt some prototypical visualization tools that often have a short lifespan, and more open to adopt tools that belong to long-term projects and are expected to be maintained for a fairly long time.
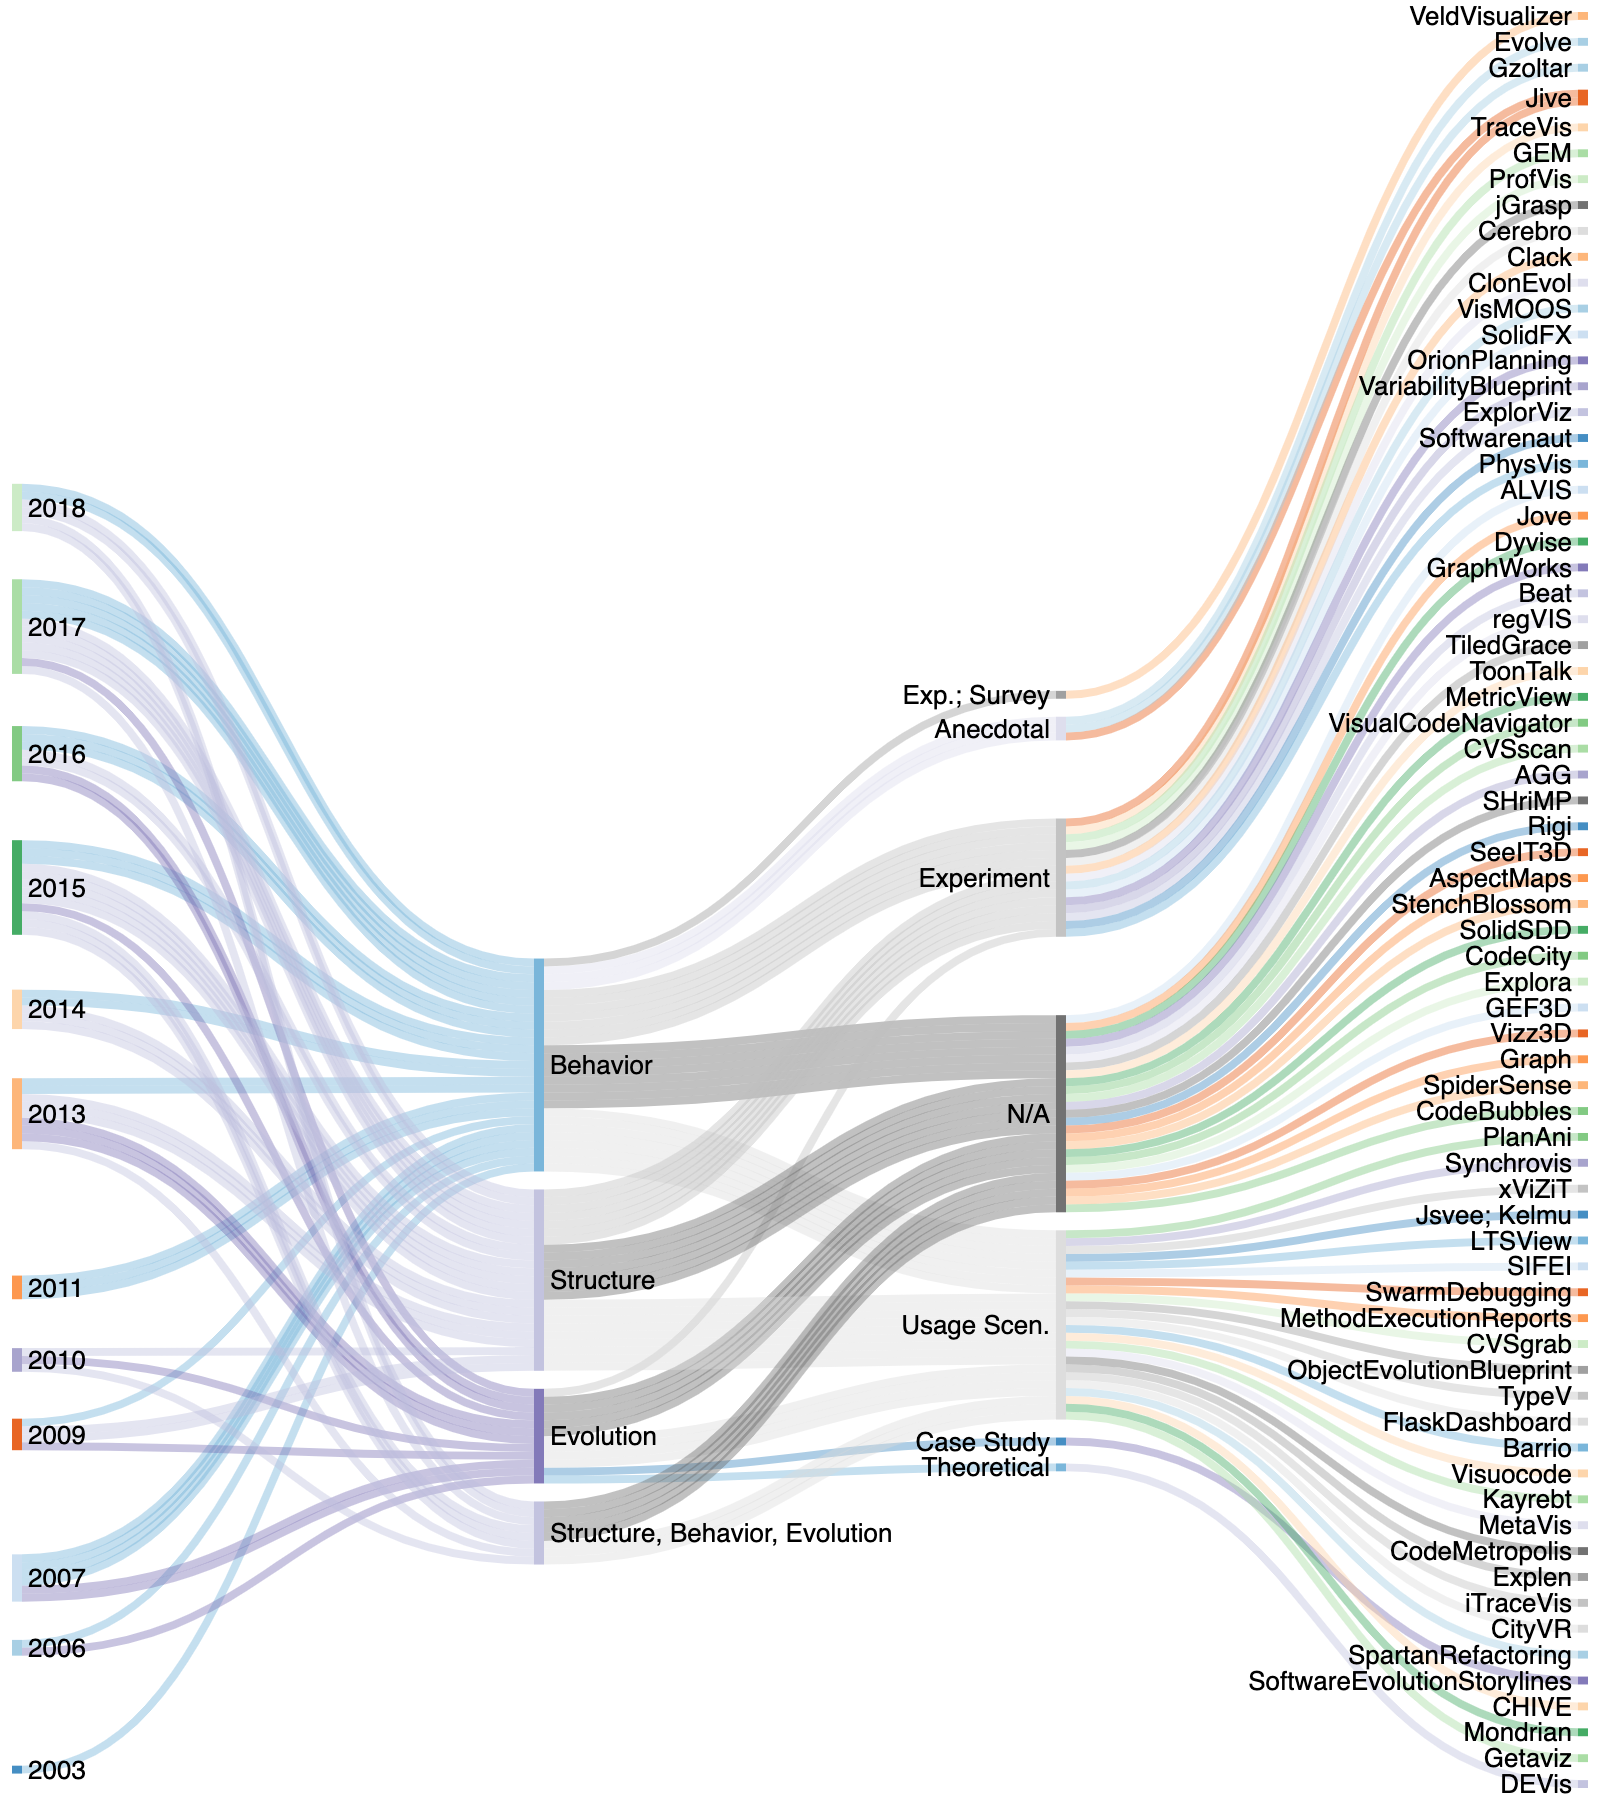
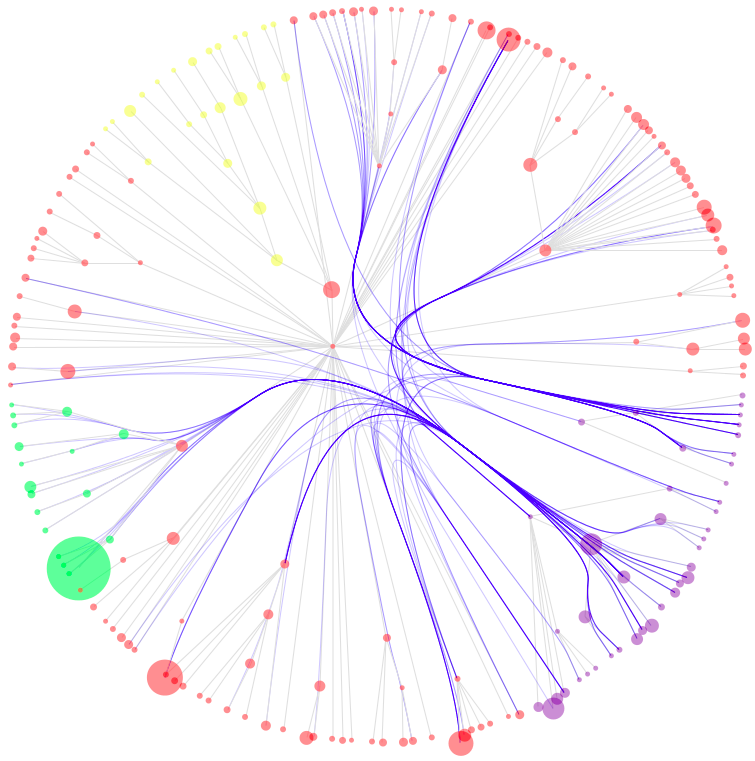
To address the gap between existing software visualizations and their practical applications, we build on previous studies [6, 7] in which we reviewed the literature of software visualization to collect their characteristics. This article is based on results that were reported in the doctoral thesis of the first author [8]. We updated the review and curated a catalog of 70 publicly available software visualization tools. For each tool in the catalog, we identify (i) the tool’s name (e.g., Jive), (ii) software aspects (e.g., behavior, structure, evolution), (iii) software concerns (e.g., execution traces of Java programs), (iv) last update (e.g., 2017), (v) execution environment (e.g., Eclipse plug-in), (vi) employed visualization techniques (e.g., node-link diagram), (vii) display medium (e.g., standard computer screen (SCS), immersive virtual reality (I3D)), and (viii) evaluations (e.g., controlled experiment). Figure 1 shows a Sankey diagram of our catalog of visualization tools introduced in the literature of software visualization. The ontology, which enables both textual and visual search methods, then can be used by practitioners to find suitable software visualizations as well as by researchers who can reflect on the software visualization domain. The ontology can also enable higher-level frameworks to support practitioners to search for software visualization tools.
Why a software visualization ontology? Ontologies are formal and explicit descriptions of concepts in a domain [9]. Ontologies can help (i) share a common understanding of the structure of information among people or software agents, (ii) reuse domain knowledge, (iii) enforce domain assumptions, (iv) separate domain knowledge from operational knowledge, and (v) analyze domain knowledge.
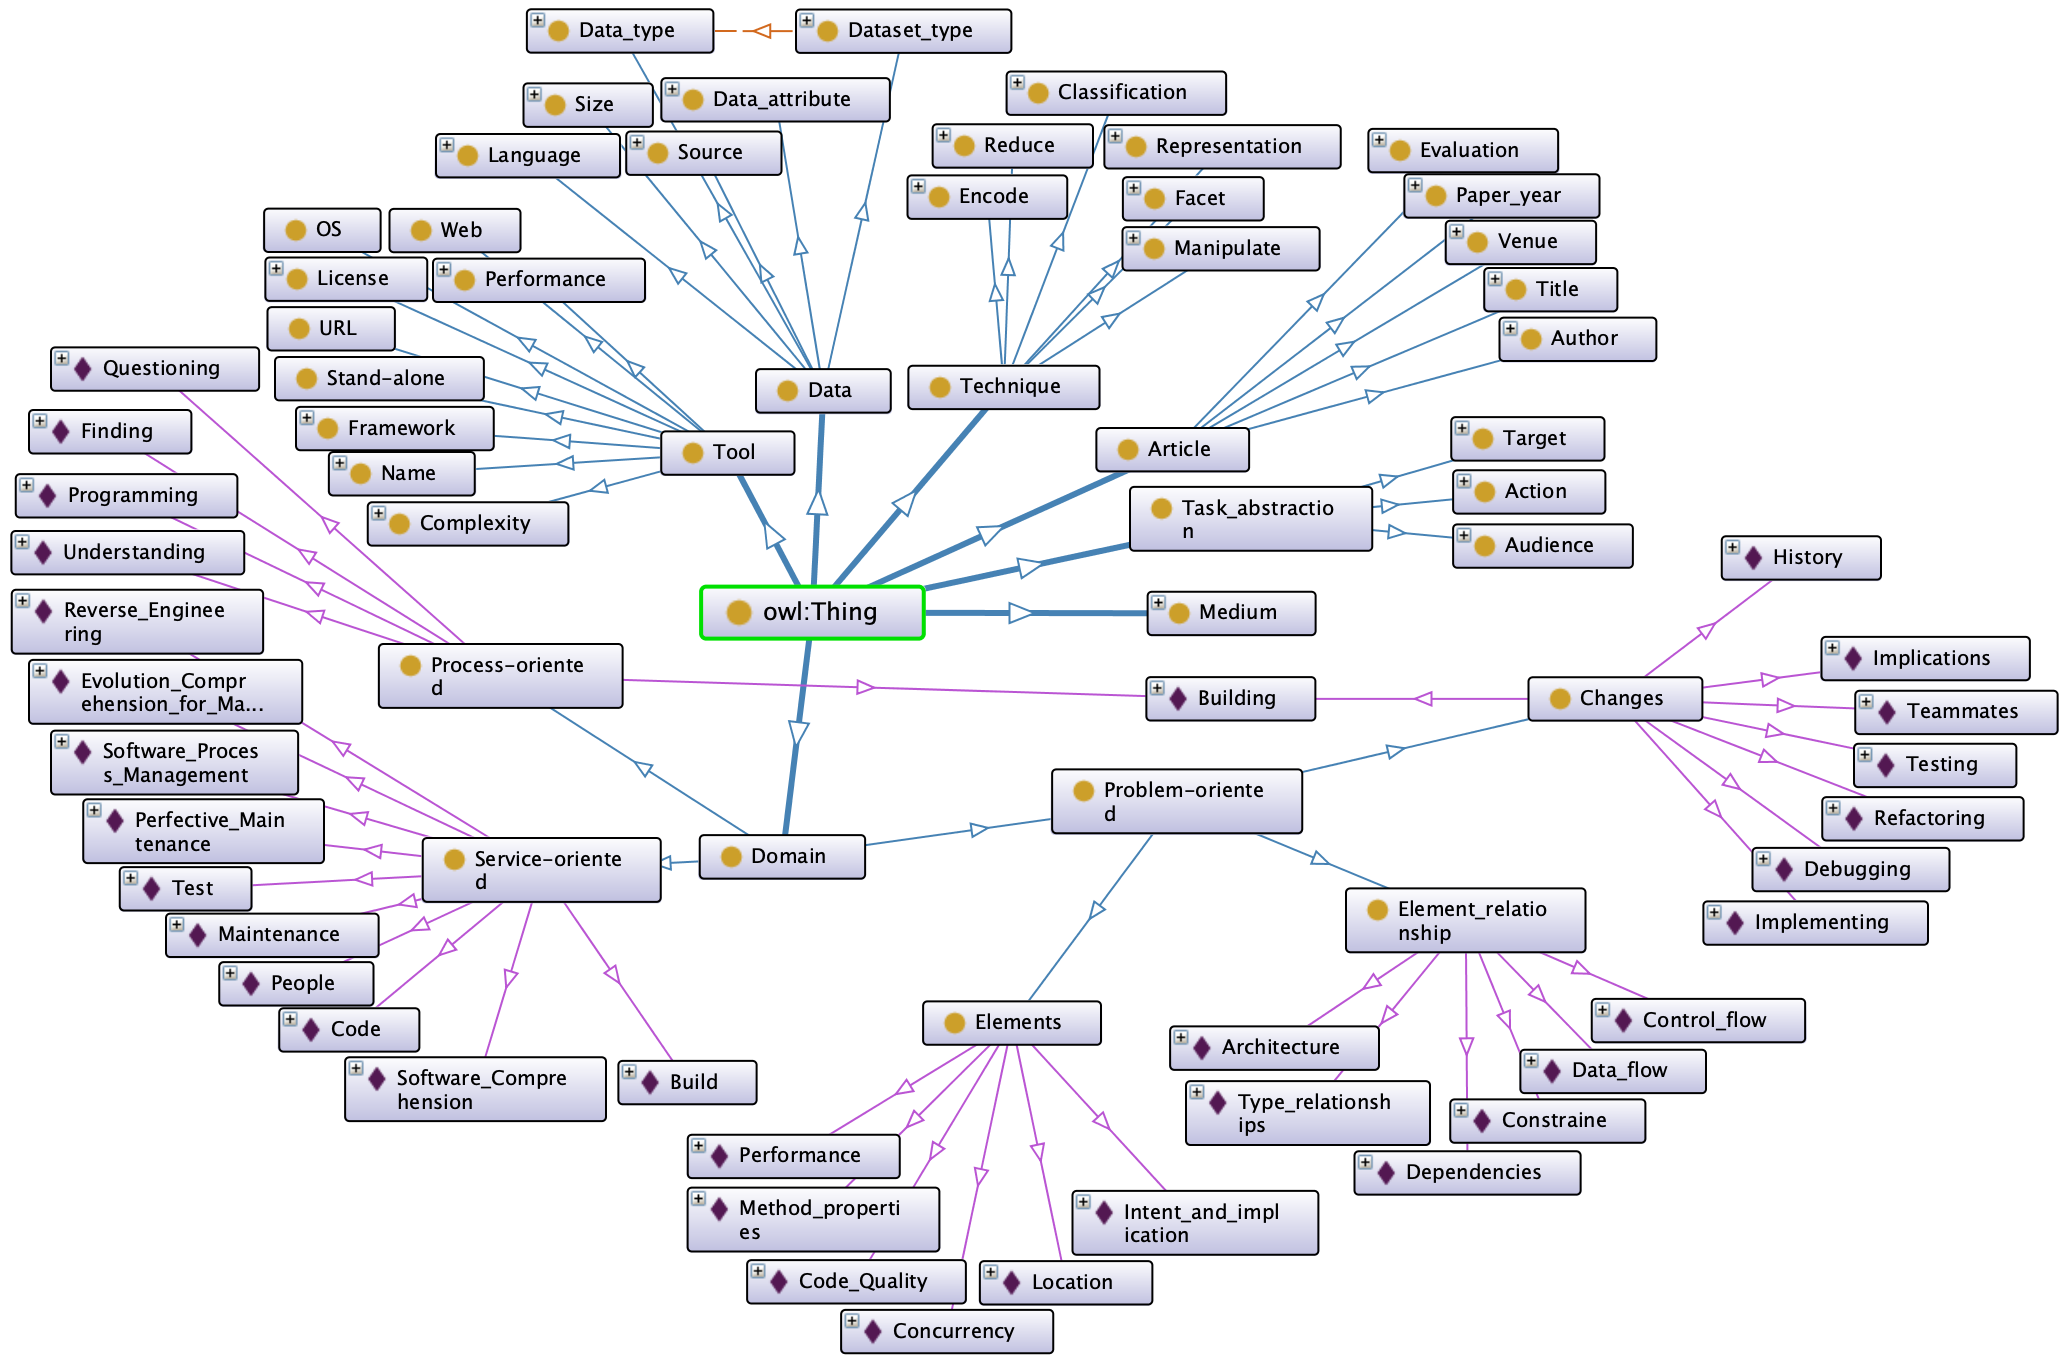
Figure 2 shows an overview of VISON, our software visualization ontology that encapsulates main characteristics of software visualizations. To the best of our knowledge, VISON is the first ontology of software visualizations. We elaborate on lessons learned from developing the ontology, and early results of usability through usage scenarios.
To populate VISON, we built on a set of selected papers of previous surveys of the software visualization literature [6, 7]. Specifically, we scanned each classified design study paper to identify software visualization tools. For each tool that we found, we checked whether the tool is publicly available on the internet. In the end, we curated a catalog of 70 publicly available software visualization tools that we used to populate our ontology.
The main contribution of this paper is twofold: (i) a curated catalog of 70 available software visualization tools and, (ii) a publicly available [10] software visualization ontology.
The remainder of the paper is structured as follows: Section II describes related work that focuses on practical applications of software visualizations and catalogs of software visualization tools. Section III elaborates on the main concepts of ontologies that are addressed in our study. Section IV presents VISON, our software visualization ontology. We first elaborate on a catalog of 70 available software visualization tools, and then we discuss ontology implementation details. Section VI concludes and presents future work.
II Related Work
We group related work into two main themes. We first discuss research that proposes approaches to practical applications of software visualization tools. Then, we elaborate on studies that present catalogs of software visualization tools.
II-A Practical Applications of Software Visualizations
We observe that there are only a few studies that have been carried out to fill the gap between existing software visualizations and their practical applications. For instance, Hassaine et al. [11] elaborate on an approach for generating visualizations to support software maintenance tasks. Sfayhi and Sahraoui [12] describe how to generate interactive visualizations based on descriptions of code analysis tasks. To this end, developers are required to describe the task using a domain-specific language. Grammel et al. [13] investigate how novices construct information visualizations. Based on the analysis of the usage of simple visualizations such as charts and scatter plots, they identify a user’s need for information visualization tools. However, we observe that these visualizations provide limited support for the analysis of development concerns. Three other studies [14, 15, 16] investigate software development tasks for which visualization tools have been proposed, however, we consider that the tasks in these studies are at a too high-level for developers to find an appropriate visualization to their particular needs. Merino et al. [17] introduce a meta-visualization approach of live visualization example objects annotated with the type of development questions that they can help investigate. In the visualization, developers can identify suitable visualization examples by detecting the surrounding keywords in the tag-iconic cloud-based visualization. Instead, we propose the use of an ontology that can encapsulate the semantics of the characteristics of software visualizations. As opposed to the described studies, our ontology-based approach leverages existing software visualization tools by attempting to provide practitioners a means for discovery.
II-B Catalogs of Software Visualization Tools
Some studies examine software visualization tools, in particular, to create guidelines for designing and evaluating software visualizations. For example, Storey et al. [18] examine 12 software visualization tools and propose a framework to evaluate software visualizations based on intent, information, presentation, interaction, and effectiveness. Sensalire et al. [19, 20] classify the features users require in software visualization tools. To this end, they elaborate on lessons learned from evaluating 20 software visualization tools and identify dimensions that can help design an evaluation and then analyze the results. In our investigation, we do not attempt to provide a comprehensive catalog of software visualization tools, but we seek to provide a means to boost software visualization discoverability.
Some other studies present taxonomies that characterize software visualization tools. Myers [21] classifies software visualization tools based on whether they focus on code, data, or algorithms; and whether they are implemented in a static or dynamic fashion. Price et al. [22] present a taxonomy of software visualization tools based on six dimensions: scope, content, form, method, interaction, and effectiveness. Maletic et al. [23] propose a taxonomy of five dimensions to classify software visualization tools: tasks, audience, target, representation, and medium. Schots et al. [24] extend this taxonomy by adding two dimensions: resource requirements of visualizations, and evidence of their utility. Merino et al. [6] add needs as a main characteristic of software visualization tools. In their context, “needs” refers to the set of questions that are supported by software visualization tools. Although we consider these studies crucial for reflecting on the software visualization domain, we think that practitioners may require a more comprehensive support to identify a suitable tool. In particular, we believe that the semantics of concepts and their relationships are often missing in taxonomies and other classifications. The use of an ontology enforces the analysis of these relationships, which can play an important role in identifying a suitable visualization tools.
III Ontology Design Considerations
An ontology is a formalization of a model to describe what is essential in a domain. That is, the ontology describes the concepts in the domain that can define various properties and restrictions. Hence, an ontology populated with a set of individual instances of the concepts is usually referred to as a knowledge base. However, defining what in the domain is modeled as a concept or an instance is subjective. We opted to follow the widely used guidelines proposed by Noy and McGuiness [25]. We now elaborate on how we addressed their suggested steps to create our software visualization ontology.
Step 1. Determine the domain and scope of the ontology.
-
•
What is the domain that the ontology will cover? Software visualizations.
-
•
For what we are going to use the ontology? To allow 1) developers to find suitable visualizations for their particular concerns and 2) researchers to reflect on the software visualization domain.
-
•
For what types of questions the information in the ontology should provide answers? Questions that identify particular software visualizations that fulfill the restrictions imposed by the context of the developers needs.
-
•
Who will use and maintain the ontology? Software developers willing to adopt visualizations, and who have used a visualization from the ontology and want to add new supported questions to it. Also, researchers who want to add new data to the ontology for a new or an existing indexed visualization approach.
Step 2. Consider reusing existing ontologies. To the best of our knowledge, this is the first ontology of software visualizations.
Step 3. Enumerate important terms in the ontology. We include the characteristics of software visualization and their evaluations, as well as the classifications presented in previous studies [6, 7].
Step 4. Define the concepts and the concept hierarchy. We opt for a bottom-up development process in which we start from instances of proposed software visualizations. For each, we identify the various concepts involved in its context (e.g., tasks, media, environments, frameworks, questions, evaluation strategies). We define a hierarchy of concepts following an “is-a” relation. When defining the concepts, we avoid creating cycles and validate that sibling concepts (i.e., at the same level in the hierarchy) correspond to the same level of generality.
Step 5. Define the properties of concepts. We characterize the concepts based on their properties. For instance, for the concept medium we define the dimensionality (e.g., 2D/3D) property. Then, when we define particular software visualizations as instances in the ontology, we can specify a medium and its dimensionality. Thus, researchers can use the ontology to investigate, for instance, the correlation between evaluation strategies and visualizations that use visualization techniques of a higher dimensionality displayed on a medium of a lower dimensionality.
Step 6. Define the restrictions of the properties. We only use restrictions to define disjoint concepts.
Step 7. Create instances. We create instances in the ontology for each proposed software visualization in our data set. Thus, visualization tools are the materialization of a combination of property values of concepts.
IV VISON: Software Visualization Ontology
Certainly, an empty ontology that describes concepts and relationships but has no instances cannot be useful for practitioners. Therefore, before we describe an implementation of our ontology, we elaborate on the systematic approach that we used to populate it. In the following, we describe the process followed to collect a set of relevant software visualization tools and their characteristics from the research literature.
IV-A Software Visualization Tools
We built on the data sets from the proposed software visualization approaches (presented in previous studies [6, 7]). We reviewed the 387 software visualization papers published in the VISSOFT/SOFTVIS conferences. Since the goal of our investigation is to facilitate the discoverability of software visualization tools, we included in our catalog only software visualization tools that are: (C1) identified with a name and (C2) publicly available on the internet.
We scanned each paper to identify a name for the proposed software visualization approach. Then, we looked for a URL where the tool might be available. In most cases (where we did not find a URL in the paper), we searched the Web using the name of the tool (C1). When we did not find a positive result, we added “visualization” to the search keywords. When we found an available tool (C2), we checked the last time when the tool was updated. Sometimes, we had to download the tool to look for the date in the files. In the end, we found 70 software visualization tools that fulfill the criteria and that we therefore included in our catalog.
To characterize a tool we first identified its name and whether it focuses on the structure, behavior, or evolution of software systems [26]. Then, for the tools in each category, we identified the development concern expressed by the visualization. Instead of describing high-level tasks (e.g., reverse-engineering), we formulated descriptions with the main keywords of the concerns (e.g., “reports that summarize methods execution”), which we think can help developers relate their particular context to the one envisioned by a proposed visualization tool. We also classified the tools based on their execution environment, the employed visualization technique, and the medium used to display them. Finally, we reused the data presented in our previous study [7] to highlight the maturity of tools that have proven effective to support the target task through evaluations.
| Asp. | Tool’s Name | Year | Software Concern | Environment | Technique | Med. | Evaluation |
| Behavior | Clack | 2018 | Concepts for teaching networks in CS | Java | Node-link | SCS | Anecdotal |
| ToonTalk | 2018 | Concepts for teaching children to program | Web | Visual language | SCS | N/A | |
| LTSView | 2017 | Transition systems | Various | 3D node-link | SCS | N/A | |
| Gzoltar | 2017 | Fault localization for debugging Java progs. | Java;Ecli. | Icicle; treemap | SCS | Experiment | |
| SIFEI | 2017 | Spreadsheets formulas for testing | Excel | Visual language | SCS | Experiment | |
| SwarmDebugging | 2017 | Reuse knowledge of debugging sessions | Eclipse | Node-link | SCS | Usage Scen. | |
| MethodExecutionReports | 2017 | Summarization of methods execution | Java | Charts | SCS | Experiment | |
| Jive | 2016 | Execution traces of Java programs | Eclipse | Node-L; aug.src. | SCS | Anecdotal | |
| Cerebro | 2016 | Execution traces for feature identification | Web | Node-link | SCS | Usage Scen. | |
| Jsvee; Kelmu | 2016 | Concepts for teaching programming in CS | Web | Aug. source code | SCS | Usage Scen. | |
| Kayrebt | 2015 | Control and data flow of the Linux kernel | Linux | Node-link | SCS | Usage Scen. | |
| TiledGrace | 2015 | Programming in the Grace language | Web | Visual language | SCS | Experiment | |
| jGrasp | 2015 | Concepts for teaching programming in CS | Various | Aug. source code | SCS | Exp.; Survey | |
| xViZiT | 2015 | Spreadsheets formulas for testing | Java | Aug. source code | SCS | Usage Scen. | |
| Beat | 2014 | Execution traces of Java concurrent prog. | Eclipse | Aug. source code | SCS | N/A | |
| regVIS | 2014 | Assembler control-flow of regular expr. | Windows | Visual language | SCS | Experiment | |
| GraphWorks | 2013 | Concepts for teaching graph theory in CS | Java | Anim. node-link | SCS | N/A | |
| Synchrovis | 2013 | Execution traces of Java concurrent prog. | Java | City | SCS | Usage Scen. | |
| PlanAni | 2011 | Concepts for teaching programming in CS | Various | Aug. source code | SCS | Experiment | |
| ProfVis | 2011 | Execution traces of Java programs | Java | Node-link | SCS | Experiment | |
| GEM | 2011 | Dynamic verification of MPI programs | Eclipse | Aug. source code | SCS | N/A | |
| Dyvise | 2009 | Java heap to detect memory problems | Java | Icicle | SCS | Anecdotal | |
| Jive | 2007 | Execution traces of Java programs | Java | Charts | SCS | Usage Scen. | |
| Jove | 2007 | Execution traces of Java programs | Java | Charts | SCS | N/A | |
| VeldVisualizer | 2007 | Execution traces of Java programs | Java | Pixel | SCS | N/A | |
| TraceVis | 2007 | Execution traces based on call graphs | Java | Node-link | SCS | Usage Scen. | |
| ALVIS | 2006 | Concepts for teaching programming in CS | Windows | Visual language | SCS | N/A | |
| Evolve | 2003 | Execution traces of Java programs | Java | Pixel | SCS | Usage Scen. | |
| Structure | PhysVis | 2018 | Software quality based on metric analysis | VisualStudio | 3D node-link | I3D | Usage Scen. |
| SpartanRefactoring | 2018 | Automatic code refactoring for readability | Eclipse | Aug. source code | SCS | N/A | |
| Softwarenaut | 2017 | Architecture and dependency analysis | VisualWorks | Node-L.; treemap | SCS | N/A | |
| CodeMetropolis | 2017 | Software quality based on metric analysis | Java | City | SCS | N/A | |
| Explen | 2017 | Slice-based techs. for large metamodels | Eclipse | UML | SCS | N/A | |
| iTraceVis | 2017 | Eye movement data of code reading | Eclipse | Heatmap | SCS | Experiment | |
| CityVR | 2017 | Architecture based on metrics in OOP | Pharo; U. | City | I3D | Experiment | |
| ExplorViz | 2016 | Architecture based on metric analysis | Web | City | S/I | Experiment | |
| MetaVis | 2016 | Annotated visualization example objects | Pharo | Node-L.; tag cloud | SCS | Usage Scen. | |
| CodeCity | 2015 | Software quality based on code smells | Pharo | City | SCS | Usage Scen. | |
| Explora | 2015 | Software quality based on metric analysis | Pharo | Polymetric views | SCS | Usage Scen. | |
| OrionPlanning | 2015 | Arch. modularization and consistency | Pharo | Node-link | SCS | Usage Scen. | |
| VariabilityBlueprint | 2015 | Decomposition of models in FOP | Pharo | Polymetric views | SCS | Usage Scen. | |
| StenchBlossom | 2014 | Software quality based on code smells | Eclipse | Aug. source code | SCS | Experiment | |
| Visuocode | 2014 | Navigation and composition of systems | Mac | Aug. source code | SCS | N/A | |
| SolidSDD | 2014 | Software quality based on code clones | Windows | HEB | SCS | Usage Scen. | |
| SolidFX | 2013 | Architecture, metric and dependencies | Windows | HEB; pixel | SCS | Experiment | |
| SeeIT3D | 2013 | Software architecture of Java systems | Eclipse | City | SCS | Experiment | |
| AspectMaps | 2013 | Architecture of aspect-oriented programs | Pharo | Iconic; pixel | SCS | Experiment | |
| VisMOOS | 2010 | Software architecture of Java systems | Eclipse | Node-link | SCS | N/A | |
| Rigi | 2009 | Architecture and dependency analysis | Various | Node-link | SCS | N/A | |
| Barrio | 2009 | Architecture and dependency analysis | Eclipse | Node-link | SCS | Usage Scen. | |
| Evolution | FlaskDashboard | 2017 | Flask Python Web services performance | Python | Charts; heatmap | SCS | Usage Scen. |
| ObjectEvolutionBlueprint | 2016 | Object mutations | Pharo | Charts | SCS | Experiment | |
| TypeV | 2016 | Abstract syntax trees of a system’s project | Web | Charts | SCS | Usage Scen. | |
| SHriMP | 2015 | Hierarchical structures in OOP | Eclipse | Node-link | SCS | N/A | |
| AGG | 2013 | Hierarchical structures in OOP | Java | Node-link | SCS | N/A | |
| DEVis | 2013 | Technical documents | Eclipse | Spiral | SCS | Theoretical | |
| ClonEvol | 2013 | Software quality based on code clones | Windows | HEB | SCS | Usage Scen. | |
| SoftwareEvolutionStorylines | 2010 | Developers interactions in projects | Processing | StoryLines; charts | SCS | N/A | |
| CVSgrab | 2009 | Interactions during debugging | Windows | Pixel | SCS | N/A | |
| VisualCodeNavigator | 2007 | Source code changes | Windows | Aug. src.; pixel | SCS | Usage Scen. | |
| CVSscan | 2007 | Source code changes | Windows | Pixel | SCS | Case Study | |
| MetricView | 2006 | Hierarchical structures and metrics in OOP | Windows | 3D UML | SCS | N/A | |
| E.-S.-B. | Mondrian | 2018 | Execution traces of feature dependencies | Pharo | Polymetric views | SCS | N/A |
| Getaviz | 2018 | Developing and evaluating software vis. | Web | City | S/I | N/A | |
| CodeBubbles | 2018 | Debugging within CodeBubbles | Ecli.; VS | Visual language | SCS | N/A | |
| CHIVE | 2015 | Feature location (reconnaissance) | Eclipse | 3D node-link | SCS | N/A | |
| Graph | 2015 | Code dependencies | Pharo | Node-link | SCS | Usage Scen. | |
| SpiderSense | 2015 | Execution traces of Java programs | Web | Pixel; treemap | SCS | Usage Scen. | |
| Vizz3D | 2013 | Software architecture and quality | Java | 3D node-link | SCS | N/A | |
| GEF3D | 2010 | Execution traces of Java programs | Eclipse | 3D UML | SCS | Usage Scen. |
Table I presents our curated catalog of 70 available software visualization tools classified by the software’s date of last update, environment required to execute, employed visualization technique, medium, and evidence of the visualization’s effectiveness through evaluations. Each tool’s name is linked to a URL that contains instructions for downloading and installation. Visualization tools are classified into software aspects: behavior, evolution, and structure.
IV-A1 Behavior
Several visualization tools support teaching various subjects in computer science. ToonTalk [27] comes with a visual language (similar to Scratch [28]) that is to be used on the Web. The tool targets children as an audience. We are not aware of any evaluation of ToonTalk. However, the tool has been maintained over the last twelve years, which shows evidence of maturity. Similarly, Tiled Grace [29] offers a visual representation alternative to the textual mode when programming in the Grace language. Another mature tool is Clack [30], which helps students of network courses understand the behavior of routers. GraphWorks [31] focuses on supporting students of graph theory, although it has not been maintained in the last few years.
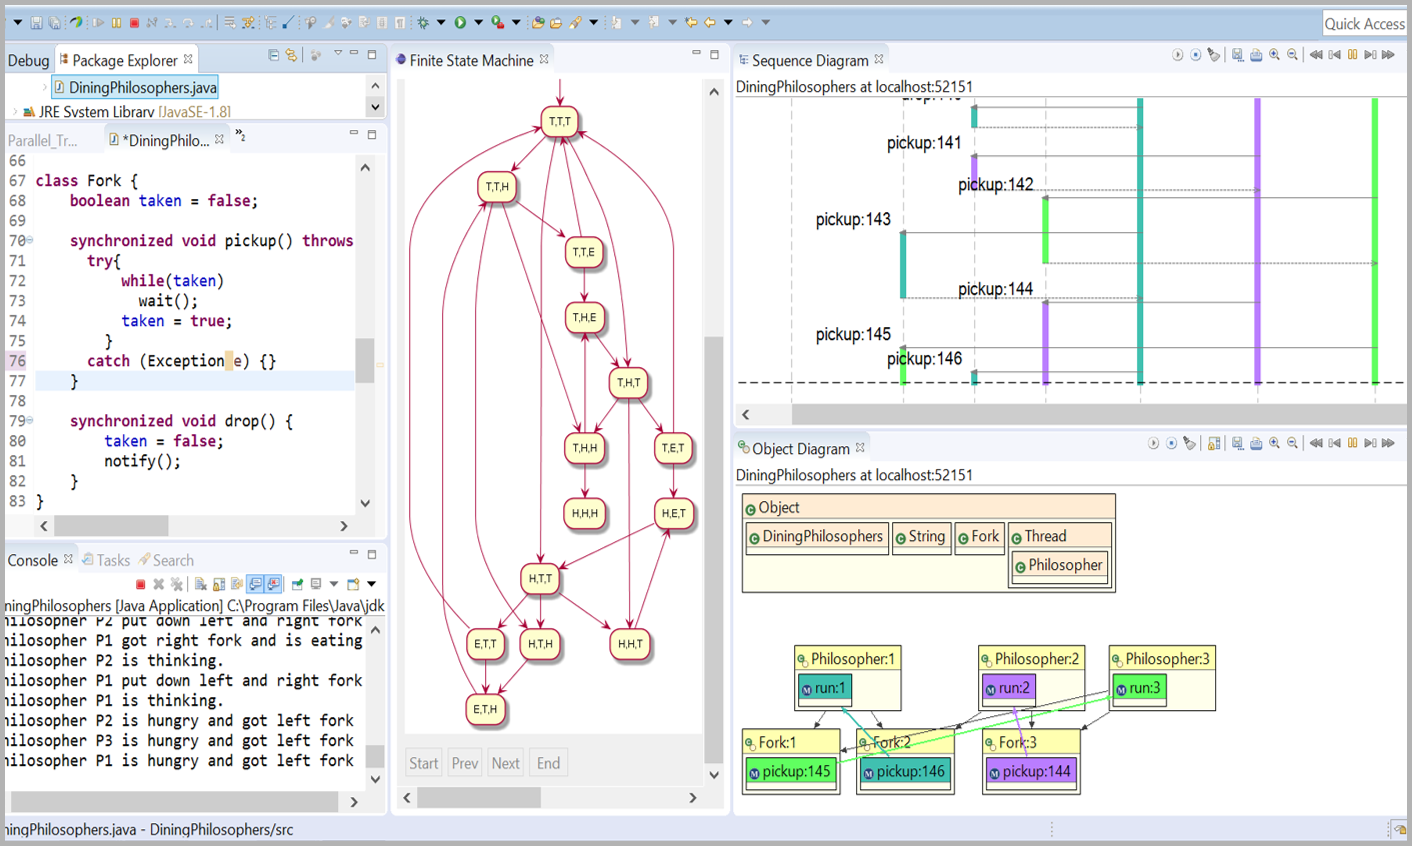
Some other tools are available to deal with understanding the execution of programs for testing. The Eclipse plug-in Jive [33] (shown in Figure 3) stands out since it has been maintained for the last eleven years, which is congruent with anecdotal evidence of its adoption. Even though all of these tools are available, almost none of them have been maintained lately. Amongst them, ProfVis [34] is the only one that has proven effective in an experiment. A few others—Jove [35] and Veld Visualizer [36]—have been presented only through usage scenarios. Other tools that, to our knowledge, have not been evaluated are Jive [37], TraceVis [38], and Evolve [39]. Two tools—Beat [40] and Synchrovis [41]—target the analysis of the behavior of concurrent Java programs, whereas the tool Cerebro [42] can be used to identify software features from the runtime data.
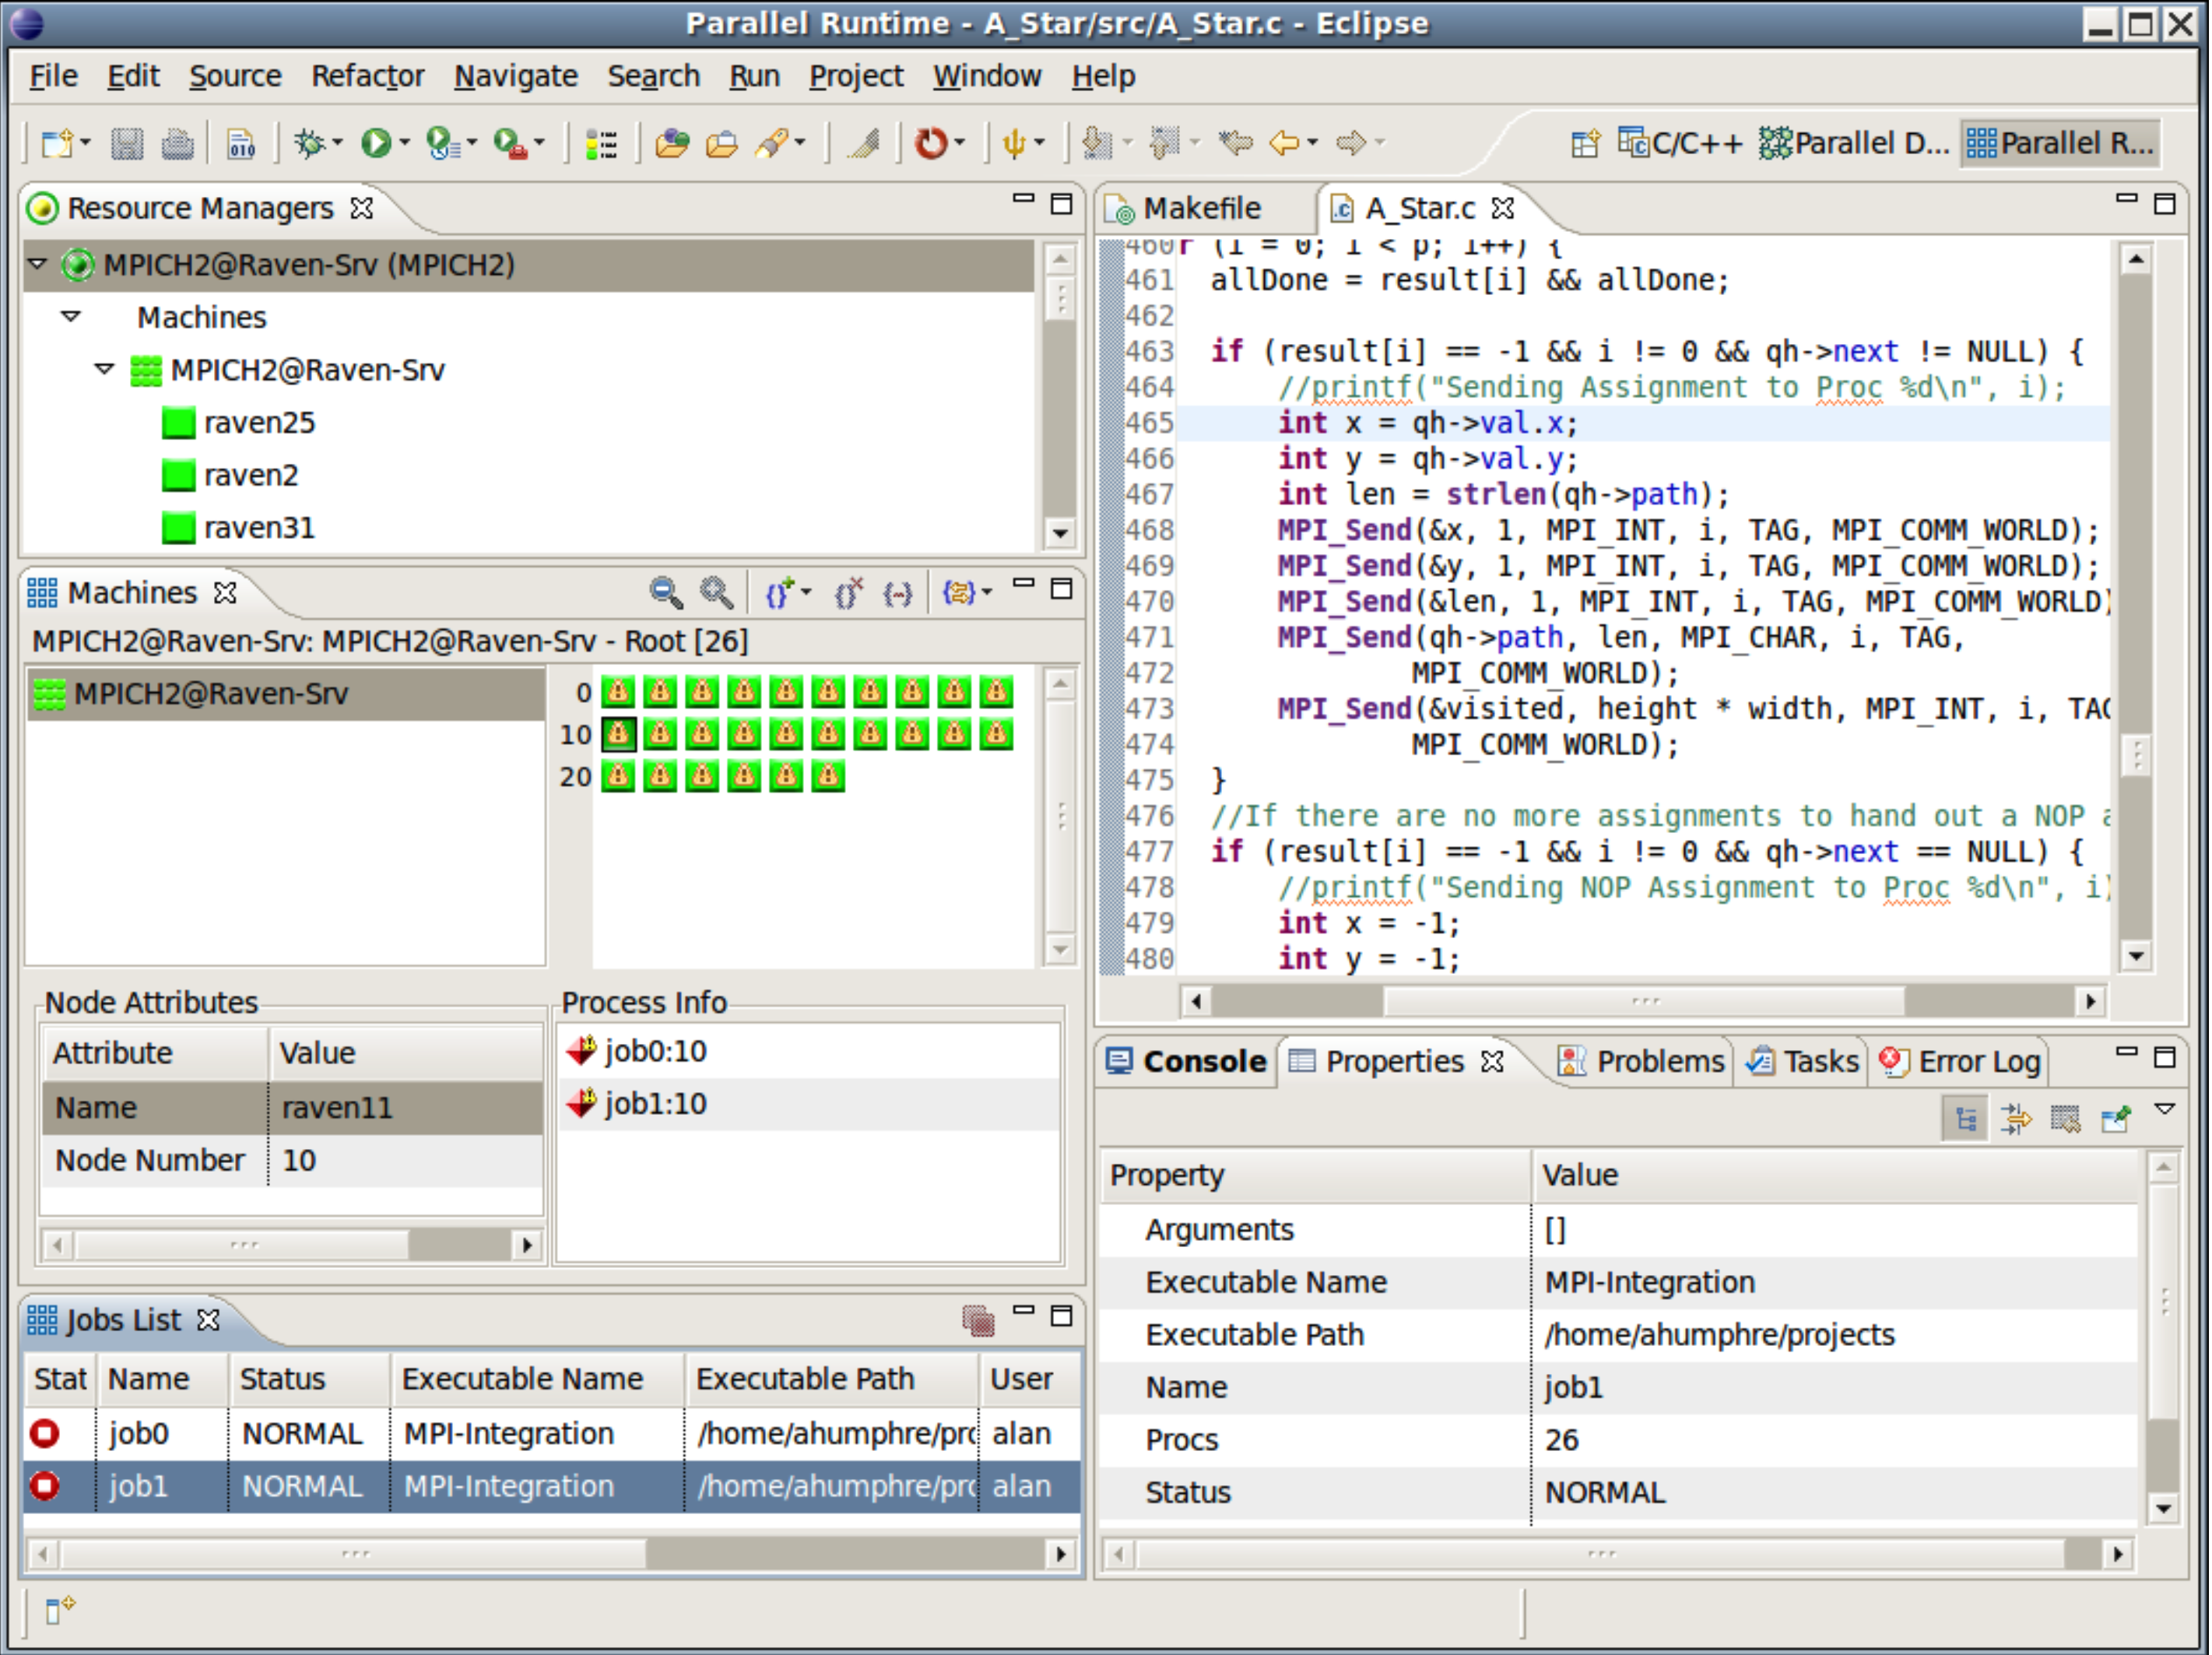
Three visualization tools support debugging tasks based on the visualization of program behavior. Dyvise [43] supports the detection of memory problems through the visualization of the Java heap. GEM [44] (shown in Figure 4) is a graphical explorer of MPI programs. Gzoltar [45] has shown evidence of effectiveness through an experiment. More recently, SwarmDebugging [46] is an Eclipse plug-in that aims to reuse the knowledge of previous debugging sessions to recommend locations in the code to define breakpoints.
Four visualization tools support various aspects of teaching computer science courses. PlanAni [47] is a program animation system based on the concept of the roles of variables for teaching programming. ALVIS [48] enables algorithm visualization to learning programming. jGrasp [49] is an integrated development environment with visualizations for teaching Java. Jsvee and Kelmu [50] are visualization libraries to help instructors teach aspects of the runtime of a program.
Other visualization tools deal with various particular concerns. LTSView [51] is the oldest one, and it is still being maintained. It supports the visualization of transition systems that model the behavior of a software. SIFEI [52] and xViZiT [53] focus on the visualization of spreadsheets, whereas regVis [54] deals with the visualization of assembler control-flow based on regular expressions. Method Execution Reports [55] embed word-size graphics in reports of method executions. Kayrebt [56] provides support for activity diagram extraction and a visualization toolset designed for the Linux codebase.
All the twenty-eight listed tools that focus on the behavior of software systems are displayed on the standard computer screen.
IV-A2 Structure
Various other visualization tools focus on particular concerns. MetaVis [17] can be used to visualize annotated software visualization example objects. OrionPlanning [57] includes visualization for modularization and consistency of software projects. Explen [58] supports the visualization of large metamodels. iTraceVis [59] has shown evidence of being effective to investigate how developers read code through the visualization of their eye gazes. Spartan Refactoring allows automatic code refactoring in the editor. Visuocode [60] supports the navigation and composition of software systems.
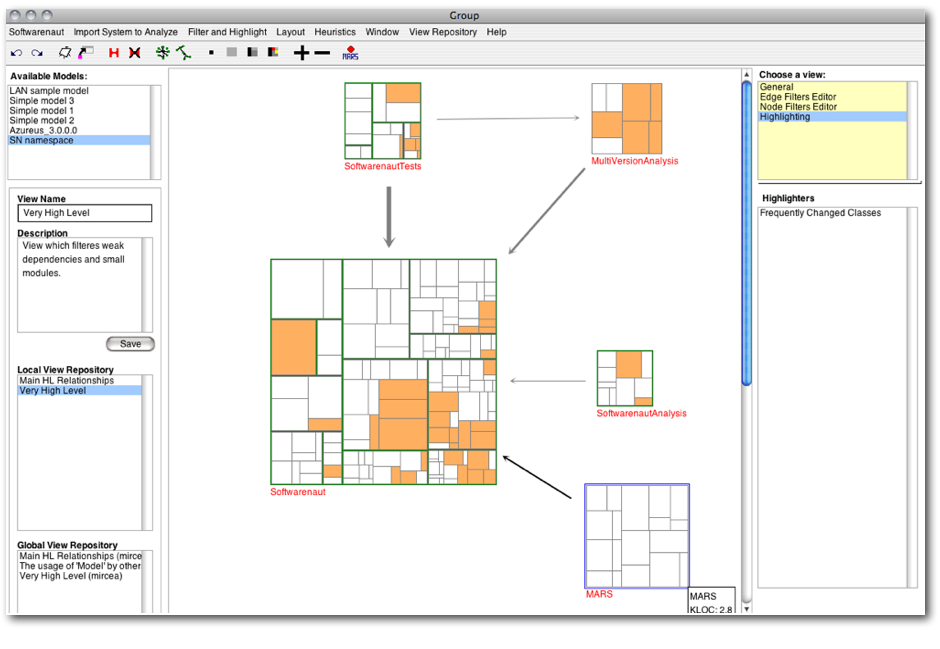
Some visualization tools are available for supporting architecture tasks such as SeeIT3D [61] and VisMOOS [62]. SolidFX [63], Softwarenaut [64] (shown in Figure 5), Rigi [65], and Barrio [66] are suitable for the analysis of structures and dependencies in object-oriented software systems, AspectMaps [67] supports aspect-oriented programs, and Variability blueprint [68] does so for feature-oriented programs.
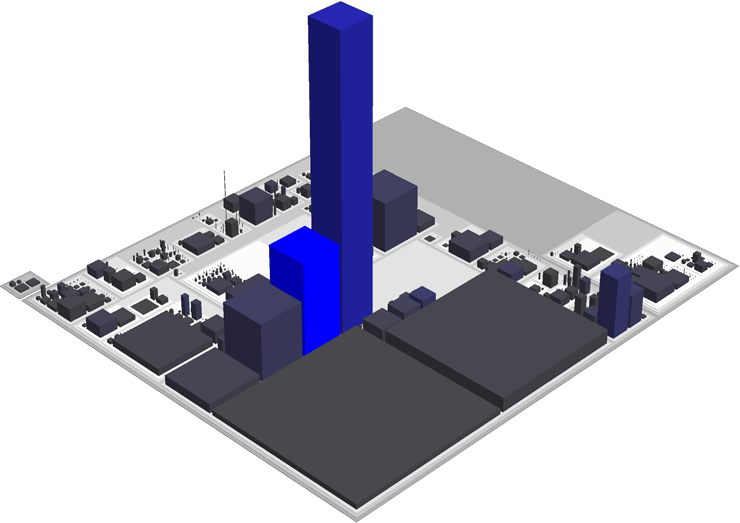
Three tools support the visualization of software systems quality based on the analysis of code smells. CodeCity [69] (shown in Figure 6) and CodeMetropolis [70] visualize software metrics based on the city metaphor. StenchBlossom [71] augments the Eclipse source code editor with ambient visualizations. SolidSDD [72] supports visual clone analysis. Explora [73] is a visualization tool for software quality based on the analysis of metrics.
Twenty of the listed tools that focus on the structure of software systems are displayed using the standard computer screen. Only three use immersive virtual reality: PhysVis [76], in which users visualize software metrics shown as a physical particle system, ExplorViz [77], in which developers obtain an overview of the architecture of a system represented as a city, and CityVR [78], which adds interactions and visualization of software metrics and smells.
IV-A3 Evolution
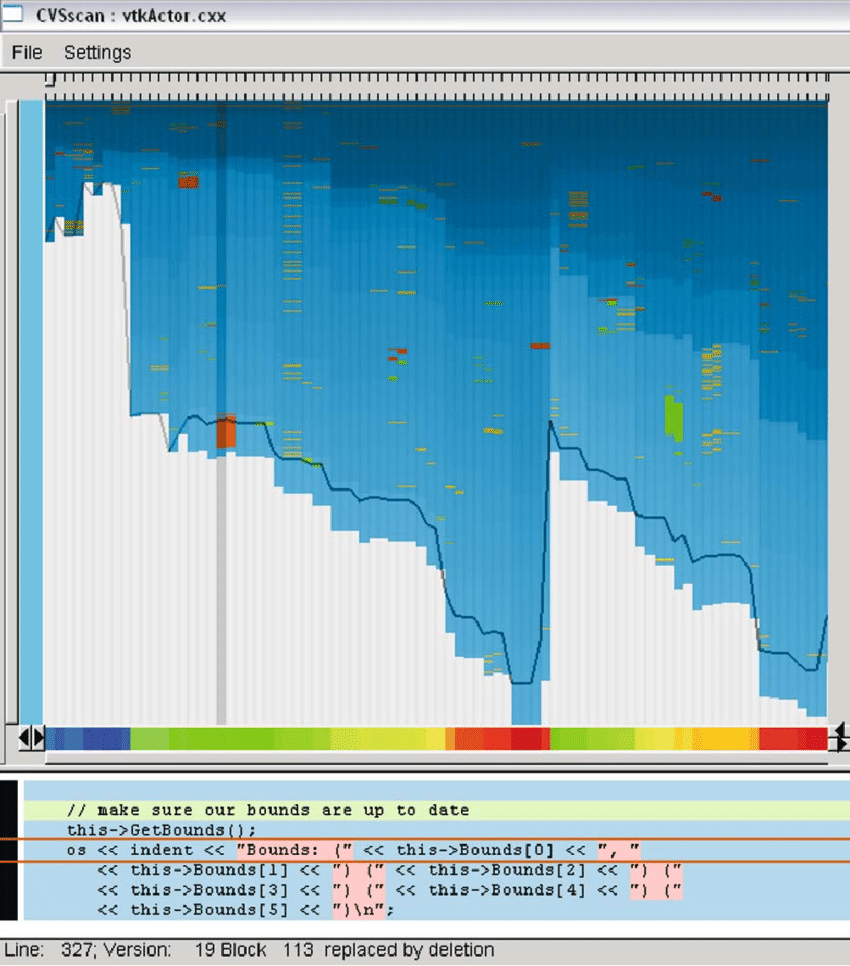
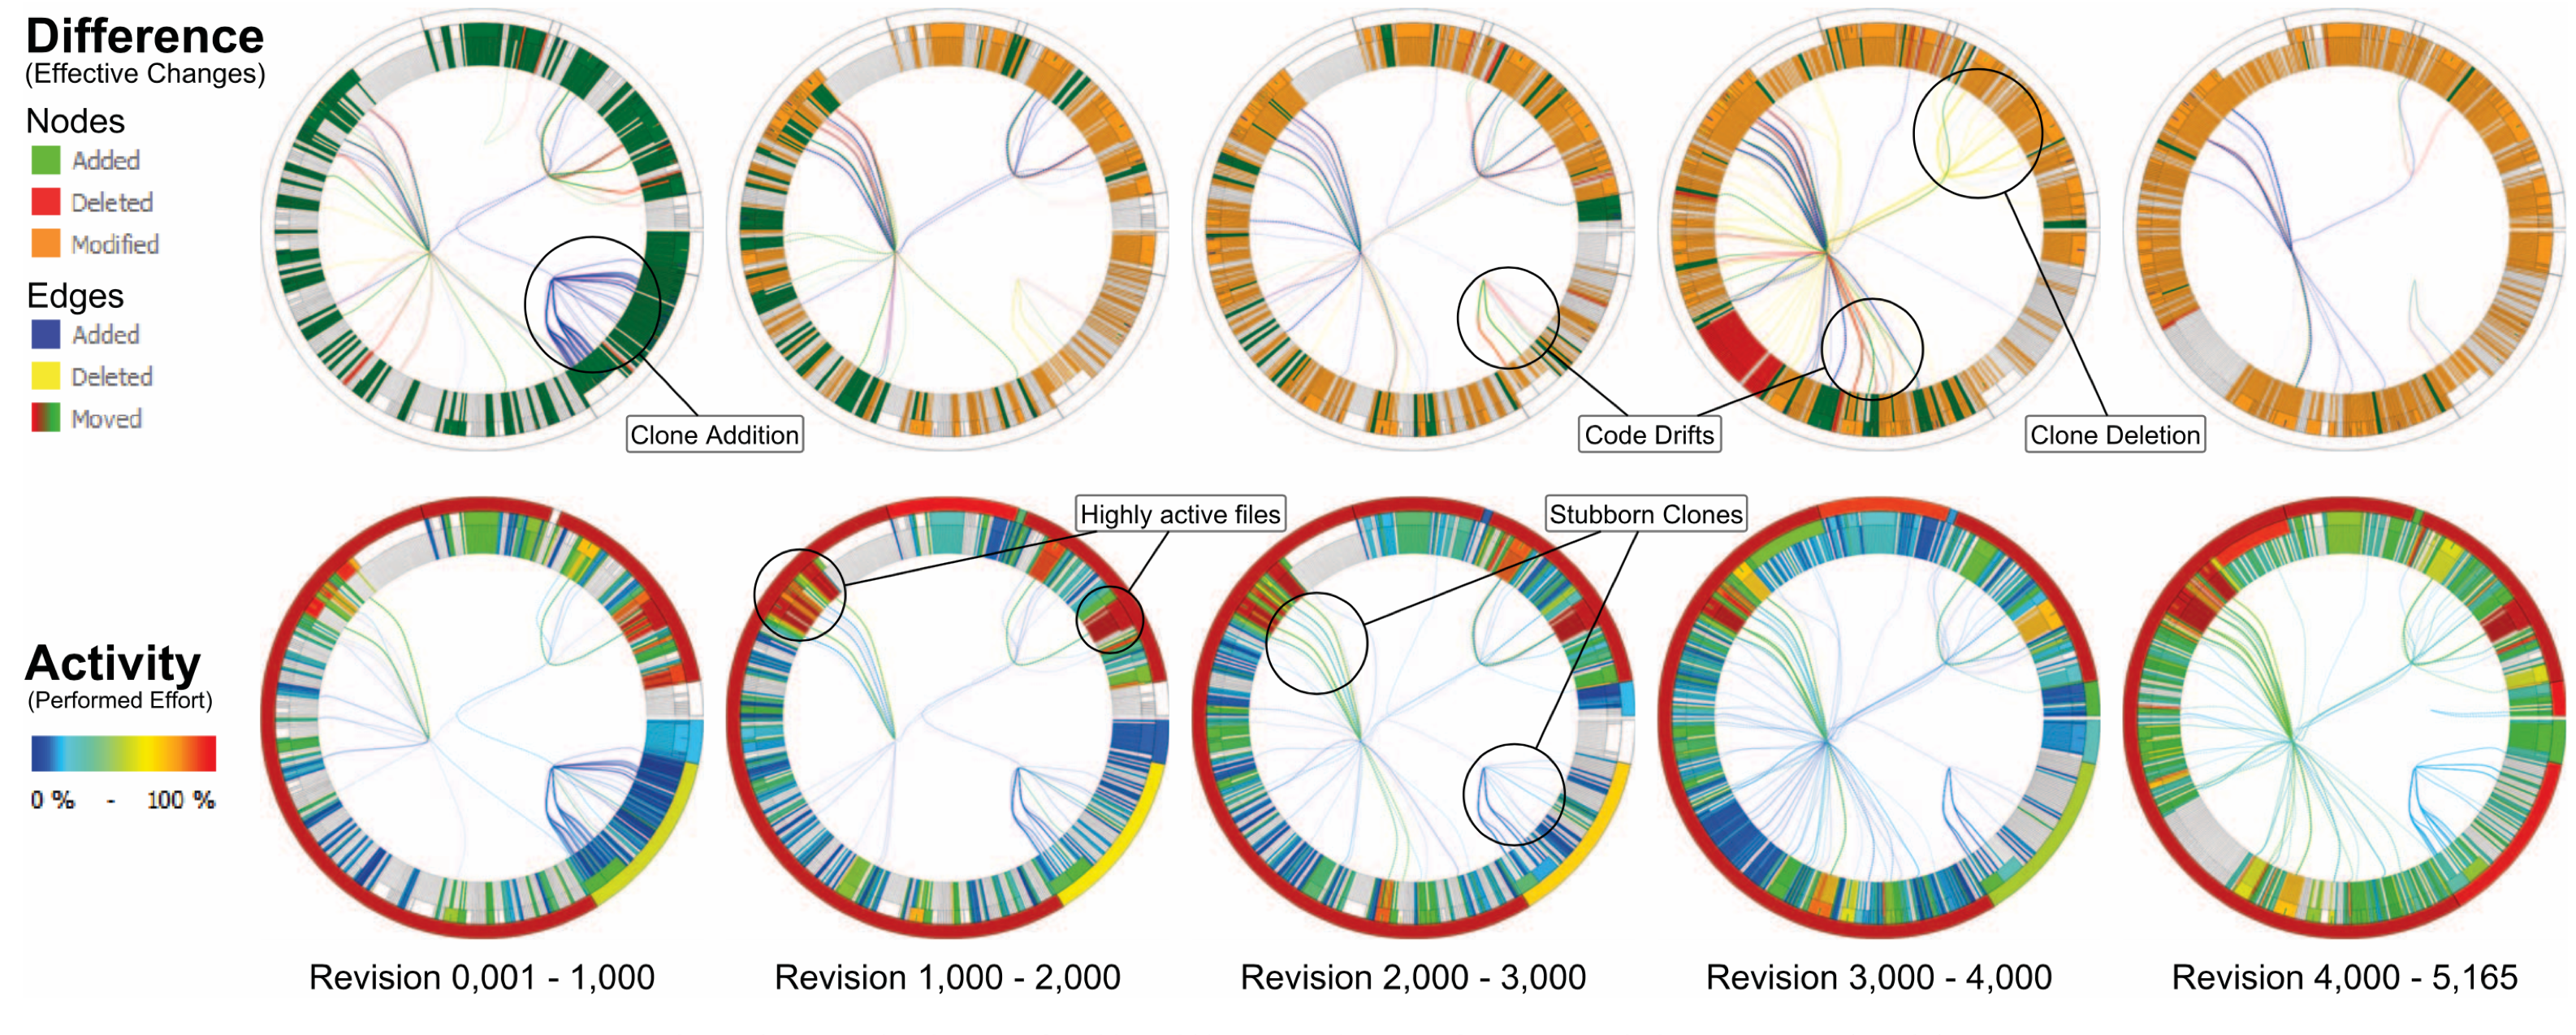
A few tools support the visualization of the evolution of hierarchical structures in object-oriented programs such as AGG [79]. SHriMP [80] is the oldest one and has been maintained for twelve years. MetricView [81] presents a UML class diagram in 3D that is augmented with software metrics. Others deal with various concerns. CVSgrab [82] supports the visualization of the evolution of interactions of developers during debugging, whereas Visual Code Navigator [83] and CVSscan [84] (shown in Figure 7) focus on source code changes. DEVis [85] is used to visualize the evolution of technical documents. Object Evolution Blueprint [86] deals with the evolution of object mutations. Flask dashboard [87] supports the visualization of the performance evolution over versions of Web services implemented using the Flask framework for Python. TypeV [88] allows one to analyze the evolution of a system through the visualization of abstract syntax trees. ClonEvol [89] (shown in Figure 8) visualizes the evolution of code clones to improve the quality of systems. Software Evolution Storylines [90] supports the visualization of the interactions between developers during software project evolution.
All the twelve listed tools that focus on the evolution of software systems are displayed on the standard computer screen.
IV-A4 Behavior/Evolution/Structure
Eight approaches correspond to frameworks that can be used to visualize multiple aspects of software systems. Four of them correspond to active projects introduced several years ago. Mondrian [92] is an engine for rapid lightweight visualization, which is currently supported in the Roassal engine [93]. CodeBubbles [94] is an environment that encapsulates code snippets into bubbles that can be reused through composition. Vizz3D [95] is a framework for online configuration of 3D information visualizations that was originally available for Eclipse, and later made available for Visual Studio. CHIVE [96] is a framework for developing, in particular, 3D software visualizations.
GEF3D [97] is a framework for developing 2D/2.5D/3D graphical editors. Graph [98] is a domain-specific language for visualizing software dependencies as a graph (shown in Figure 9). Getaviz [99] and SpiderSense [100] enable the design, implementation, and evaluation of software visualizations.
The framework Getaviz supports visualizations displayed in immersive virtual reality, whereas the seven other frameworks are limited to the standard computer screen.
The characterization presented in Table I contains only part of the content of our data set described in previous publications [6, 7]. Various other characteristics of software visualizations can help developers willing to adopt visualization to find a suitable approach. We believe that an ontology can be suitable to implement such richer model.
IV-B Implementation Details
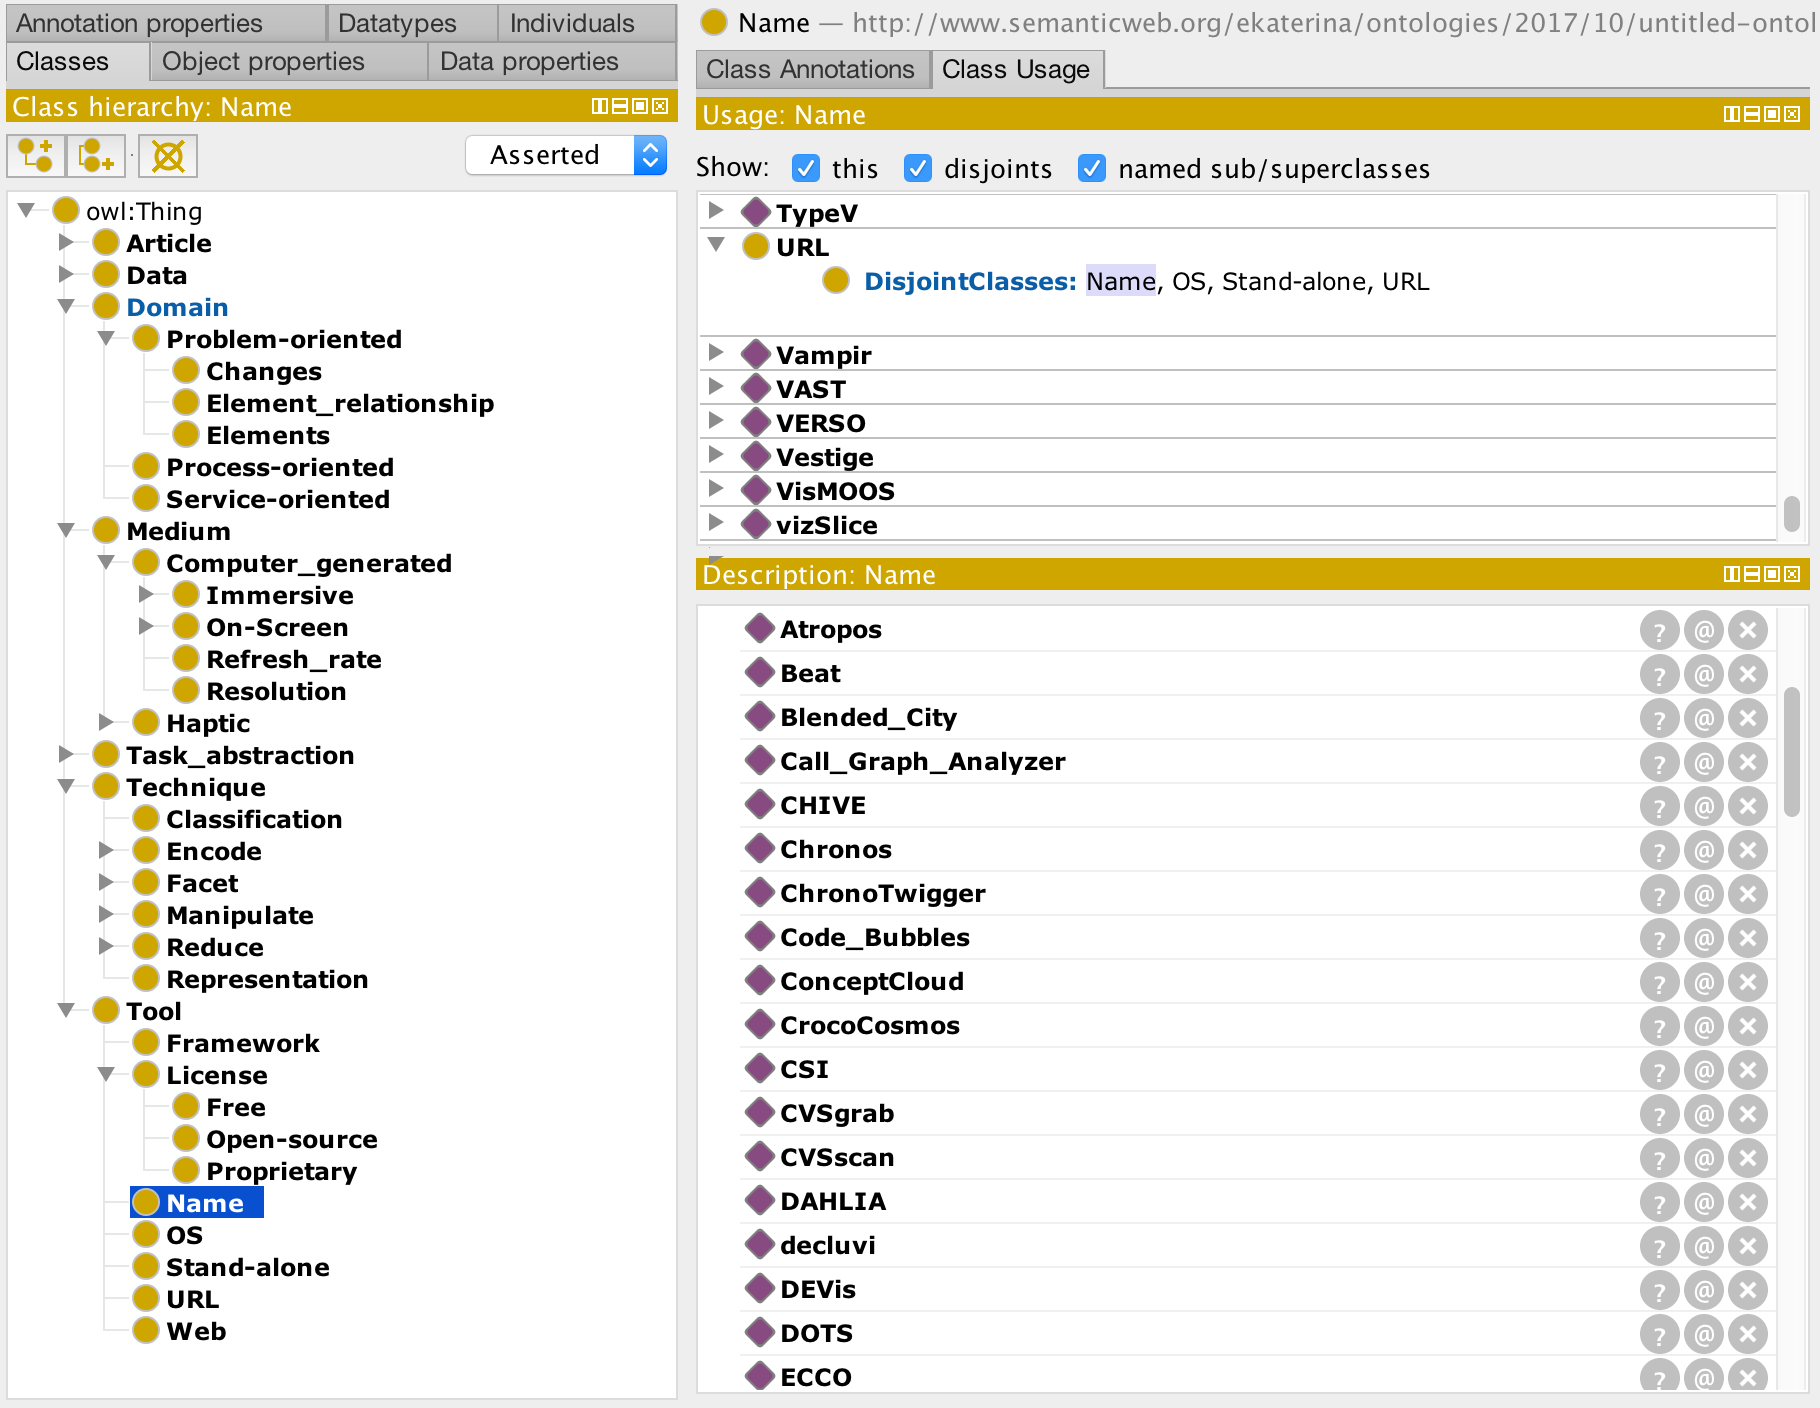
We implement our ontology using Protégé [102], a popular, free, and open-source framework for the design and use of ontologies. In it, we define the concepts (in the tool called classes), properties, restrictions, and instances. Figure 10 shows the classes view in Protégé with a detail of the hierarchy of concepts. As the concept, we selected the name of the tools, which are listed in the right pane.
Figure 2 shows an overview of our implementation of the concepts hierarchy using the OntoGraf visualization plug-in included in Protégé.
| Property | Metric | Value |
| Metrics | Axiom | 3,290 |
| Logical axiom count | 2,428 | |
| Declaration axiom count | 862 | |
| Class count | 150 | |
| Individual property count | 20 | |
| Class axioms | SubClassOf | 143 |
| DisjointClasses | 32 | |
| Object property axioms | SubObjectPropertyOf | 1 |
| ObjectPropertyDomain | 2 | |
| ObjectPropertyRange | 3 | |
| Individual axioms | ClassAssertion | 696 |
| ObjectPropertyAssertion | 1,547 | |
| NegativeObjectPropertyAssertion | 4 |
We present the list of metrics available in the Ontology metrics view of Protégé in Table II. Although we are aware that many more individuals and relationships must be added to the ontology to increase its usability, we observe that our current implementation is not small according to a survey of ontology metrics [103] that reported that ontologies on average contain 36.11 classes (standard deviation of 78.53) and 28.13 instances (standard deviation of 97.59).
V Usage Scenarios
We now demonstrate the ontology through two usage scenarios.
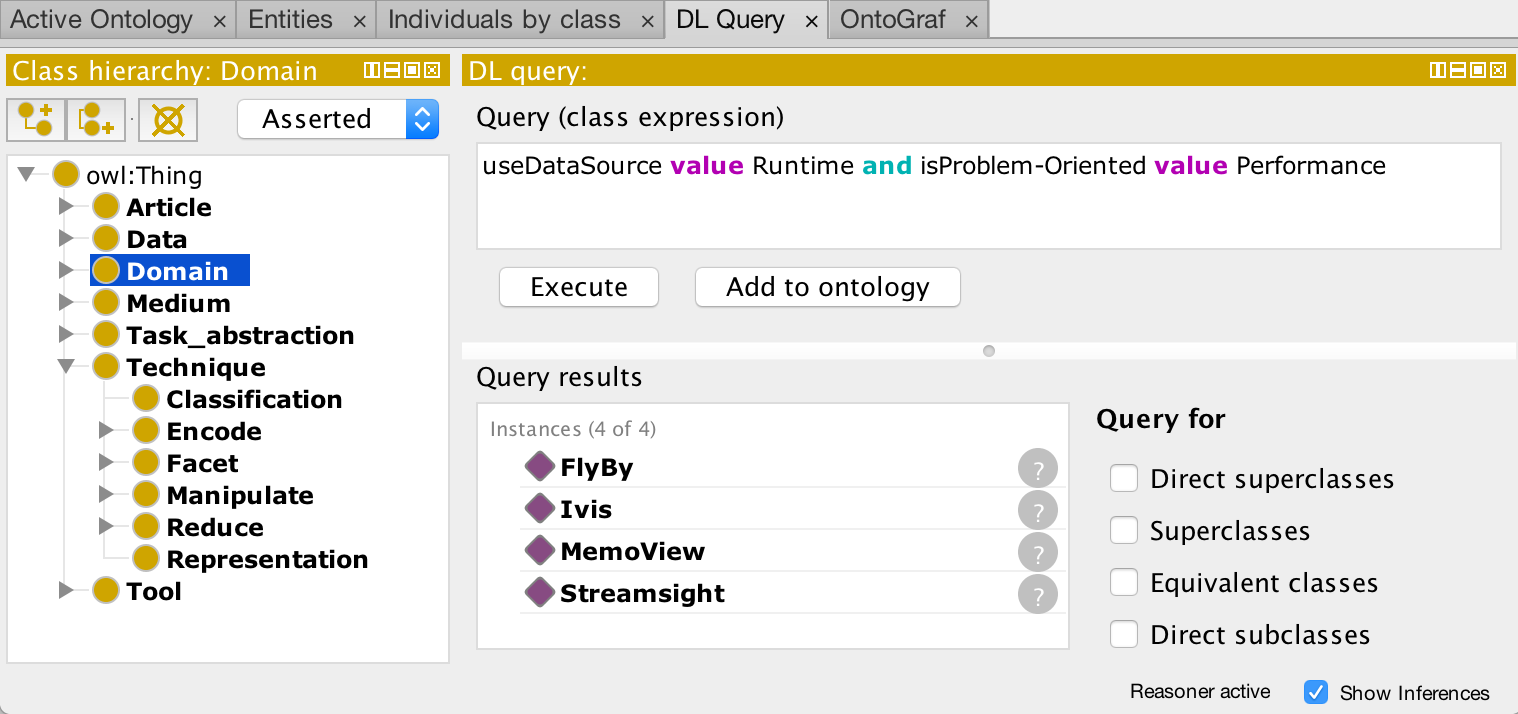
Scenario 1. Find suitable visualization tools that support the analysis of performance issues at runtime.
Two concepts are defined in the specification of this need: (1) the source of the data is the runtime and (2) the problem dealt is the performance of the software system. We translate this specification to the syntax specified by the Ontology Web Language (OWL). Figure 11 shows the resulting query and the suitable tools returned.
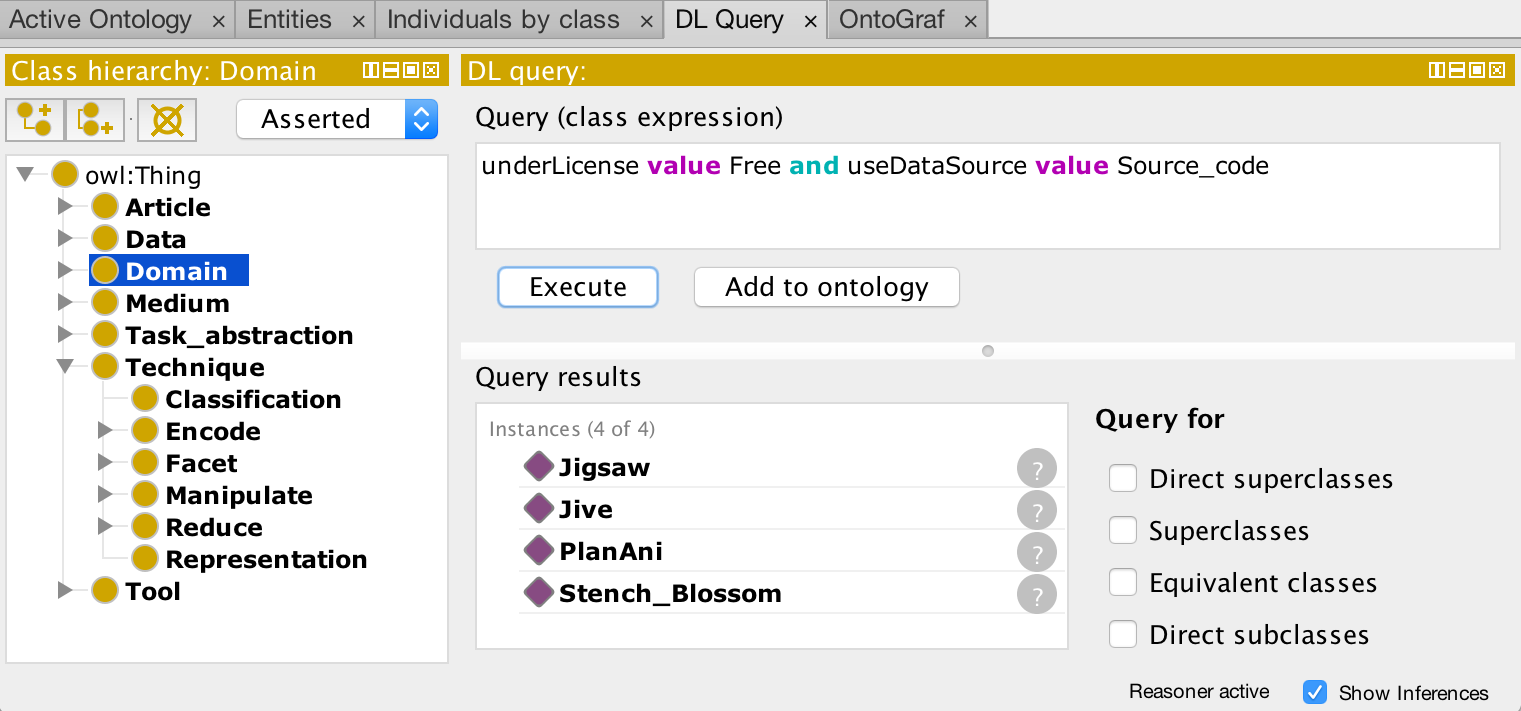
Scenario 2. Find visualization tools under a free license that support the analysis of source code.
Similarly, the specification of this need defines two concepts: (1) the license of the tool has to be free and (2) the source of the data must be the source code of the software system. Figure 12 shows the translated specification of the need in the OWL syntax and the suitable tools returned.
Threats to Validity
In our paper selection process, we might have overlooked papers from relevant venues that describe important software visualization tools. We mitigated this bias by selecting papers published in the two most frequently cited venues dedicated to software visualization: SOFTVIS and VISSOFT. We selected software visualization papers published between 2002 to 2018 in SOFTVIS and VISSOFT. The excluded papers from other venues or published before 2002 may affect the generalizability of our results. We mitigated bias in the data collection procedure (which could obstruct reproducibility of our investigation) by establishing a protocol to extract the data of each paper equally, and by maintaining a spreadsheet to keep records, normalize terms, and identify anomalies.
VI Conclusion
Although many software visualization approaches have been proposed to deal with various software concerns, usually developers are not aware of tools they can put into action. In this paper, we presented our attempts to fill the gap between existing software visualizations and their practical applications: (1) We presented a curated catalog of 70 available software visualization tools that we linked to their repositories; we classified the tools into various categories (e.g., task, data, environment) to help developers who look for suitable visualizations. (2) We summarized our results in developing VISON, our software visualization ontology.
The ontology offers a rich model to encapsulate the various characteristics of software visualizations. We reported on our experience designing and implementing our ontology of software visualizations in the Protégé tool. We demonstrated how the ontology can be used through usage scenarios. Our ontology is publicly available [10]. We expect the ontology will help developers find suitable software visualizations and researchers to reflect on the field. Users of the ontology will be able to contribute, for instance, by adding characteristics of new visualizations, or by adding the results of evaluations of existing visualizations. In the future, we plan to combine our previous work on meta-visualization [17] with VISON.
Acknowledgments
Merino and Weiskopf acknowledge funding by the Deutsche Forschungsgemeinschaft (DFG, German Research Foundation) – Project-ID 251654672 – TRR 161. Nierstrasz thanks the Swiss National Science Foundation for its financial support of “Agile Software Assistance” (project 181973). The authors thank Craig Anslow and Mircea Lungu for valuable comments on a previous version of the paper.
References
- [1] J. Sillito, G. C. Murphy, and K. De Volder, “Questions programmers ask during software evolution tasks,” in Proceedings of FSE. ACM, 2006, pp. 23–34.
- [2] A. J. Ko, R. DeLine, and G. Venolia, “Information needs in collocated software development teams,” in Proceedings of ICSE. IEEE Computer Society, 2007, pp. 344–353.
- [3] T. Fritz and G. C. Murphy, “Using information fragments to answer the questions developers ask,” in Proceedings of ICSE. ACM, 2010, pp. 175–184.
- [4] T. D. LaToza and B. A. Myers, “Hard-to-answer questions about code,” in Proceeedings of PLATEAU. ACM, 2010, pp. 8:1–8:6.
- [5] L. Merino, M. Ghafari, and O. Nierstrasz, “Towards actionable visualisation in software development,” in Proceedings of VISSOFT. IEEE, 2016.
- [6] ——, “Towards actionable visualization for software developers,” Journal of Software: Evolution and Process, vol. 30, no. 2, p. e1923, 2017.
- [7] L. Merino, M. Ghafari, C. Anslow, and O. Nierstrasz, “A systematic literature review of software visualization evaluation,” Journal of Systems and Software, vol. 144, pp. 165–180, 2018.
- [8] L. Merino, A. Bergel, and O. Nierstrasz, “Overcoming issues of 3D software visualization through immersive augmented reality,” in Proceedings of VISSOFT. IEEE, 2018, pp. 54–64.
- [9] T. R. Gruber, “Toward principles for the design of ontologies used for knowledge sharing?” International Journal of Human-Computer Studies, vol. 43, no. 5-6, pp. 907–928, 1995.
- [10] L. Merino, E. Kozlova, O. Nierstrasz, and D. Weiskopf, “Artifact: VISON: An Ontology-Based Approach for Software Visualization Tool Discoverability,” Jul. 2019. [Online]. Available: https://doi.org/10.5281/zenodo.3268626
- [11] S. Hassaine, K. Dhambri, H. Sahraoui, and P. Poulin, “Generating visualization-based analysis scenarios from maintenance task descriptions,” in Proceedings of VISSOFT. IEEE, 2009, pp. 41–44.
- [12] A. Sfayhi and H. Sahraoui, “What you see is what you asked for: An effort-based transformation of code analysis tasks into interactive visualization scenarios,” in Proceedings of SCAM. IEEE, 2011, pp. 195–203.
- [13] L. Grammel, M. Tory, and M.-A. Storey, “How information visualization novices construct visualizations,” Transactions on Visualization and Computer Graphics, vol. 16, no. 6, pp. 943–952, 2010.
- [14] K. Gallagher, A. Hatch, and M. Munro, “A framework for software architecture visualization assessment,” in Proceedings of VISSOFT. IEEE Computer Society, 2005, pp. 76–81.
- [15] J. Paredes, C. Anslow, and F. Maurer, “Information visualization for agile software development,” in Proceedings of VISSOFT. IEEE, 2014, pp. 157–166.
- [16] M. Shahin, P. Liang, and M. A. Babar, “A systematic review of software architecture visualization techniques,” Journal of Systems and Software, vol. 94, pp. 161–185, 2014.
- [17] L. Merino, M. Ghafari, O. Nierstrasz, A. Bergel, and J. Kubelka, “MetaVis: Exploring actionable visualization,” in Proceedings of VISSOFT. IEEE, 2016, pp. 151–155.
- [18] M.-A. D. Storey, D. Čubranić, and D. M. German, “On the use of visualization to support awareness of human activities in software development: a survey and a framework,” in Proceedings of SOFTVIS. ACM, 2005, pp. 193–202.
- [19] M. Sensalire, P. Ogao, and A. Telea, “Classifying desirable features of software visualization tools for corrective maintenance,” in Proceedings of SOFTVIS. ACM, 2008, pp. 87–90.
- [20] ——, “Evaluation of software visualization tools: Lessons learned,” in Proceedings of VISSOFT. IEEE, 2009, pp. 19–26.
- [21] B. Myers, D. Giuse, R. Dannenberg, B. Vander Zanden, D. Kosbie, E. Pervin, A. Mickish, and P. Marchal, “Garnet: Comprehensive support for graphical highly-interactive user interfaces,” IEEE Computer, vol. 23, no. 11, pp. 71–85, 1990.
- [22] B. A. Price, R. M. Baecker, and I. S. Small, “A principled taxonomy of software visualization,” Journal of Visual Languages and Computing, vol. 4, no. 3, pp. 211–266, 1993.
- [23] J. I. Maletic, A. Marcus, and M. Collard, “A task oriented view of software visualization,” in Proceedings of VISSOFT. IEEE, 2002, pp. 32–40.
- [24] M. Schots and C. Werner, “Using a task-oriented framework to characterize visualization approaches,” in Proceedings of VISSOFT. IEEE, 2014, pp. 70–74.
- [25] N. F. Noy, D. L. McGuinness et al., “Ontology development 101: A guide to creating your first ontology,” 2001, Stanford Knowledge Systems Laboratory Technical Report KSL-01-05 and Stanford Medical Informatics Technical Report SMI-2001-0880.
- [26] S. Diehl, Software Visualization. Berlin Heidelberg: Springer-Verlag, 2007.
- [27] K. Kahn, “Time travelling animated program executions,” in Proceedings of SOFTVIS. ACM, 2006, pp. 185–186.
- [28] J. Maloney, L. Burd, Y. Kafai, N. Rusk, B. Silverman, and M. Resnick, “Scratch: A sneak preview,” in Proceedings of C5. IEEE Computer Society, 2004, pp. 104–109.
- [29] M. Homer and J. Noble, “A tile-based editor for a textual programming language,” in Proceedings of VISSOFT. IEEE, 2013, pp. 1–4.
- [30] D. Wendlandt, M. Casado, P. Tarjan, and N. McKeown, “The clack graphical router: visualizing network software,” in Proceedings of SOFTVIS. ACM, 2006, pp. 7–15.
- [31] D. Medani, G. Haggard, C. Bassett, P. Koch, N. Lampert, T. Medlock, S. Pierce, R. Smith, and A. Yehl, “Graph works-pilot graph theory visualization tool,” in Proceedings of SOFTVIS. ACM, 2010, pp. 205–206.
- [32] B. Jayaraman, “JIVE,” Jul. 2019. [Online]. Available: https://cse.buffalo.edu/jive/images/home/JIVE-UI.png
- [33] P. Gestwicki and B. Jayaraman, “Methodology and architecture of jive,” in Proceedings of SOFTVIS. ACM, 2005, pp. 95–104.
- [34] S. Lin, F. Taïani, T. C. Ormerod, and L. J. Ball, “Towards anomaly comprehension: using structural compression to navigate profiling call-trees,” in Proceedings of SOFTVIS. ACM, 2010, pp. 103–112.
- [35] S. P. Reiss, “The paradox of software visualization,” in Proceedings of VISSOFT. IEEE, 2005, pp. 59–63.
- [36] ——, “Visualizing program execution using user abstractions,” in Proceedings of SOFTVIS. ACM, 2006, pp. 125–134.
- [37] ——, “Visualizing Java in action,” in Proceedings of SOFTVIS. ACM, 2003, pp. 57–66.
- [38] P. Deelen, F. van Ham, C. Huizing, and H. van de Watering, “Visualization of dynamic program aspects,” in Proceedings of VISSOFT, 2007, pp. 39–46.
- [39] Q. Wang, W. Wang, R. Brown, K. Driesen, B. Dufour, L. Hendfren, and C. Verbrugge, “EVolve: an open extensible software visualization framework,” in Proceedings of ACM, 2003, pp. 37–49.
- [40] P. Johnson and S. Marsland, “Beat: a tool for visualizing the execution of object orientated concurrent programs,” in Proceedings of SOFTVIS. ACM, 2010, pp. 225–226.
- [41] J. Waller, C. Wulf, F. Fittkau, P. Döhring, and W. Hasselbring, “SynchroVis: 3D visualization of monitoring traces in the city metaphor for analyzing concurrency,” in Proceedings of VISSOFT. IEEE, 2013, pp. 1–4.
- [42] V. K. Palepu and J. A. Jones, “Revealing runtime features and constituent behaviors within software,” in Proceedings of VISSOFT. IEEE, 2015, pp. 86–95.
- [43] S. P. Reiss, “Visualizing the Java heap to detect memory problems,” in Proceedings of VISSOFT. IEEE, 2009, pp. 73–80.
- [44] A. Humphrey, C. Derrick, G. Gopalakrishnan, and B. Tibbitts, “Gem: Graphical explorer of MPI programs,” in Proceedings of ICPP. IEEE, 2010, pp. 161–168.
- [45] C. Gouveia, J. Campos, and R. Abreu, “Using HTML5 visualizations in software fault localization,” in Proceedings of VISSOFT. IEEE, 2013, pp. 1–10.
- [46] F. Petrillo, G. Lacerda, M. Pimenta, and C. Freitas, “Visualizing interactive and shared debugging sessions,” in Proceedings of VISSOFT. IEEE, 2015, pp. 140–144.
- [47] J. Sajaniemi and M. Kuittinen, “Program animation based on the roles of variables,” in Proceedings of SOFTVIS. ACM, 2003, pp. 7–16.
- [48] C. D. Hundhausen, J. L. Brown, and S. Farley, “Adding procedures and pointers to the ALVIS algorithm visualization software: a preliminary design,” in Proceedings of SOFTVIS. ACM, 2006, pp. 155–156.
- [49] J. H. Cross II and T. D. Hendrix, “jGRASP: an integrated development environment with visualizations for teaching Java in CS1, CS2, and beyond,” Journal of Computing Sciences in Colleges, vol. 23, no. 2, pp. 170–172, 2007.
- [50] T. Sirkiä, “Jsvee & Kelmu: Creating and tailoring program animations for computing education,” Journal of Software: Evolution and Process, vol. 30, no. 2, p. e1924, 2018.
- [51] B. Ploeger and C. Tankink, “Improving an interactive visualization of transition systems,” in Proceedings of SOFTVIS. ACM, 2008, pp. 115–124.
- [52] D. Kulesz, J. Scheurich, and F. Beck, “Integrating anomaly diagnosis techniques into spreadsheet environments,” in Proceedings of VISSOFT. IEEE, 2014, pp. 11–19.
- [53] K. Hodnigg and M. Pinzger, “XVIZIT: Visualizing cognitive units in spreadsheets,” in Proceedings of VISSOFT. IEEE, 2015, pp. 210–214.
- [54] S. Toprak, A. Wichmann, and S. Schupp, “Lightweight structured visualization of assembler control flow based on regular expressions,” in Proceedings of VISSOFT. IEEE, 2014, pp. 97–106.
- [55] F. Beck, H. A. Siddiqui, A. Bergel, and D. Weiskopf, “Method execution reports: Generating text and visualization to describe program behavior,” in Proceedings of VISSOFT. IEEE, 2017, pp. 1–10.
- [56] L. Georget, F. Tronel, and V. V. T. Tong, “Kayrebt: An activity diagram extraction and visualization toolset designed for the Linux codebase,” in Proceedings of VISSOFT. IEEE, 2015, pp. 170–174.
- [57] G. Santos, N. Anquetil, A. Etien, S. Ducasse, and M. T. Valente, “OrionPlanning: Improving modularization and checking consistency on software architecture,” in Proceedings of VISSOFT. IEEE, 2015, pp. 190–194.
- [58] A. Blouin, N. Moha, B. Baudry, and H. Sahraoui, “Slicing-based techniques for visualizing large metamodels,” in Proceedings of VISSOFT. IEEE, 2014, pp. 25–29.
- [59] B. Clark and B. Sharif, “iTraceVis: Visualizing eye movement data within Eclipse,” in Proceedings of VISSOFT. IEEE, 2017, pp. 22–32.
- [60] D. R. Bradley and I. J. Hayes, “Visuocode: A software development environment that supports spatial navigation and composition.” in Proceedings of VISSOFT. IEEE, 2013, pp. 1–4.
- [61] B. Sharif, G. Jetty, J. Aponte, and E. Parra, “An empirical study assessing the effect of SeeIT 3D on comprehension,” in Proceedings of VISSOFT. IEEE, 2013, pp. 1–10.
- [62] A. Fronk, A. Bruckhoff, and M. Kern, “3D visualisation of code structures in Java software systems,” in Proceedings of SOFTVIS. ACM, 2006, pp. 145–146.
- [63] A. Telea and D. Auber, “Code flows: Visualizing structural evolution of source code,” Computer Graphic Forum, vol. 27, no. 3, pp. 831–838, 2008.
- [64] M. Lungu, M. Lanza, and T. Gîrba, “Package patterns for visual architecture recovery,” in Proceedings of CSMR. IEEE, 2006, pp. 185–196.
- [65] H. M. Kienle and H. A. Muller, “Requirements of software visualization tools: A literature survey,” in Proceedings of VISSOFT. IEEE Computer Society, 2007, pp. 2–9.
- [66] J. Dietrich, V. Yakovlev, C. McCartin, G. Jenson, and M. Duchrow, “Cluster analysis of Java dependency graphs,” in Proceedings of SOFTVIS. ACM, 2008, pp. 91–94.
- [67] J. Fabry and A. Bergel, “Design decisions in AspectMaps,” in Proceedings of VISSOFT. IEEE, 2013, pp. 1–4.
- [68] S. Urli, A. Bergel, M. Blay-Fornarino, P. Collet, and S. Mosser, “A visual support for decomposing complex feature models,” in Proceedings of VISSOFT. IEEE, 2015, pp. 76–85.
- [69] R. Wettel and M. Lanza, “Program comprehension through software habitability,” in Proceedings of ICPC. IEEE, 2007, pp. 231–240.
- [70] G. Balogh and Á. Beszédes, “CodeMetropolis – a Minecraft based collaboration tool for developers,” in Proceedings of VISSOFT. IEEE, 2013, pp. 1–4.
- [71] E. Murphy-Hill and A. P. Black, “An interactive ambient visualization for code smells,” in Proceedings of SOFTVIS. ACM, 2010, pp. 5–14.
- [72] L. Voinea and A. C. Telea, “Visual clone analysis with SolidSDD,” in Proceedings of VISSOFT. IEEE, 2014, pp. 79–82.
- [73] L. Merino, M. Lungu, and O. Nierstrasz, “Explora: A visualisation tool for metric analysis of software corpora,” in Proceedings of VISSOFT. IEEE, 2015, pp. 195–199.
- [74] M. Lungu, “Softwarenaut,” Jul. 2019. [Online]. Available: https://cloud.githubusercontent.com/assets/464519/21022349/9ec2f748-bd7c-11e6-87ad-29c5332caba9.png
- [75] R. Wettel, “CodeCity,” Jul. 2019. [Online]. Available: https://wettel.github.io/pics/wof/jmol.png
- [76] S. Scarle and N. Walkinshaw, “Visualising software as a particle system,” in Proceedings of VISSOFT. IEEE, 2015, pp. 66–75.
- [77] F. Fittkau, J. Waller, C. Wulf, and W. Hasselbring, “Live trace visualization for comprehending large software landscapes: The ExplorViz approach,” in Proceedings of VISSOFT. IEEE, 2013, pp. 1–4.
- [78] L. Merino, M. Ghafari, C. Anslow, and O. Nierstrasz, “CityVR: Gameful software visualization,” in Proceedings of ICSME. IEEE, 2017, pp. 633–637.
- [79] S. Jucknath-John and D. Graf, “Icon graphs: visualizing the evolution of large class models,” in Proceedings of SOFTVIS. ACM, 2006, pp. 167–168.
- [80] R. Lintern, J. Michaud, M.-A. Storey, and X. Wu, “Plugging-in visualization: experiences integrating a visualization tool with Eclipse,” in Proceedings of SOFTVIS. ACM, 2003, pp. 47–56.
- [81] M. Termeer, C. F. Lange, A. Telea, and M. R. Chaudron, “Visual exploration of combined architectural and metric information,” in Proceedings of VISSOFT. IEEE, 2005, pp. 1–6.
- [82] L. Voinea and A. Telea, “How do changes in buggy Mozilla files propagate?” in Proceedings of SOFTVIS, vol. 4, no. 05, 2006, pp. 147–148.
- [83] W. De Pauw, S. Krasikov, and J. F. Morar, “Execution patterns for visualizing web services,” in Proceedings of SOFTVIS. ACM, 2006, pp. 37–45.
- [84] L. Voinea, A. Telea, and J. J. van Wijk, “CVSscan: visualization of code evolution,” in Proceedings of SOFTVIS, 2005, pp. 47–56.
- [85] J. Zhi and G. Ruhe, “DEVis: A tool for visualizing software document evolution,” in Proceedings of VISSOFT. IEEE, 2013, pp. 1–4.
- [86] R. Schulz, F. Beck, J. W. C. Felipez, and A. Bergel, “Visually exploring object mutation,” in Proceedings of VISSOFT. IEEE, 2016, pp. 21–25.
- [87] P. Vogel, T. Klooster, V. Andrikopoulos, and M. Lungu, “A low-effort analytics platform for visualizing evolving Flask-based Python web services,” in Proceedings of VISSOFT. IEEE, 2017, pp. 109–113.
- [88] M. D. Feist, E. A. Santos, I. Watts, and A. Hindle, “Visualizing project evolution through abstract syntax tree analysis,” in Proceedings of VISSOFT. IEEE, 2016, pp. 11–20.
- [89] A. Hanjalić, “ClonEvol: Visualizing software evolution with code clones,” in Proceedings of VISSOFT, 2013, pp. 1–4.
- [90] M. Ogawa and K.-L. Ma, “Software evolution storylines,” in Proceedings of SOFTVIS. ACM, 2010, pp. 35–42.
- [91] A. Telea, “CVSscan,” Jul. 2019. [Online]. Available: https://www.researchgate.net/profile/Stephan_Diehl2/publication/221555679/figure/fig46/AS:669038149640208@1536522533700/CVSScan-evolution-of-a-single-file.png
- [92] M. Meyer, T. Gîrba, and M. Lungu, “Mondrian: An agile visualization framework,” in Proceedings of SOFTVIS. ACM, 2006, pp. 135–144.
- [93] I. Fernandez, A. Bergel, J. P. S. Alcocer, A. Infante, and T. Gîrba, “Glyph-based software component identification,” in Proceedings of ICPC, 2016, pp. 1–10.
- [94] S. P. Reiss, “The challenge of helping the programmer during debugging,” in Proceedings of VISSOFT. IEEE, 2014, pp. 112–116.
- [95] T. Panas, R. Lincke, and W. Löwe, “Online-configuration of software visualization with Vizz3D,” in Proceedings of SOFTVIS, 2005, pp. 173–182.
- [96] B. Cleary, A. Le Gear, C. Exton, and J. Buckley, “A combined software reconnaissance & static analysis Eclipse visualisation plug-in,” in Proceedings of VISSOFT. IEEE, 2005, pp. 1–2.
- [97] J. von Pilgrim and K. Duske, “GEF3D: a framework for two-, two-and-a-half-, and three-dimensional graphical editors,” in Proceedings of SOFTVIS. ACM, 2008, pp. 95–104.
- [98] A. Bergel, S. Maass, S. Ducasse, and T. Gîrba, “A domain-specific language for visualizing software dependencies as a graph,” in Proceedings of VISSOFT, 2014, pp. 45–49.
- [99] D. Baum, J. Schilbach, P. Kovacs, U. Eisenecker, and R. Müller, “GETAVIZ: generating structural, behavioral, and evolutionary views of software systems for empirical evaluation,” in Proceedings of VISSOFT. IEEE, 2017, pp. 114–118.
- [100] N. H. Reddy, J. Kim, V. K. Palepu, and J. A. Jones, “SPIDER SENSE: Software-engineering, networked, system evaluation,” in Proceedings of VISSOFT. IEEE, 2015, pp. 205–209.
- [101] A. Bergel, “GRAPH,” Jul. 2019. [Online]. Available: http://agilevisualization.com/img/circle.png
- [102] M. A. Musen, “The Protégé project: a look back and a look forward,” AI Matters, vol. 1, no. 4, pp. 4–12, 2015.
- [103] M. Sicilia, D. Rodríguez, E. García-Barriocanal, and S. Sánchez-Alonso, “Empirical findings on ontology metrics,” Expert Systems with Applications, vol. 39, no. 8, pp. 6706–6711, 2012.