Quantitative Assessment of the Toner and Tu Theory of Polar Flocks
Abstract
We present a quantitative assessment of the Toner and Tu theory describing the universal scaling of fluctuations in polar phases of dry active matter. Using large scale simulations of the Vicsek model in two and three dimensions, we find the overall phenomenology and generic algebraic scaling predicted by Toner and Tu, but our data on density correlations reveal some qualitative discrepancies. The values of the associated scaling exponents we estimate differ significantly from those conjectured in 1995. In particular, we identify a large crossover scale beyond which flocks are only weakly anisotropic. We discuss the meaning and consequences of these results.
Two seminal papers, both published in this journal in 1995, can be argued to mark the birth of active matter physics. In Vicsek et al. (1995), Vicsek and collaborators introduced their simple model for collective motion, where XY spins fly at constant speed along their magnetic direction. In Toner and Tu (1995), Toner and Tu (TT) wrote down fluctuating hydrodynamic equations for this flying XY model and performed a dynamic renormalization group calculation of its ordered phase, concluding, among other things, that such polar flocks possess true long-range orientational order even in two space dimensions (2D). In other words, flying spins defy the famous Mermin-Wagner theorem Mermin and Wagner (1966). Since then, our knowledge of active matter has expanded tremendously (see, e.g., the various review papers Toner et al. (2005); Ramaswamy (2010); Romanczuk et al. (2012); Vicsek and Zafeiris (2012); Marchetti et al. (2013); Cates and Tailleur (2015); Elgeti et al. (2015); Prost et al. (2015); Bechinger et al. (2016); Ramaswamy (2017); Doostmohammadi et al. (2018); Chaté (2019)). But the TT papers remain influential even though they deal with the limit case of dilute, aligning, dry active matter, which usually consists of self-propelled particles subjected to local alignment in the absence of any surrounding fluid Chaté (2019). In particular, the TT theory (and related works by Ramaswamy et al.) predicted what has become one of the most popular features in active matter studies, the presence, in orientationally-ordered phases, of “giant number fluctuations” where the variance of the number of particles in sub-systems of increasing size scales faster than the mean Ramaswamy et al. (2003); Chaté et al. (2006); Narayan et al. (2007); Chaté et al. (2008); Ginelli et al. (2010); Zhang et al. (2010); Ngo et al. (2014); Giavazzi et al. (2017); Nishiguchi et al. (2017).
Over the years, numerous numerical and experimental works have tried to verify the TT results, but the evidence presented has been restricted to a limited range of scales Tu et al. (1998) and/or isotropic measures averaged over all spatial directions that cannot resolve individual scaling exponents Chaté et al. (2008, 2008); Giavazzi et al. (2017), resulting in exponent values that could only be deemed compatible with the TT predictions. This situation was satisfactory as long as the TT theory was believed, as claimed in the early papers Toner and Tu (1995, 1998), to be ‘exact at all orders’ in 2D, the dimension of choice of most works. However, Toner himself realized in 2012 Toner (2012) that this is not actually true, and that a number of important terms has been overlooked, invalidating most claims of exactness. The remarkable result of true long-range order in 2D remains valid, as well as the overall structure of the theory, but scaling exponent values, and other important features, had to be ‘revisited’. From then on, belief in the TT results became reliant on the partial numerical evidence mentioned above. In spite of this situation, not much further work was devoted to gauge the accuracy of the TT predictions (see however Kyriakopoulos et al. (2016); Geyer et al. (2018)), and a full-fledged, quantitative evaluation of the TT theory is still missing.
In this Letter, we present large-scale numerical simulations of the Vicsek model designed to study the 2D and 3D anisotropic space-time correlations functions at the heart of TT theory. Our results largely confirm its qualitative validity, but our estimates of exponent values clearly differ from the conjectured ones. In particular, we find that anisotropy is weak, possibly vanishing. Moreover, the behavior of density correlations shows qualitative discrepancies with the theory. We discuss their origin, as well as the theoretical consequences of the hyperscaling relations that we find numerically satisfied.
We start with a synthetic account of the TT theory. The hydrodynamic equations written by Toner and Tu govern a conserved density and a velocity field :
| (1a) | ||||
| (1b) | ||||
Here all coefficients can in principle depend on and , the pressure is expressed as a series in the density, and is an additive noise with zero mean and variance delta-correlated in space and time. To obtain the quantities of interest hereafter, i.e. correlation functions of density and transverse velocity fluctuations, Eqs. (1) are linearized around the homogeneous ordered solution: and , with the global density and . (Hereafter subscripts ∥ and ⟂ refer respectively to directions longitudinal and transverse to global order.) After enslaving the fast field , the Fourier-transformed slow fluctuations read, in the small limit Toner (2012):
| (2a) | ||||
| (2b) | ||||
where , , with the angle between global order and , . The definitions of , , , , which are unimportant for the following discussion, can be found in Toner (2012).
Eq. (2a) implies the existence of propagative sound modes, or density waves, whose dispersion relations follow . This endows density fluctuations with two sharp peaks in centered in and of respective widths . The two terms of the rhs of Eq. (2b) correspond respectively to transverse velocity fluctuations parallel and perpendicular to . The first term represents correlations of , which behave like the density fluctuations. The second term denotes the fluctuations of , which exist only for , and yields a third peak centered in , of width .
Since essentially scale as in the small wavenumber limit Toner (2012), the equal-time correlation functions are easily obtained by integrating Eqs. (2) over . The resulting expressions, presented in Toner (2012), imply that when , whose primary consequence is the absence of long-range order in .
However, nonlinearities in Eqs. (1) are relevant perturbations for all Toner (2012). Correlation functions in the nonlinear theory are then given by Eqs. (2) using the renormalized noise variance and sound modes dampings
| (3) |
with , for , and when , while the sound speeds remain those given by the linear theory.
| TT95 | numerics | TT95 | numerics | mean-field | |
|---|---|---|---|---|---|
| 1.60 | |||||
| GNF | |||||
Exponents , and and scaling functions are universal. The roughness exponent rules how the variance of velocity and density fluctuations varies with lengthscales. Fluctuations vanish asymptotically when , insuring long-range polar order. Toner and Tu’s calculations proved that this is true for and , while in linear theory, where , fluctuations diverge and order is destroyed in 2D. The anisotropy exponent measures the difference in scaling along and transversally to global order. TT theory predicts that fluctuations scale anisotropically for () while in mean-field . Finally, the dynamical exponent measures how the lifetime of sound modes scales with system size. At the linear level , which corresponds to a diffusive damping, while is expected for according to TT theory. In their first publications Toner and Tu (1995, 1998), Toner and Tu claimed an exact computation of these exponents in , and found , (see TT95 numbers in Table 1). In his later “reanalysis” of the theory Toner (2012), Toner realized that additional relevant nonlinearities were missed, so that the above exponent values could only be exact, even in , under the conjecture of the asymptotic irrelevance of these terms.
We now turn to our numerical assessment of TT theory. We use the standard discrete-time Vicsek model for efficiency. Particles with position and orientation move at constant speed and align their velocities with current neighbors :
| (4) |
where , is the average over all particles within unit distance of (including ), and are uncorrelated random vectors uniformly distributed on the unit circle(2D)/sphere(3D) 111Here we use this ‘vectorial noise’ version, shown in Grégoire and Chaté (2004) to be less sensitive to finite size effects in the coexistence phase. We also used the more common ‘angular noise’ version, obtaining similar results, see SUP .. Square domains of linear size containing particles, with ranging from a few million to a few billion were considered. For numerical efficiency, small speed and weak noise were avoided. We used , (2D) and (3D) with , parameter values in the homogeneous ordered phase, but not too deep inside. Fluctuation fields and were obtained by coarse-graining over boxes of unit linear length. The associated correlation functions were simply obtained by computing the square norm of the fields’ Fourier transform.
In finite systems with periodic boundary conditions, the direction of order diffuses slowly (the diffusion constant Mahault et al. (2019)). To estimate quantities scaling anisotropically like those defined by Eqs. (2), one then needs, before averaging in time, to rotate a copy of the system at each measure so that global order remains along a chosen direction. Moreover data have then to be averaged over times longer than the timescale of this rotation. This is possible but costly and quickly becomes prohibitive for large systems. Forcing global order to remain along a given direction can be achieved by either applying an external field or by imposing reflecting side boundaries as in, e.g., Kyriakopoulos et al. (2016); Tu et al. (1998); Geyer et al. (2018). This perturbs slightly the global behavior of the system, but allows for much shorter averaging times at equivalent sizes. All three protocols were tested, and we found that when used cautiously they yield identical results over the scales that can be explored by all (see SUP for details). Below, we only present data obtained using a channel with reflective walls.
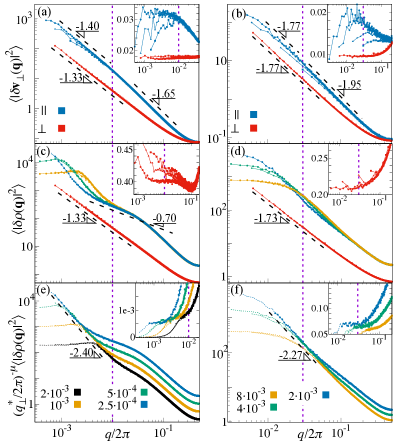
Although we measured correlations in the whole () plane 222In 3D we averaged over all directions of , exponents and can be estimated from just the longitudinal () and transverse () directions. For velocity correlations, we have:
| (5) |
Our data in both 2D and 3D show that scales cleanly at small values of (lower sets of curves in Figs. 1(a,b)), with estimated values of slightly but significantly different than those conjectured by Toner and Tu (see Table 1). Behavior in the longitudinal direction is more surprising (upper set of curves in Figs. 1(a,b)). While from Toner and Tu (1998) a divergence for with an exponent is conjectured in both 2D and 3D, we observe, in 2D, a size-independent crossover from a power law with exponent at intermediate values of to one with a larger exponent at smaller . The crossover scale , indicated by the purple dashed lines in our figures, is of the same order as typical sizes considered so far in other works Tu et al. (1998); Chaté et al. (2008), which may explain why it has never been reported. Note further that our post-crossover estimate is not far from the value measured in the transverse direction, implying weak, possibly vanishing, anisotropy (). In 3D the two correlation functions show approximately the same exponent above a scale : scaling is isotropic (Fig. 1(b)). Overall, our measures lead to values of and in clear departure from those conjectured by Toner and Tu (see Table 1).
The density correlation function is expected to show the following longitudinal and transverse scalings 333 A third intermediate scaling region with is expected for Toner and Tu (1998), but given our estimate both in 2D and 3D, we expect it to be unobservable, at odds with the earlier results of Ref. Tu et al. (1998).
| (6) |
In the transverse direction, our data confirm that scaling takes place with the same exponent as for velocity correlations (Figs. 1(c,d), lower set of curves), albeit with more pronounced finite size effects, especially in 2D (compare insets of Fig. 1(a,b) and Fig. 1(c,d), see SUP for comments).
In 3D, the apparent exponent is slightly lower in absolute value than the one given by ( vs. ), but given the limited range of scaling available we cannot exclude that these two values are in fact the same asymptotically.
The scaling of density fluctuations in the longitudinal direction is more subtle to analyse because it depends explicitly on (see Eq. (6)). The behavior of with for 3 fixed values of is shown in Figs. 1(c,d) (upper sets of curves). One can identify three regimes below the crossover scale , which are most easily distinguished in 2D, but probably also present in 3D. For the smallest values of , the functions reach a plateau, whose range of existence and amplitude respectively increases and decreases with . This behavior corresponds to the “transverse” regime where . Increasing beyond this plateau, shows a second scaling behavior with -dependent amplitude, in qualitative agreement with Eq. (6). Finally, in 2D where sufficiently large systems can be studied, a third scaling region is observed, with slow (exponent ), -independent decay whose range increases when . Such a regime is absent from the framework of TT theory.
The second regime also departs strikingly from the Toner-Tu results. In this region both 2D and 3D curves do not collapse when their amplitude is rescaled by with , as predicted exactly by TT theory, but rather with in 2D and 0.5 in 3D (Fig. 1(e,f)). Moreover, the collapsed curves do not decay with exponent (2D) and (3D) as predicted by Eq. (6) using the values of and determined from . Rather, we find in 2D and in 3D. Our data therefore suggest that for , with in 2D and in 3D.
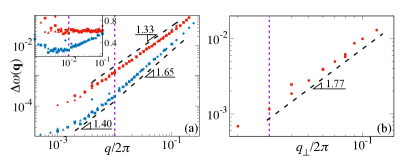
In order to assess the dynamical exponent , we now turn to the study of space-time correlations. As expected from Eqs. (2) and previous work in 2D Tu et al. (1998); Geyer et al. (2018) both and , as functions of , show two asymmetric peaks that become symmetric in the transverse direction (). In 3D, one observes the emergence of an additional third peak in coming from its component . All these peaks are well fitted close to their maximum by Cauchy distributions of the type , where , and respectively account for their heights, positions and half-peak widths (see data in SUP ). Since we have seen that density correlations seem more sensitive to finite-size effects, we now focus on velocity correlations for the quantitative characterization of the peaks. As expected peak positions scale linearly with in the limit , and the sound speeds are given by the corresponding slopes. Perfect agreement is found with the linear theory, both in 2D and 3D Mahault et al. (2019). Peak widths, on the other hand, show non-trivial scaling: correspond to the dampings and thus from Eq. (3) are expected to scale as and in the longitudinal and transverse directions. We find rather good scaling in 2D for both longitudinal and transverse directions (Fig. 2(a)), with, in this last case, . In the longitudinal direction, we find weak evidence of a crossover at the same scale as for equal-time correlations. Below , the estimated value of (1.65) is identical to that of found below in Fig. 1(a). Beyond , we unfortunately could not obtain much data, but the few points we have are compatible with a slope 1.4, i.e. the asymptotic value of found from Fig. 1(a). In 3D, where the data is much more limited, we can nevertheless observe good scaling of the peak width over almost a decade in the transverse direction , yielding the estimate (see Fig. 2(b)), identical to our estimate of from equal-time correlations. Results leading to similar values of in 2D and 3D are found from the scaling of the peaks heights, see SUP for details.
In summary, using the Vicsek model, we have measured independently the values of the three universal exponents , and that characterize long-range correlations of density and velocity fluctuations in polar flocks, and found them incompatible with those conjectured by Toner and Tu in Toner and Tu (1995) (see Table 1). These differences indicate that at least some of the nonlinearities identified in Toner (2012) and neglected in the original calculation are indeed relevant asymptotically.
Our data suggest in particular the existence of a crossover scale beyond which —i.e. at scales scarcely explored before— there is very little or vanishing anisotropy. Coming back to the popular giant number fluctuations, we find that , which governs their scaling, varies very little across scales, and takes values close to those predicted by Toner and Tu, (see Table 1, and SUP ). This clarifies why previous studies focusing on this quantity could not challenge the Toner and Tu conjecture Tu et al. (1998); Chaté et al. (2008, 2008).
We find identical estimates, within our numerical accuracy, of and . In other words, the hyperscaling relation seems satisfied. If we take this numerical fact for granted, it implies that, somewhat counterintuitively, the vertices responsible for the departure from the 1995 TT results are not those coupling density and order. Moreover, also implies that the noise variance does not renormalize, so that the dominant effective noise in the -equation is indeed additive, as assumed in TT theory (see SUP for the simple arguments leading to these conclusions).
We also find qualitative discrepancies with TT theory in the longitudinal behavior of density correlations 444Note that our 2D results would be in disagreement with TT theory under the hypothesis that the three scaling regimes observed would correspond to those predicted (see Eq. (6) and the intermediate one mentioned in Note (3)). In particular, the third scaling regime we identify is independent of . We have at present no full understanding of this, but, as explained in a forthcoming publication, the consideration of a (conserved) additive noise in the density equation —something quite natural in the context of fluctuating hydrodynamic equations— leads to a modified form of Eq. (6) in the sector. This change already occurs at the linear level and could account, upon renormalization, for the peculiar scaling regimes reported in Fig. 1(c-f).
All in all, our numerical results, even though they clearly rule out the Toner and Tu 1995 predictions, call even more than before for a complete, possibly non-perturbative, renormalization group approach Delamotte (2012).
We thank Cesare Nardini and Aurelio Patelli for fruitful discussions. We acknowledge a generous allocation of cpu time on Beijing CSRC’s Tianhe supercomputer.
References
- Vicsek et al. (1995) T. Vicsek, A. Czirók, E. Ben-Jacob, I. Cohen, and O. Shochet, Novel Type of Phase Transition in a System of Self-Driven Particles, Phys. Rev. Lett. 75, 1226 (1995).
- Toner and Tu (1995) J. Toner and Y. Tu, Long-Range Order in a Two-Dimensional Dynamical Model: How Birds Fly Together, Phys. Rev. Lett. 75, 4326 (1995).
- Mermin and Wagner (1966) N. D. Mermin and H. Wagner, Absence of Ferromagnetism or Antiferromagnetism in One- or Two-Dimensional Isotropic Heisenberg Models, Phys. Rev. Lett. 17, 1133 (1966).
- Toner et al. (2005) J. Toner, Y. Tu, and S. Ramaswamy, Hydrodynamics and phases of flocks, Annals of Physics 318, 170 (2005), Special Issue.
- Ramaswamy (2010) S. Ramaswamy, The Mechanics and Statistics of Active Matter, Annual Review of Condensed Matter Physics 1, 323 (2010).
- Romanczuk et al. (2012) P. Romanczuk, M. Bär, W. Ebeling, B. Lindner, and L. Schimansky-Geier, Active Brownian particles, The European Physical Journal Special Topics 202, 1 (2012).
- Vicsek and Zafeiris (2012) T. Vicsek and A. Zafeiris, Collective motion, Physics Reports 517, 71 (2012).
- Marchetti et al. (2013) M. C. Marchetti, J. F. Joanny, S. Ramaswamy, T. B. Liverpool, J. Prost, M. Rao, and R. A. Simha, Hydrodynamics of soft active matter, Rev. Mod. Phys. 85, 1143 (2013).
- Cates and Tailleur (2015) M. E. Cates and J. Tailleur, Motility-Induced Phase Separation, Annual Review of Condensed Matter Physics 6, 219 (2015).
- Elgeti et al. (2015) J. Elgeti, R. G. Winkler, and G. Gompper, Physics of microswimmers—single particle motion and collective behavior: a review, Reports on Progress in Physics 78, 056601 (2015).
- Prost et al. (2015) J. Prost, F. Jülicher, and J.-F. Joanny, Active gel physics, Nature Physics 11, 111 EP (2015).
- Bechinger et al. (2016) C. Bechinger, R. Di Leonardo, H. Löwen, C. Reichhardt, G. Volpe, and G. Volpe, Active particles in complex and crowded environments, Rev. Mod. Phys. 88, 045006 (2016).
- Ramaswamy (2017) S. Ramaswamy, Active matter, Journal of Statistical Mechanics: Theory and Experiment 2017, 054002 (2017).
- Doostmohammadi et al. (2018) A. Doostmohammadi, J. Ignés-Mullol, J. M. Yeomans, and F. Sagués, Active nematics, Nature Communications 9, 3246 (2018).
- Chaté (2019) H. Chaté, Dilute Aligning Dry Active Matter, Annual Review of Condensed Matter Physics (2019).
- Ramaswamy et al. (2003) S. Ramaswamy, R. A. Simha, and J. Toner, Active nematics on a substrate: Giant number fluctuations and long-time tails, Europhysics Letters (EPL) 62, 196 (2003).
- Chaté et al. (2006) H. Chaté, F. Ginelli, and R. Montagne, Simple Model for Active Nematics: Quasi-Long-Range Order and Giant Fluctuations, Phys. Rev. Lett. 96, 180602 (2006).
- Narayan et al. (2007) V. Narayan, S. Ramaswamy, and N. Menon, Long-Lived Giant Number Fluctuations in a Swarming Granular Nematic, Science 317, 105 (2007).
- Chaté et al. (2008) H. Chaté, F. Ginelli, G. Grégoire, and F. Raynaud, Collective motion of self-propelled particles interacting without cohesion, Phys. Rev. E 77, 046113 (2008).
- Ginelli et al. (2010) F. Ginelli, F. Peruani, M. Bär, and H. Chaté, Large-Scale Collective Properties of Self-Propelled Rods, Phys. Rev. Lett. 104, 184502 (2010).
- Zhang et al. (2010) H. P. Zhang, A. Be’er, E.-L. Florin, and H. L. Swinney, Collective motion and density fluctuations in bacterial colonies, Proceedings of the National Academy of Sciences 107, 13626 (2010).
- Ngo et al. (2014) S. Ngo, A. Peshkov, I. S. Aranson, E. Bertin, F. Ginelli, and H. Chaté, Large-Scale Chaos and Fluctuations in Active Nematics, Phys. Rev. Lett. 113, 038302 (2014).
- Giavazzi et al. (2017) F. Giavazzi, C. Malinverno, S. Corallino, F. Ginelli, G. Scita, and R. Cerbino, Giant fluctuations and structural effects in a flocking epithelium, Journal of Physics D: Applied Physics 50, 384003 (2017).
- Nishiguchi et al. (2017) D. Nishiguchi, K. H. Nagai, H. Chaté, and M. Sano, Long-range nematic order and anomalous fluctuations in suspensions of swimming filamentous bacteria, Phys. Rev. E 95, 020601 (2017).
- Tu et al. (1998) Y. Tu, J. Toner, and M. Ulm, Sound Waves and the Absence of Galilean Invariance in Flocks, Phys. Rev. Lett. 80, 4819 (1998).
- Chaté et al. (2008) H. Chaté, F. Ginelli, G. Grégoire, F. Peruani, and F. Raynaud, Modeling collective motion: variations on the Vicsek model, The European Physical Journal B 64, 451 (2008).
- Toner and Tu (1998) J. Toner and Y. Tu, Flocks, herds, and schools: A quantitative theory of flocking, Phys. Rev. E 58, 4828 (1998).
- Toner (2012) J. Toner, Reanalysis of the hydrodynamic theory of fluid, polar-ordered flocks, Phys. Rev. E 86, 031918 (2012).
- Kyriakopoulos et al. (2016) N. Kyriakopoulos, F. Ginelli, and J. Toner, Leading birds by their beaks: the response of flocks to external perturbations, New Journal of Physics 18, 073039 (2016).
- Geyer et al. (2018) D. Geyer, A. Morin, and D. Bartolo, Sounds and hydrodynamics of polar active fluids, Nature Materials 17, 789 (2018).
- Note (1) Here we use this ‘vectorial noise’ version, shown in Grégoire and Chaté (2004) to be less sensitive to finite size effects in the coexistence phase. We also used the more common ‘angular noise’ version, obtaining similar results, see SUP .
- Mahault et al. (2019) B. Mahault, F. Ginelli, and H. Chaté, In preparation (2019).
- (33) See supplementary information at … .
- Note (2) In 3D we averaged over all directions of .
- Note (3) A third intermediate scaling region with is expected for Toner and Tu (1998), but given our estimate both in 2D and 3D, we expect it to be unobservable, at odds with the earlier results of Ref. Tu et al. (1998).
- Note (4) Note that our 2D results would be in disagreement with TT theory under the hypothesis that the three scaling regimes observed would correspond to those predicted (see Eq. (6\@@italiccorr) and the intermediate one mentioned in Note (3)). In particular, the third scaling regime we identify is independent of .
- Delamotte (2012) B. Delamotte, An introduction to the nonperturbative renormalization group, in Renormalization Group and Effective Field Theory Approaches to Many-Body Systems, edited by A. Schwenk and J. Polonyi (Springer Berlin Heidelberg, Berlin, Heidelberg, 2012) pp. 49–132.
- Grégoire and Chaté (2004) G. Grégoire and H. Chaté, Onset of collective and cohesive motion, Phys. Rev. Lett. 92, 025702 (2004).