Electronic address: ]ho@tokushima-u.ac.jp
Contrasting pressure evolutions of electron hybridized states in CeRhIn5 and YbNi3Ga9: an optical conductivity study
Abstract
Optical conductivity [] of CeRhIn5 and YbNi3Ga9 have been measured at external pressures to 10 GPa and at low temperatures to 6 K. Regarding CeRhIn5, at ambient pressure the main feature in is a Drude peak due to free carriers. With increasing pressure, however, a characteristic mid-infrared (mIR) peak rapidly develops in , and its peak energy and width increase with pressure. These features are consistent with an increased conduction ()- electron hybridization at high pressure, and show that the pressure has tuned the electronic state of CeRhIn5 from very weakly to strongly hybridized ones. As for YbNi3Ga9, in contrast, a marked mIR peak is observed already at ambient pressure, indicating a strong - hybridization. At high pressures, however, the mIR peak shifts to lower energy and becomes diminished, and seems merged with the Drude component at 10 GPa. Namely, CeRhIn5 and YbNi3Ga9 exhibit some opposite tendencies in the pressure evolutions of and electronic structures. These results are discussed in terms of the pressure evolutions of - hybridized electronic states in Ce and Yb compounds, in particular in terms of the electron-hole symmetry often considered between Ce and Yb compounds.
pacs:
75.30.Mb,74.70.Tx,74.62.Fj,78.30.-jI Introduction
Physics of strongly correlated -electron systems, most typically Ce-based and Yb-based intermetallic compounds, has attracted much interest for the last few decades.onuki Central to the problem is a duality between localized and delocalized characteristics exhibited by the electrons. The electrons intrinsically exhibit localized characteristics since the orbitals are located closer to the nucleus than the conduction states. However, they may become partially delocalized by hybridizing with conduction () electrons. This - hybridization leads to various interesting phenomena such as the Kondo effect, heavy fermion (HF) formation, intermediate valence (IV), Rudermann-Kittel-Kasuya-Yoshida interaction and the associated magnetic ordering. It also plays an important role in the quantum critical phenomena (QCP) at the border of magnetic ordering.
In IV compounds, the - hybridization is fairly strong, and the average Ce or Yb valence significantly deviates from 3 and takes an intermediate value well above and below 3 for Ce and Yb compounds, respectively.lawrence ; riseborough Optical conductivity [] studies have provided much information about their microscopic electronic states.wang A marked mid-infrared (mIR) peak has been commonly observed in of many Ce- and Yb-based IV metals, and its origin has been discussed in terms of the - hybridized electronic states. sievers ; garner ; degiorgi ; dordevic ; hancock ; universal ; pines ; mutou ; saso ; kimura-ce ; kimura-yb ; kimura-ce2 ; 115-burch For example, a model of “renormalized - hybridized bands” has been used to understand the mIR peak.garner ; degiorgi ; dordevic ; hancock ; universal In this model, a flat band renormalized by large electron correlation () hybridizes with a wide band, forming a pair of hybridized bands near the Fermi level ().cox ; coleman1 ; coleman2 The mIR peak in this model results from optical excitations between the two bands.garner Its peak energy is given as , where is the - hybridization renormalized by large , and expressed as
| (1) |
where and indicate the Kondo temperature and bandwidth, respectively.cox ; coleman1 ; coleman2 Measured values of different IV metals have been compared with their (or related quantities) estimated by other experiments, and a universal relation between and has been found over a variety of Ce and Yb compounds.dordevic ; hancock ; universal ; pines An example of such universal relationuniversal is shown in Fig. 1.
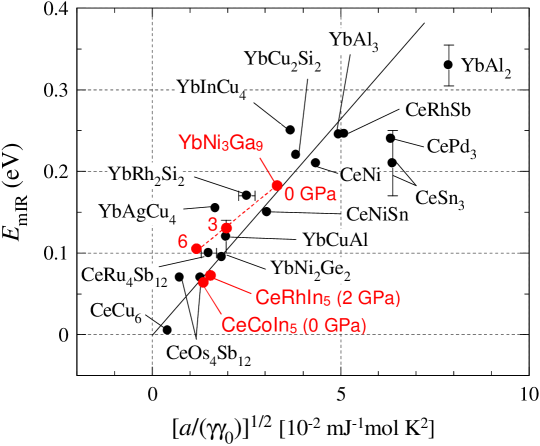
This universal relation may be regarded as an optical analogue to the well known Kadowaki-Woods relation.KW ; grand-KW More detailed analyses including effects of level degeneracy and/or the band structure have also been reported. mutou ; saso ; kimura-ce ; kimura-yb ; kimura-ce2 These studies suggest that the - hybridized band model is an oversimplification for the actual IV metals. For example, it has been suggested that, for Ce compounds, should correspond to the energy separation from the - hybridized band below to the bare states above .kimura-ce2 In fact, the observed values of some IV compounds seem too large to result between the - hybridized bands, and such a model may offer a useful alternative to the - hybridized band model. Nevertheless, it is still true that the mIR peak energy is roughly scaled with over many IV metals.dordevic ; hancock ; universal ; pines Clearly, the characteristics of the mIR peak involve the Kondo physics, and are not due to accidental band structures. Furthermore, effects of momentum-dependent - hybridization have been considered in analyzing of Ce compounds.115-burch
Note that both Ce- and Yb-based IV metals seem to follow the same universal relation,universal ; pines as seen in Fig. 1. For Ce3+ and Yb3+ ions, their respective and configurations have an electron-hole (-) symmetry, since is equivalent to . It has been an important question as to what degree this - symmetry is reflected on the properties of Ce and Yb compounds. An example of common property between them, which is consistent with the - symmetry, is the formation of HF state with large effective mass. However, Ce and Yb compounds also exhibit noted differences.flouquet ; 122hikaku A useful experimental technique to examine the - symmetry is the application of an external pressure ().flouquet ; 122hikaku ; Yb-theory ; thompson Since Ce4+ () and Yb3+ () ions have smaller ionic radii than Ce3+ () and Yb2+ () ions, respectively, an applied generally increases the average valence () of Ce toward 4 and that of Yb toward 3. For both Ce and Yb cases, should also increase the bare (unrenormalized) - hybridization, since a reduced interatomic distance should increase the overlap between the and wave functions. For Ce compounds, an increase of - hybridization with has been observed, for example, by an increase in .flouquet Then, in Fig. 1, upon applying , a Ce compound should move to upper right. For Yb compounds, in addition to increases, effective mass increases and magnetic order have been found at high .flouquet ; 122hikaku ; thompson Namely, Yb compounds seem to exhibit more localized electron states at high . This suggests a reduced , and hence a reduced from Eq. (1), although the bare hybridization in a Yb compound should increase with as explained above. Therefore, it is intriguing how an Yb compound should move with in Fig. 1.
In this work, we have addressed the above questions by studying the of CeRhIn5 and YbNi3Ga9 at to 10 GPa and at temperatures () to 6 K. These compounds have attracted much attention for their remarkable properties at high , as summarized in Fig. 2.
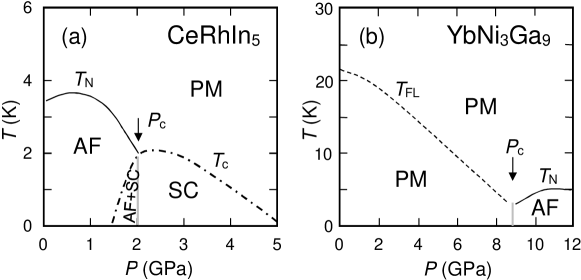
CeRhIn5 exhibits an antiferromagnetism (AF) at =0 with a Neel temperature () of 3.3 K and an electronic specific heat coefficient of = 420 mJ/K2mol above .115-sc With increasing , the AF is gradually suppressed, and near a critical pressure () of 2 GPa, a superconductivity with a transition temperature () of 2.1 K is observed.115-sc ; 115-dac Around , various anomalous properties related with QCP have been observed.115-review ; 115-onuki ; 115-phase ; 115-phase2 of CeRhIn5 at ambient has already been measured and analyzed in detail,115-vdmarel ; 115-burch but at high had not been explored yet. YbNi3Ga9, in contrast, is a paramagnetic IV compound at =0 with =30 mJ/K2mol, indicating a strong - hybridization.139-ohara ; 139-PES With increasing , the measured increases from 2.6 at =0 to 2.88 at =16 GPa, and an AF state appears above 9 GPa.139-pressure In addition, increases significantly with , reaching =1 J/K2mol at 9 GPa.139-gamma Namely, with increasing , CeRhIn5 shows a crossover from localized to delocalized electronic states, while YbNi3Ga9 shows that from delocalized to localized ones. Although the lowest ’s in our study, 6 K for CeRhIn5 and 8 K for YbNi3Ga9, are above and , our study should still provide important information about the tuning of the underlying - hybridized state behind the QCP-related properties below and . The mIR peaks of CeRhIn5 and YbNi3Ga9 have indeed shown quite contrasting evolutions, which are discussed in terms of the - hybridized electronic states at high , and in terms of the - symmetry.
II Experimental
The samples of CeRhIn5 and YbNi3Ga9 used were single crystals grown with self-flux method. The reflectance spectrum [] of a sample was measured on an as-grown surface without polishing. was derived from using the Kramres-Kronig (KK) analysis.dressel at =0 was measured at photon energies between 15 meV and 30 eV covered by several light sources,okamura-chapter including the vacuum uv synchrotron radiation at the beamline BL7B of the UVSOR Facility.bl7b spectra at high were measured using a diamond anvil cell (DAC).pressure-review Type IIa diamond anvils with 0.8 mm culet diameter and a stainless steel gasket were used to seal the sample with glycerin as the pressure transmitting medium.medium1 ; medium2 ; medium3 A flat surface of a sample was closely attached on the culet surface of the diamond anvil, and at the sample/diamond interface was measured. Small ruby pieces were also sealed to monitor the pressure via its fluorescence. A gold film was placed between the gasket and anvil as a reference of . In the KK analysis of measured with DAC, the refractive index of diamond (=2.4) was taken into account as previously discussed.kk-dia at high and low were measured at photon energies from 25 meV (CeRhIn5) or 20 meV (YbNi3Ga9) to 1.1 eV, using synchrotron radiation as a bright IR sourceJPSJ-review at the beamline BL43IR of SPring-8.micro1 ; micro2 Below the measured energy range, was extrapolated with the Hagen-Rubens function.dressel More details of the high pressure IR experiments can be found elsewhere.pressure-review
III Results and Discussions
III.1 and of CeRhIn5 at high pressures
Figure 3(a) shows and of CeRhIn5 at =0 and =295 K over the entire measured spectral range. below 0.3 eV is very high, which indicates highly metallic characteristics of CeRhIn5. has a Drude component rising toward zero energy, which is due to free carrier dynamics. Figures 3(b) and 3(c) show and measured at different values of and .
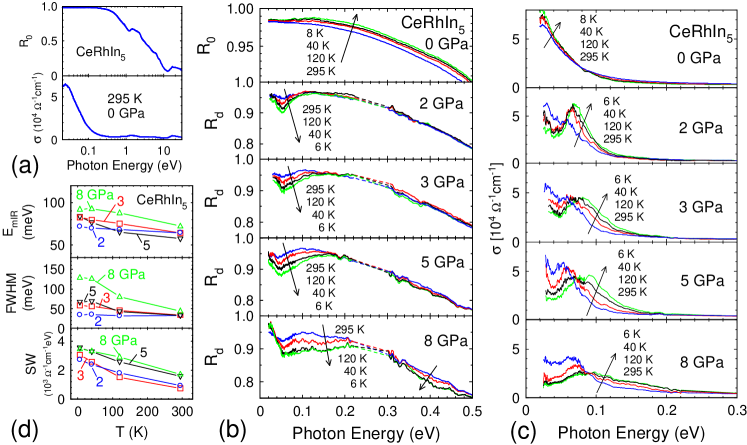
At =0, and have only minor dependences, which is consistent with the previous report.115-vdmarel With increasing , as shown in Figs. 3(b) and 3(c), a dip appears and develops in , and a pronounced mIR peak develops in . At 2 GPa, the mIR peak is barely visible at 295 K, but becomes very pronounced with cooling to 6 K. As discussed in Introduction, such a mIR peak is a hallmark of the - hybridized state in Ce compounds. Namely, CeRhIn5 at 2 GPa has much stronger - hybridization than at 0 GPa. Note that the -evolution of mIR peak at =2 GPa is strikingly similar to that of CeCoIn5 at =0, with very close .basov ; 115-vdmarel ; okamura115 CeCoIn5 at =0 is also a superconductor with almost the same as that of CeRhIn5 at 2 GPa.basov These similarities between CeCoIn5 at 0 GPa and CeRhIn5 at 2 GPa indicate that their - hybridized electronic states are also similar. In Fig. 1, of CeCoIn5 at 0 GPa and CeRhIn5 at 2 GPa have been added using their and data.comment2 Clearly, they follow the universal relation well, and their plots are indeed close to each other reflecting their similarity. At =3 GPa, the mIR peak of CeRhIn5 is broader than that at 2 GPa. This broadening of the mIR peak should basically indicate a broadening of the band, and hence a stronger - hybridization. From the evolutions of from =0 to 3 GPa, it is clear that the electronic structure of CeRhIn5 in the normal state at 6 K changes significantly from very weakly to moderately hybridized ones, which should be an important basis for the QCP observed below 2 K. From 3 to 8 GPa, the mIR peak becomes apparently much broader, and its spectral weight (SW) shifts toward higher energy. In addition, at 5 and 8 GPa the mIR peak is clearly observed even at room , which is a feature often observed for IV Ce compounds. Namely, CeRhIn5 above 5 GPa is likely a strongly hybridized IV compound. Unfortunately, data of CeRhIn5 above 2 GPa are unavailable, so above 2 GPa cannot be plotted in Fig. 1. However, it is almost certain that the plot for CeRhIn5 moves to upper right with , since the resistivity data115-dac strongly suggest that the hybridization is much stronger at 8 GPa.
To analyze the evolution of mIR peak more quantitatively, we have performed spectral fitting on the measured using the Drude-Lorentz oscillator model.dressel Details of the fitting procedures and examples of the fitted spectra are given in the Appendix. In Fig. 3(d), the , full width at half maximum (FWHM), and the SW of the mIR peak given by the fitting are summarized. The fitting results in Fig. 3(d) confirm the features discussed above, namely the -induced increases in , SW, and the width. However, they also reveal that the increases in and SW are at most about 30 %. In contrast, the increase in the width at 6 K is particularly large from 5 to 8 GPa, suggesting that electron bandwidth should rapidly increase at this range.
III.2 and of YbNi3Ga9 at high pressures
Figure 4(a) shows measured and of YbNi3Ga9 over a wide energy range at =0 and =295 K, and Figures 4(b) and 4(c) show those below 0.4 eV at different values of and .
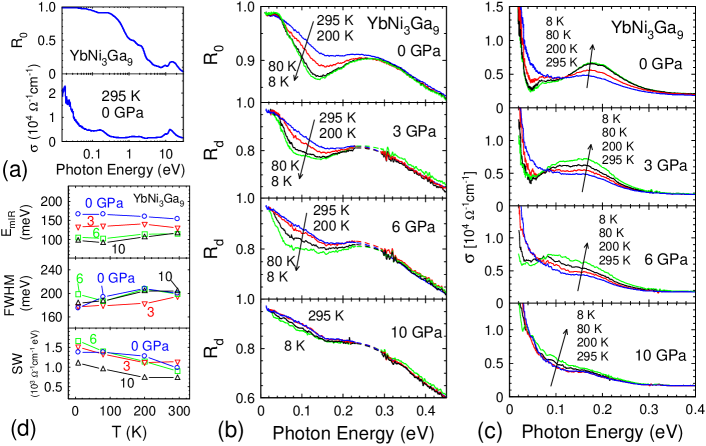
At =0, a dip is observed in at 0.1-0.2 eV range and a mIR peak in at 0.1-0.3 eV range, both of which are strongly dependent. A Drude component is also observed in below 0.1 eV, which rises steeply toward zero energy. With cooling, the dip becomes deeper, and the mIR peak becomes more pronounced and slightly shifts to higher energy. In addition, a shoulder appears in near 70 meV at low . Furthermore, the onset of Drude component becomes extremely sharp at low . This is because at low is very large, exceeding 1 106 cm-1 at 8 K.139-ohara ; 139-pressure This extremely narrow Drude component is due to the Drude response of heavy quasiparticles formed at low .sievers These features are qualitatively very similar to those previously observed for other Yb-based IV metals such as YbAl3.ybal3 Using the observed =0.18 eV at 8 K with =30 mJ/K2mol and =6.3 mJ/K2mol,139-ohara a plot for YbNi3Ga9 at =0 has been added in Fig. 1. Clearly, YbNi3Ga9 well follows the universal relation.
The spectra at various values of and have been analyzed by spectral fitting, similarly to those of CeRhIn5. The results are summarized in Fig. 4(d), and examples of the fitting are given in Appendix. At 3 GPa, and spectra are still strongly dependent. Note that, at low , the mIR peak seems to consist of two peaks, located at 0.1 and 0.17 eV. A similar two-peak feature is also observed at 6 GPa. The origins for the two peaks are unclear, hence we define as the center-of-mass position of the Lorentz oscillators used to fit the mIR peak. As indicated in Fig. 4(d), the obtained decreases with from 0 to 3 GPa, and also from 3 to 6 GPa. The ’s at =3 and 6 GPa and =8 K given by the spectral fitting have been added in Fig. 1, using the data measured at high .139-gamma ; comment3 The plot for YbNi3Ga9 moves to down left with , namely, it actually moves in an opposite manner to that of Ce compounds. At 10 GPa, the mIR peak seems much weaker than at 6 GPa, and almost merged with the Drude component. The remaining mIR component has been evaluated by the fitting as in Fig. 4(d), which indicates that further decreases compared with that at 6 GPa. From Figs. 4(b) and 4(c), the variations of and at 10 GPa are much smaller than those at 6 GPa. This strongly suggests that the -dependent hybridization has become much weaker with from 6 to 10 GPa. This is reasonable since the electron state should be more localized and less hybridized above 9 GPa, where an AF state appears below =5 K. The fitting results in Fig. 4(d) also indicate that does not change much with , although it clearly decreases with . In addition, the peak width seems to exhibit no systematic changes with and .
III.3 Comparison of pressure evolutions between CeRhIn5 and YbNi3Ga9
To compare more clearly the observed evolutions of between CeRhIn5 and YbNi3Ga9, the spectra at the lowest measured are displayed in Fig. 5.
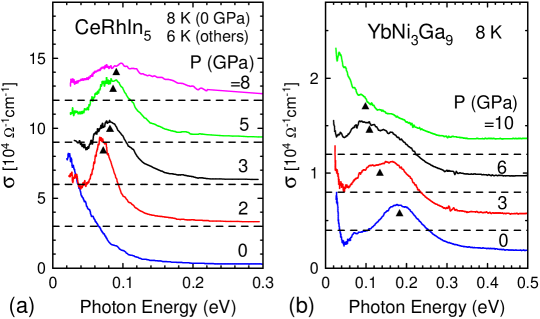
Clearly, the evolutions of CeRhIn5 and YbNi3Ga9 have some contrasting and opposite tendencies: With increasing , the mIR peak of CeRhIn5 appears and grows, and shifts to higher energy. In contrast, the mIR peak of YbNi3Ga9 is well developed already at =0, and shifts to lower energy with and becomes diminished at 10 GPa. On the other hand, not all the evolutions of mIR peak exhibit opposite tendencies between them. For example, the mIR peak width of CeRhIn5 significantly increases with , but that of YbNi3Ga9 does not exhibit a narrowing or any other systematic change, as indicated in Fig. 6(b). In addition, -induced shift of seems much larger for YbNi3Ga9 than for CeRhIn5. Below, we consider these results in terms of the evolution of IV states in Ce and Yb compounds.
In a Ce compound with =3 and completely localized state, should consist only of a Drude component due to electrons, since the system is a metal where the localized electrons do not contribute to the Drude response. This applies well to CeRhIn5 at 0 GPa, since its has only a Drude component in Fig 3(c) and its should be very close to 3. As stated in Introduction, an external on a Ce compound should increase from 3. In this IV state, would exhibit a mIR peak due to the hybridized state, as actually observed in of CeRhIn5 at 2 and 3 GPa. With further increasing , both the energy and width of the mIR peak should increase, since the hybridization and bandwidth increase with . This is again consistent with the observed at 3-8 GPa. Namely, the observed evolutions of for CeRhIn5 seem quite consistent with those expected for a Ce compound. -induced higher-energy shifts and development of an IR peak in have also been observed for CeRu4Sb12 (Ref. okamura-sku, ) and CeIn3.iizuka
As for Yb compounds, as stated in Introduction, an ionic radius consideration suggests that of an IV Yb compound should increase toward 3 with . In the limit of exactly =3 state with completely localized state, would consist only of a broad Drude component due to electrons, similarly to the (Ce3+) case. Namely, the main feature in of an IV Yb compound should evolve from a mIR peak at =0 into a broad Drude component in the limit of very high . Clearly, such a evolution is qualitatively consistent with that observed for YbNi3Ga9 in Fig. 5(b): has a well developed mIR peak at =0, which shifts to lower energy with and becomes much weaker at 10 GPa. at 10 GPa actually looks like a broad Drude component, and the residual mIR peak SW would become even weaker if is further increased since still increases from 2.84 at 10 GPa to 2.88 at 16 GPa.139-pressure
The discussions above indicate that the opposite tendencies in the evolutions of between CeRhIn5 and YbNi3Ga9, including the opposite -induced moves in Fig. 1, are consistent with the consideration of ionic radius and - symmetry under high . The expression for the renormalized hybridization in Eq. (1) has been derived for an (Ce3+) system,cox ; coleman1 ; coleman2 but is also valid for (, Yb3+) system under the - symmetry. Hence, for both Ce and Yb compounds, and should become smaller with increasing localization and decreasing . This has been actually demonstrated by the Ce and Yb compounds plotted in Fig. 1. Then, according to Eq. (1), the -induced decrease of for YbNi3Ga9 indicates that decreases with , although the bare (unrenormalized) hybridization should increase with as already discussed. This peculiar property of an Yb compound has been discussedmito in terms of the - exchange energy, , expressed asJcf
| (2) |
where is the bare - hybridization averaged over the space and is the one-electron (unrenormalized) level. Eq. (2) has been derived for an system with sufficiently large , but is also valid for system under the - symmetry. is related with as . Note that in Eq. (2) increases with for both Ce and Yb cases, as discussed earlier. In addition, note that should increase with relative to .mito ; comment9 For Ce case, is located below and approaches with increasing . Hence decreases in Eq. (2), so that increases with . For Yb case, in contrast, is the hole level located above , and moves away from with . Hence increases with in Eq. (2), so that may either increase or decrease depending on which of and increases more. Therefore, the -induced decrease of for YbNi3Ga9 suggests that increases with more than does.
As already mentioned, some of the observed evolutions of are not opposite or symmetrical between CeRhIn5 and YbNi3Ga9. For example, the mIR peak of CeRhIn5 shows progressive and significant broadenings with , while that of YbNi3Ga9 does not show a narrowing or any systematic change with . In addition, -induced shift of seems much larger for YbNi3Ga9 (0.18 to 0.1 eV on going from 0 to 6 GPa) than for CeRhIn5 (70 to 90 meV on going from 2 to 8 GPa). Microscopic mechanisms for these results are unclear, but they should involve microscopic differences between Ce3+ and Yb3+ not considered in the simple - symmetry argument. For example, the 4 orbital of Yb3+ is much more localized than that of Ce3+, leading to a much smaller bandwidth and for Yb3+.flouquet ; 122hikaku In addition, the spin-orbit splitting of Yb3+ ( 1.3 eV) is much larger than that of Ce3+ ( 0.3 eV). It has been pointed outflouquet ; 122hikaku that, due to these differences, the -induced variation of from 3.0 in a Ce compound should be at most to 3.16, while that in an Yb compound can be changed more widely between 2 and 3. Experimentally, of CeRhIn5 at high has not been reported, but that of CeCoIn5 has been reported to vary from 3.00 at =0 to 3.05 at 8 GPa.yamaoka On the other hand, of YbNi3Ga9 varies from 2.60 at =0 to 2.84 at =10 GPa.139-pressure These different ranges of variation in may be related to the much larger -induced shifts of for YbNi3Ga9, since is closely related with and . To further understand evolutions of and electronic structures for Yb compounds, more studies on other Yb-based IV compounds are clearly needed. For example, YbCu2Ge2 (Ref. miyake, ) and YbAl2 (Ref. dallera, ) are other examples that exhibit large dependences in their physical properties. studies of these compounds at high are in progress.Yb122
IV Summary
studies of CeRhIn5 and YbNi3Ga9 at high have been performed to probe the evolutions of their - hybridized electronic structures. The main feature in the measured is a mIR peak, which has exhibited many opposite or symmetrical evolutions between CeRhIn5 and YbNi3Ga9: With increasing , the mIR peak develops and shifts to higher energy for CeRhIn5, while it shifts to lower energy and becomes diminished at high for YbNi3Ga9. These results are qualitatively consistent with the - symmetry and -induced variations in the Ce and Yb ionic radii. However, YbNi3Ga9 has also exhibited evolutions of mIR peak not opposite to those of CeRhIn5, which are likely due to microscopic differences between Ce and Yb not included in the simple - symmetry arguments.
Acknowledgements.
H. O. would like to thank Dr. Takeshi Mito and Dr. Tetsuya Mutou for useful discussions. The experiments at SPring-8 were performed under the approval by JASRI (2011B0089, 2012A0089, 2012B0089, 2013A0089, 2013B0089, 2013B1159), and those at UVSOR under the approval by Institute for Molecular Science. H. O. acknowledges financial support from JSPS KAKENHI (21102512, 23540409, 26400358).*
Appendix A Spectral fittings on
The spectral fittings were performed using the Drude-Lorentz model.dressel In this model, the complex dielectric function is expressed as a sum of Drude and Lorentz oscillators, which represent free and bound electrons, respectively, as
| (3) |
Here, , , and are the plasma frequency, natural frequency, and damping, respectively. denotes the th oscillator, and =0 for a Drude oscillator. represents contribution from higher-lying interband transitions. In the fitting, these parameters are adjusted so as to reproduce a measured through the relation .
Figure 6(a) shows examples of fitting for of CeRhIn5 at 6 K.
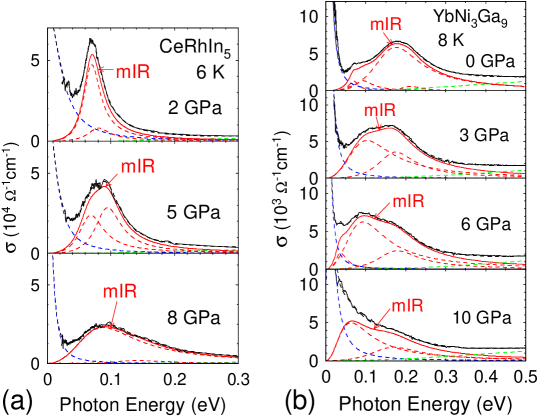
The measured spectra can be reproduced well by using two Lorentz oscillators for the mIR peak, in addition to a Drude oscillator and a broad Lorentz oscillator peaked at 0.45 eV serving as a background. =5 is used for all the fitting, and the fitted mIR peak is the sum of the two Lorentz oscillators. Although not shown, at other values of and can be fitted similarly. Note that two Lorentz oscillators are used simply because a single Lorentz oscillator is not sufficient to fit the mIR peak, and that the two Lorentz oscillators are not assigned to any specific origins. In addition, due to the use of DAC, the measured spectral range does not cover low-enough energies for fitting the Drude component. However, since our main focus here is the evolution of mIR peak with and , the uncertainty regarding the Drude peak fitting is not a serious problem. To reduce the uncertainty in fitting the Drude component, value given by the fitting was kept in the range 8-20 104 cm-1, and was increased with decreasing . These constraints on the Drude component are implied from the at =0 [Fig. 3(c)] and also from the measured dc conductivities.115-sc
Figure 6(b) shows examples of fitting for YbNi3Ga9. In some cases more than two Lorentz oscillators are needed to fit the mIR peak reasonably well. A background Lorentz oscillator at 0.75 eV and =5 are used. Here, the fitting parameters are chosen so that at each data matched the measured dc conductivity at the same and .139-ohara ; 139-pressure ; comment1 This procedure greatly reduced the uncertainty in fitting the Drude component. At 0-6 GPa, as mentioned in Section III.B, the Drude component is extremely narrow due to the large values of . At 10 GPa, the mIR peak is not well resolved from the Drude component any more, but the fitting was nevertheless performed to evaluate the remaining mIR component, as shown in Fig. 6(b). Again, measured ,139-pressure for example 4.5 cm-1 at =10 GPa and =8 K, were used to reduce the uncertainty. The fitting results suggest that the SW of mIR peak at 10 GPa is still sizable, but is indeed much smaller than that at 6 GPa, as discussed in the main text.
The , FWHM, and SW of the mIR peak obtained from the fitting are displayed in Figs. 3(d) and 4(d) for CeRhIn5 and YbNi3Ga9, respectively. Here, is defined as the center of mass of the Lorentz peaks, namely the mean of ’s of the Lorentz oscillators weighted by their respective SW’s. The SW of a Lorentz oscillator is defined as its area in , and the SW of the mIR peak is the area of the fitted total mIR peak, namely the red solid curves in Fig. 6.
References
- (1) See, for example, Y. nuki, Physics of Heavy Fermions: Heavy Fermions and Strongly Correlated Electron Systems (World Scientific, 2018).
- (2) J. Lawrence, Mod. Phys. Lett. B 22, 1273 (2008).
- (3) P. S. Riseborough and J. M. Lawrence, Rep. Prog. Phys. 79, 084501 (2016).
- (4) For a recent review, see, for example, R. Y. Chen and N. L. Wang, Rep. Prog. Phys. 79, 064502 (2016).
- (5) B. C. Webb, A. J. Sievers, and T. Mihalisin, Phys. Rev. Lett. 57, 1951 (1986).
- (6) S. R. Garner, J. N. Hancock, Y. W. Rodriguez, Z. Schlesinger, B. Bucher, Z. Fisk, and J. L. Sarrao, Phys. Rev. B 62, R4778 (2000).
- (7) L. Degiorgi, F. Anders, and G. Gruner, Eur. Phys. J. B 19, 167 (2001).
- (8) S. V. Dordevic, D. N. Basov, N. R. Dilley, E. D. Bauer, and M. B. Maple, Phys. Rev. Lett. 86, 684 (2001).
- (9) J. N. Hancock, T. McKnew, Z. Schlesinger, J. L. Sarrao, and Z. Fisk, Phys. Rev. Lett. 92, 186405 (2004).
- (10) H. Okamura, T. Watanabe, M. Matsunami, T. Nishihara, N. Tsujii, T. Ebihara, H. Sugawara, H. Sato, Y. nuki, Y. Ishikawa, T. Takabatake, and T. Nanba, J. Phys. Soc. Jpn. 76, 023703 (2007).
- (11) G. Lonzarich, D. Pines, and Y. Yang, Rep. Prog. Phys. 80, 024501 (2017).
- (12) T. Mutou and T. Saso, J. Phys. Soc. Jpn. 73, 2900 (2004).
- (13) H. Kuroiwa, Y. Imai, and T. Saso, J. Phys. Soc. Jpn. 76, 124704 (2007).
- (14) S. Kimura, T. Iizuka, and Y. Kwon, J. Phys. Soc. Jpn. 78, 013710 (2009).
- (15) S. Kimura, Phys. Rev. B 80, 073103 (2009).
- (16) S. Kimura, Y. Kwon, Y. Matsumoto, H. Aoki, and O. Sakai, J. Phys. Soc. Jpn. 85, 083702 (2016).
- (17) K. S. Burch, S. V. Dordevic, F. P. Mena, A. B. Kuzmenko, D. van der Marel, J. L. Sarrao, J. R. Jeffries, E. D. Bauer, M. B. Maple, and D. N. Basov, Phys. Rev. B 75, 054523 (2007).
- (18) D. L. Cox, Phys. Rev. Lett. 58, 2730 (1987).
- (19) P. Coleman, in Handbook of Magnetism and Advanced Magnetic Materials Vol. 1: Fundamentals and Theory (Wiley, New York, 2007). Also available as P. Coleman, Heavy Fermions: electrons at the edge of magnetism, arXiv:cond-mat/0612006 (2007).
- (20) P. Coleman, Heavy fermions and the Kondo lattice: a 21st century perspevtive, arXiv: 1509.05769 (2015).
- (21) K. Kadowaki and S. B. Woods, Solid State Commun. 58, 507 (1986).
- (22) N. Tsujii, H. Kontani, and K. Yoshimura, Phys. Rev. Lett. 94, 057201 (2005).
- (23) J. Flouquet and H. Harima, ”Heavy fermion material: Ce versus Yb case”, arXiv:0910.3110 (2009). Also published in Japanese in Kotai Butsuri 47, 47 (2012).
- (24) G. Knebel, R. Boursier, E. Hassinger, G. Lapertot, P. G. Niklowetz, A. Pourret, B. Salce, J. P. Sanchez, I. Sheikin, P. Bonville, H. Harima, and J. Flouquet, J. Phys. Soc. Jpn. 75, 114709 (2006).
- (25) A. V. Goltsev and M. M. Abd-Elmeguid, J. Phys.: Condense. Matter 17, S813 (2005).
- (26) J. D. Thompson and J. M. Lawrence, Handbook on the Physics and Chemistry of Rare Earths, Vol. 19 (ed. K.A. Gschneidner, Jr. L. Eyring, G. H. Lander, and G. R. Choppin, Elsevier 1994), p382.
- (27) H. Hegger, C. Petrovic, E. G. Moshopoulou, M. F. Hundley, J. L. Sarrao, Z. Fisk, J. D. Thompson, Phys. Rev. Lett. 84, 4986 (2000).
- (28) T. Muramatsu, N. Tateiwa, T. C. Kobayashi, K. Shimizu, K. Amaya, D. Aoki, H. Shishido, Y. Haga, and Y. nuki, J. Phys. Soc. Jpn. 70, 3362 (2001).
- (29) For review, see, for example, J. L. Sarrao and J. D. Thompson, J. Phys. Soc. Jpn. 76, 051013 (2007), and papers cited therein.
- (30) H. Shishido, R. Settai, H. Harima, and Y. nuki, J. Phys. Soc. Jpn. 74, 1103 (2005).
- (31) T. Park, F. Ronning, H. Q. Yuan, M. B. Salamon, R. Movshovich, J. L. Sarrao, and J. D. Thompson, Nature 440, 65 (2006),
- (32) G. Knebel, D. Aoki, J.-P. Brison, and J. Flouquet, J. Phys. Soc. Jpn. 77, 114704 (2008).
- (33) F. P. Mena, D. van der Marel, and J. L. Sarrao, Phys. Rev. B 72, 045119 (2005).
- (34) T. Yamashita, R. Miyazaki, Y. Aoki, and S. Ohara, J. Phys. Soc. Jpn. 81, 034705 (2012).
- (35) Y. Utsumi, H. Sato, S. Ohara, T. Yamashita, K. Mimura, S. Motonami, K. Shimada, S. Ueda, K. Kobayashi, H. Yamaoka, N. Tsujii, N. Hiraoka, H. Namatame, M. Taniguchi, Phys. Rev. B 86, 115114 (2012).
- (36) K. Matsubayashi, T. Hirayama, T. Yamashita, S. Ohara, N. Kawamura, M. Mizumaki, N. Ishimatsu, S. Watanabe, K. Kitagawa, Y. Uwatoko, Phys. Rev. Lett. 114, 086401 (2015).
- (37) K. Umeo, T. Otaki, Y. Arai, S. Ohara, and T. Takabatake, Phys. Rev. B 98, 024420 (2018).
- (38) M. Dressel and G. Grüner, Electrodynamics of Solids (Cambridge University Press, Cambridge, 2002).
- (39) H. Okamura, Chapter 4 in Optical Techniques for Solid State Materials Characterization (R. Prasankumar and A. Taylor, Ed.), CRC Press (2011).
- (40) K. Fukui, H. Miura, H. Nakagawa, I. Shimoyama, K. Nakgawa, H. Okamura, T. Nanba, M. Hasumoto, and T. Kinoshita, Nucl. Instr. Methods Phys. Res. A 467-468, 601 (2001).
- (41) H. Okamura, Y. Ikemoto, T. Mariwaki, and T. Nanba, Jpn. J. Appl. Phys. 56, 05FA11 (2017).
- (42) N. Tateiwa and Y. Haga, Rev. Sci. Instrum. 80, 123901 (2009).
- (43) S. Klotz, K. Takemura, Th. Strassie, and Th. Hansen, J. Phys.: Condens. Matter 24, 325103 (2012).
- (44) Glycerin has good characteristics as a pressure transmitting medium.medium1 ; medium2 It does not solidify at room up to about 5 GPa, and produces more hydrostatic pressure even at lower compared with solid media such as NaCl and KBr, which are commonly used for optical studies with DAC. Therefore, we have used glycerin although using a liquid medium such as glycerin in a study with DAC is technically much more challenging than using a solid medium.
- (45) H. Okamura, J. Phys. Conf. Ser. 359, 012013 (2012).
- (46) S. Kimura and H. Okamura, J. Phys. Soc. Jpn. 82, 021004 (2013).
- (47) Y. Ikemoto, T. Moriwaki, T. Hirono, S. Kimura, K. Shinoda, M. Matsunami, N. Nagai, T. Nanba, K. Kobayashi, and H. Kimura, Infrared Phys. Tech. 45, 369 (2004).
- (48) T. Moriwaki and Y. Ikemoto, Infrared Phys. Tech. 51, 400 (2008).
- (49) Due to strong absorption by the diamond anvil, the spectral range between 0.23 and 0.3 eV could not be measured well. Therefore, the spectra in this range were interpolated as indicated by the broken curves in Figs. 3(b) and 4(b). It is clear from Figs. 3(c) and 4(c) that these interpolations have only minor effects on the obtained .
- (50) E. J. Singley, D. N. Basov, E. D. Bauer, and M. B. Maple, Phys. Rev. B 65, 161101(R) (2002).
- (51) H. Okamura, A. Takigawa, E. D. Bauer, T. Moriwaki, and Y. Ikemoto, J. Phys.: Conf. Ser. 592, 012001 (2015).
- (52) To make the plots, the following data have been used. =290 mJ/K2mol for CeCoIn5 at 0 GPa,basov =10 mJ/K2mol for LaCoIn5,nakatsuji =382 mJ/K2mol for CeRhIn5 at 2 GPa,fisher and =5.7 mJ/K2mol for LaRhIn5.115-sc
- (53) S. Nakatsuji, unpublished data.
- (54) R. A. Fisher, F. Bouquet, N. E. Phillips, M. F. Hundley, P. G. Pagliuso, J. L. Sarrao, Z. Fisk, and J. D. Thompson, Phys. Rev. B 65, 224509 (2002)
- (55) H. Okamura, T. Michizawa, T. Nanba, and T. Ebihara, J. Phys. Soc. Jpn. 73, 2045 (2004).
- (56) In Ref. 139-pressure, , only the magnetic part of the resistivity () at high is reported. Therefore, we used the resistivity of LuNi3Ga9 at =0 (Ref. 139-ohara, ) as the non-magnetic part () to obtain the total resistivity , and the corresponding dc conductivity. In addition, data at 3 GPa are not given in Ref. 139-pressure, , so we estimated at 3 GPa based on the data at =0, 4, and 6 GPa given in Ref. 139-pressure, .
- (57) H. Okamura, R. Kitamura, M. Matsunami, H. Sugawara, H. Harima, H. Sato, T. Moriwaki, Y. Ikemoto, T. Nanba, J. Phys. Soc. Jpn. 80, 084718 (2011).
- (58) T. Iizuka, T. Mizuno, B. H. Min, Y. S. Kwon, S. Kimura, J. Phys. Soc. Jpn. 81, 043703 (2012).
- (59) =80 and 230 mJ/K2mol at =3 and 6 GPa, respectively,139-gamma were used.
- (60) H. Yamaoka, Y. Yamamoto, E. F. Schwier, F. Honda, Y. Zekko, Y. Ohta, J.-F. Lin, M. Nakatake, H. Iwasawa, M. Arita, K. Shimada, N. Hiraoka, H. Ishii, K.-D. Tsuei, and J. Mizuki, Phys. Rev. B 92, 235110 (2015).
- (61) K. Nishiyama, T. Mito, G. Pristas, T. Koyama, K. Ueda, T. Kohara, S. Gabani, K. Flachbart, H. Fukazawa, Y. Kohori, N. Takeshita, N. Shitsevalova, and H. Ikeda, Phys. Rev. B 93, 121111(R) (2016).
- (62) J. R. Schrieffer and P. A. Wolff, Phys. Rev. 149, 491 (1966).
- (63) This is because the negatively charged surrounding of an Yb or Ce becomes closer to the electrons at high , causing more Coulomb repulsion between the electron and the surrounding. Note that an Yb or Ce is positively charged locally, since it provides a few electrons into the spatially extended band. Hence the surrounding of an Yb or Ce should be negatively charged locally.
- (64) A. Miyake, F. Honda, R. Settai, K. Shimizu, and Y. nuki, J. Phys. Soc. Jpn. 81, SB054 (2012).
- (65) C. Dallera, E. Annese, J.-P. Rueff, A. Palenzona, G. Vanko, L. Braicovich, A. Shukla, and M. Grioni, Phys. Rev. B 68, 245114 (2003).
- (66) H. Okamura, M. Nagata, A. Tsubouchi, Y. nuki, Y. Ikemoto, and T. Moriwaki, arXiv:1909.11857.