An analysis of the performance of coupled cluster methods for core excitations and core ionizations using standard basis sets
Abstract
An extensive analysis has been carried out of the performance of standard families of basis sets with the hierarchy of coupled cluster methods CC2, CCSD, CC3 and CCSDT in computing selected Oxygen, Carbon and Nitrogen K-edge (vertical) core excitation and ionization energies within a core-valence separated scheme in the molecules water, ammonia, and carbon monoxide. Complete basis set limits for the excitation energies have been estimated via different basis set extrapolation schemes. The importance of scalar relativistic effects has been established within the spin-free exact two-component theory in its one-electron variant (SFX2C-1e).
I Introduction
Core-level spectroscopy, including techniques such as Near-Edge Absorption Fine Structure and X-ray Photoelectron spectroscopies, is widely used in various areas of contemporary research, such as in surface science, organic electronics, and medical biological research Bergmann et al. (2017). It is considered a powerful tool to gain insight into the electronic structure of molecular species. The recent improvements of the synchrotron radiation sources and the emergence of the free-electron laser have further broadened the range of phenomena and systems that can be studied by core-level spectroscopy, see e.g. Refs.Bergmann et al. (2017); Van Kuiken et al. (2012); Piancastelli et al. (2010); Milne et al. (2014); van Bokhoven and Lamberti (2016); Wolf et al. (2017); Chergui and Collet (2017); Lin et al. (2017); Kraus et al. (2018). An essential requirement for a successful application of core-level techniques is the availability of reliable computational methods that allow for a proper interpretation of the resulting spectra. Several quantum chemical approaches exist for the calculation of core-excited/ionized states. While referring to Ref. 10 for a recent review, we mention here as examples the symmetry-adapted cluster configuration interaction (SAC-CI) Kuramoto et al. (2005), the GW approximation (self-energy approximated by Green-function G and screened Coulomb W) to the Bethe–Salpeter equation Vinson et al. (2011); Gilmore et al. (2015), the static-exchange (STEX) approach Ågren et al. (1997), and the restricted and unrestricted algebraic diagrammatic construction scheme (ADC) Schirmer (1982); Dreuw and Wormit (2015); Wenzel et al. (2014, 2015) up to third order exploiting the core–valence separation (CVS) Cederbaum et al. (1980) approximation. Large systems are often treated with time-dependent density functional theory (TD-DFT) Stener et al. (2003); Ekström et al. (2006); Ekström and Norman (2006); Tu et al. (2007); Liang et al. (2011); Besley and Asmuruf (2010); Lestrange et al. (2015), but the results are plagued by the self-interaction error and the arbitrary dependence on the choice of the exchange-correlation functional. Indeed, unless short-range corrected hybrid functionals are used Besley et al. (2009), core-excited states calculated by TD-DFT with conventional functionals often reproduce experimental spectra qualitatively well, but the self-interaction error and the small gap between occupied and unoccupied electronic levels inherent in the TD-DFT formalism lead to underestimation of core-excited states. Therefore absolute core excitation energies obtained by conventional TD-DFT are typically corrected by shifting them tens of eVs in order to agree with experiment. Among the time-independent DFT-based approaches for core excitations, we mention the recently proposed, and remarkably accurate, variational orthogonality constrained density functional theory method of Evangelista and co-workers Derricotte and Evangelista (2015); Evangelista et al. (2013), see also the work of Glushkov, Assfeld and coworkers on orthogonality constrained/local Hartree-Hock Self-Consistent-Field Glushkov and Assfeld (2015, 2017); Ferré and Assfeld (2002); Glushkov and Assfeld (2012). Over the last eight years, we have made a significant effort to extend the applicability of the coupled cluster linear response (CC-LR) Koch and Jørgensen (1990); Christiansen et al. (1998) and equation-of-motion coupled-cluster (EOM-CC) Stanton and Bartlett (1993); Bartlett (2012); Krylov (2008) formalisms to the computation of core-level spectroscopies Coriani et al. (2012, 2012); Fransson et al. (2013); List et al. (2014); Coriani and Koch (2015, 2016); Myhre et al. (2016); Wolf et al. (2017); Myhre et al. (2018); Vidal et al. (2019); Liu et al. (2019); Faber and Coriani (2019); federica2019. The CC ansatz is known to provide a systematic hierarchy of models with increasing accuracy, allowing for the prediction of molecular properties and spectra with controlled accuracy within the hierarchy Helgaker et al. (2012); Christiansen et al. (1998); Helgaker et al. (2004).
With the introduction in 2015 of CVS and restricted-excitation-window schemes within CC-LR and EOM-CC Coriani and Koch (2015, 2016); Peng et al. (2015), the use of CC methods for the determination of core-absorption spectra and core ionization energies has become as straightforward as it is for UV-vis excitations. Since the computational determination of spectroscopic observables related to the interaction of the sample with X-ray radiation displays strong dependence on the level of theory and size of the basis sets, a systematic approach becomes particularly attractive. An important component to this end is a rigorous assessment of the basis set requirements and the relative accuracy of the various CC approximations, when computing core spectra using the different members of the CC(-LR) hierarchy. This study is meant as a contribution in this direction, in the spirit of a similar study conducted within the ADC formalism Wenzel et al. (2015).
II Methodology and Computational Details
Calculations of core excitation energies, oscillator strengths (in length gauge) and ionization energies (IE) have been performed for the hierarchy of CC methods: coupled cluster singles and approximate doubles (CC2), coupled cluster singles and doubles (CCSD), coupled cluster singles, doubles and approximate triples (CC3), and coupled cluster singles, doubles and triples (CCSDT). All methods are extensively described in the literature, see e.g. Refs.53; 54; 55; 56; 57; 58; 59, and we refrain therefore from repeating their derivation here. We limit ourselves to draw the reader’s attention to Ref. 43 for the description of how the core-valence separation scheme used here has been implemented within CC-LR/CC-EOM, to Ref. 60 for a new, more efficient, implementation of CC3, and to Refs. 61; 62 for efficient implementation of the CCSDT method. Scalar-relativistic effects have been taken into account in the CCSDT using the spin-free exact two-component theory in its one-electron variant (SFX2C-1e)Dyall (1997); Liu and Peng (2009); Cheng and Gauss (2011).
All calculations up to CC3 have been run with a development version of the Dalton code Aidas et al. (2014), whereas the CFOUR Stanton et al. (2015) code was used for the CCSDT core excitation and ionization energies, respectively. Accurate experimental equilibrium geometries were adopted for all three systems: (CO) = 1.12832 Å for CO; (NH) = 1.011 Å and = 106.7∘ for ammonia; (OH) = 0.9570 Å and = 104.5∘ for water.
III Results and discussion
III.1 Excitation energies
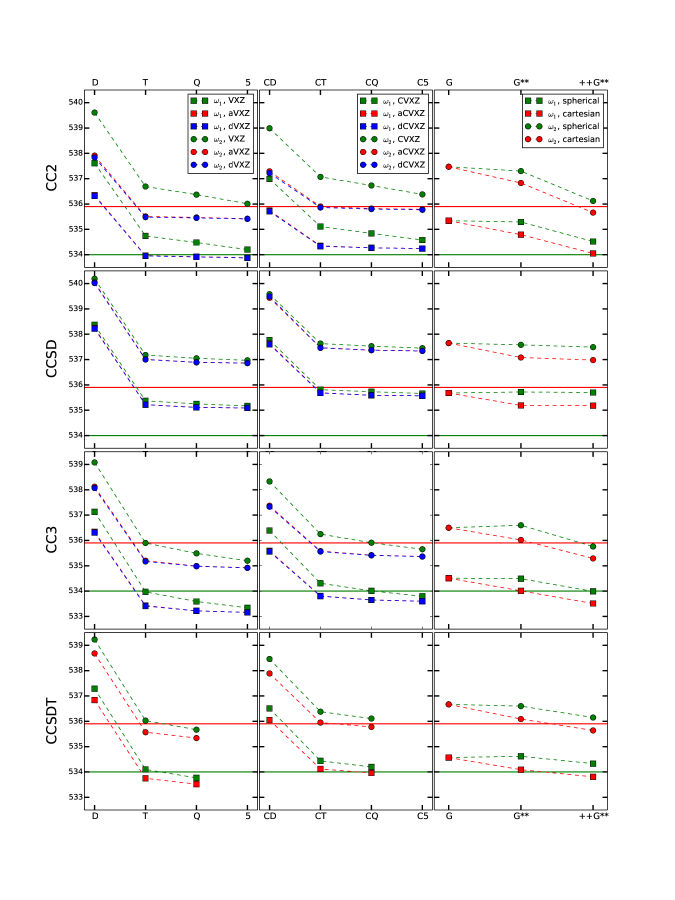
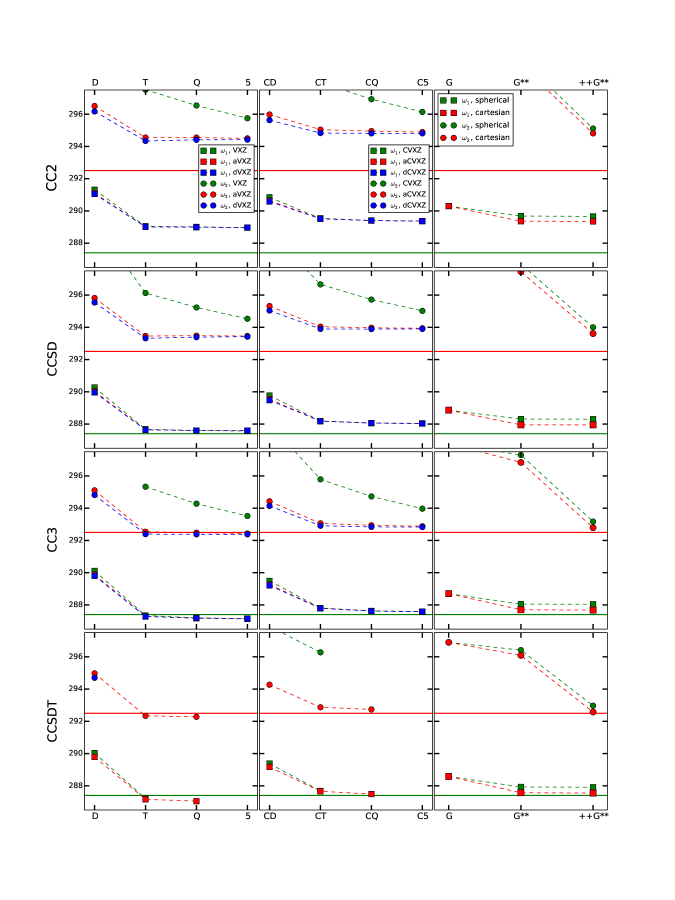
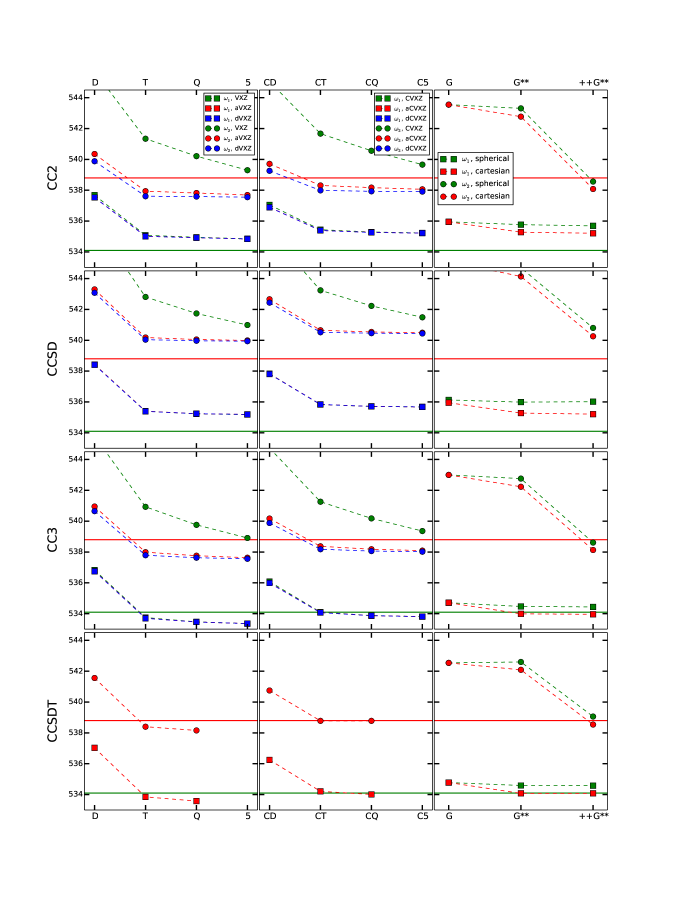
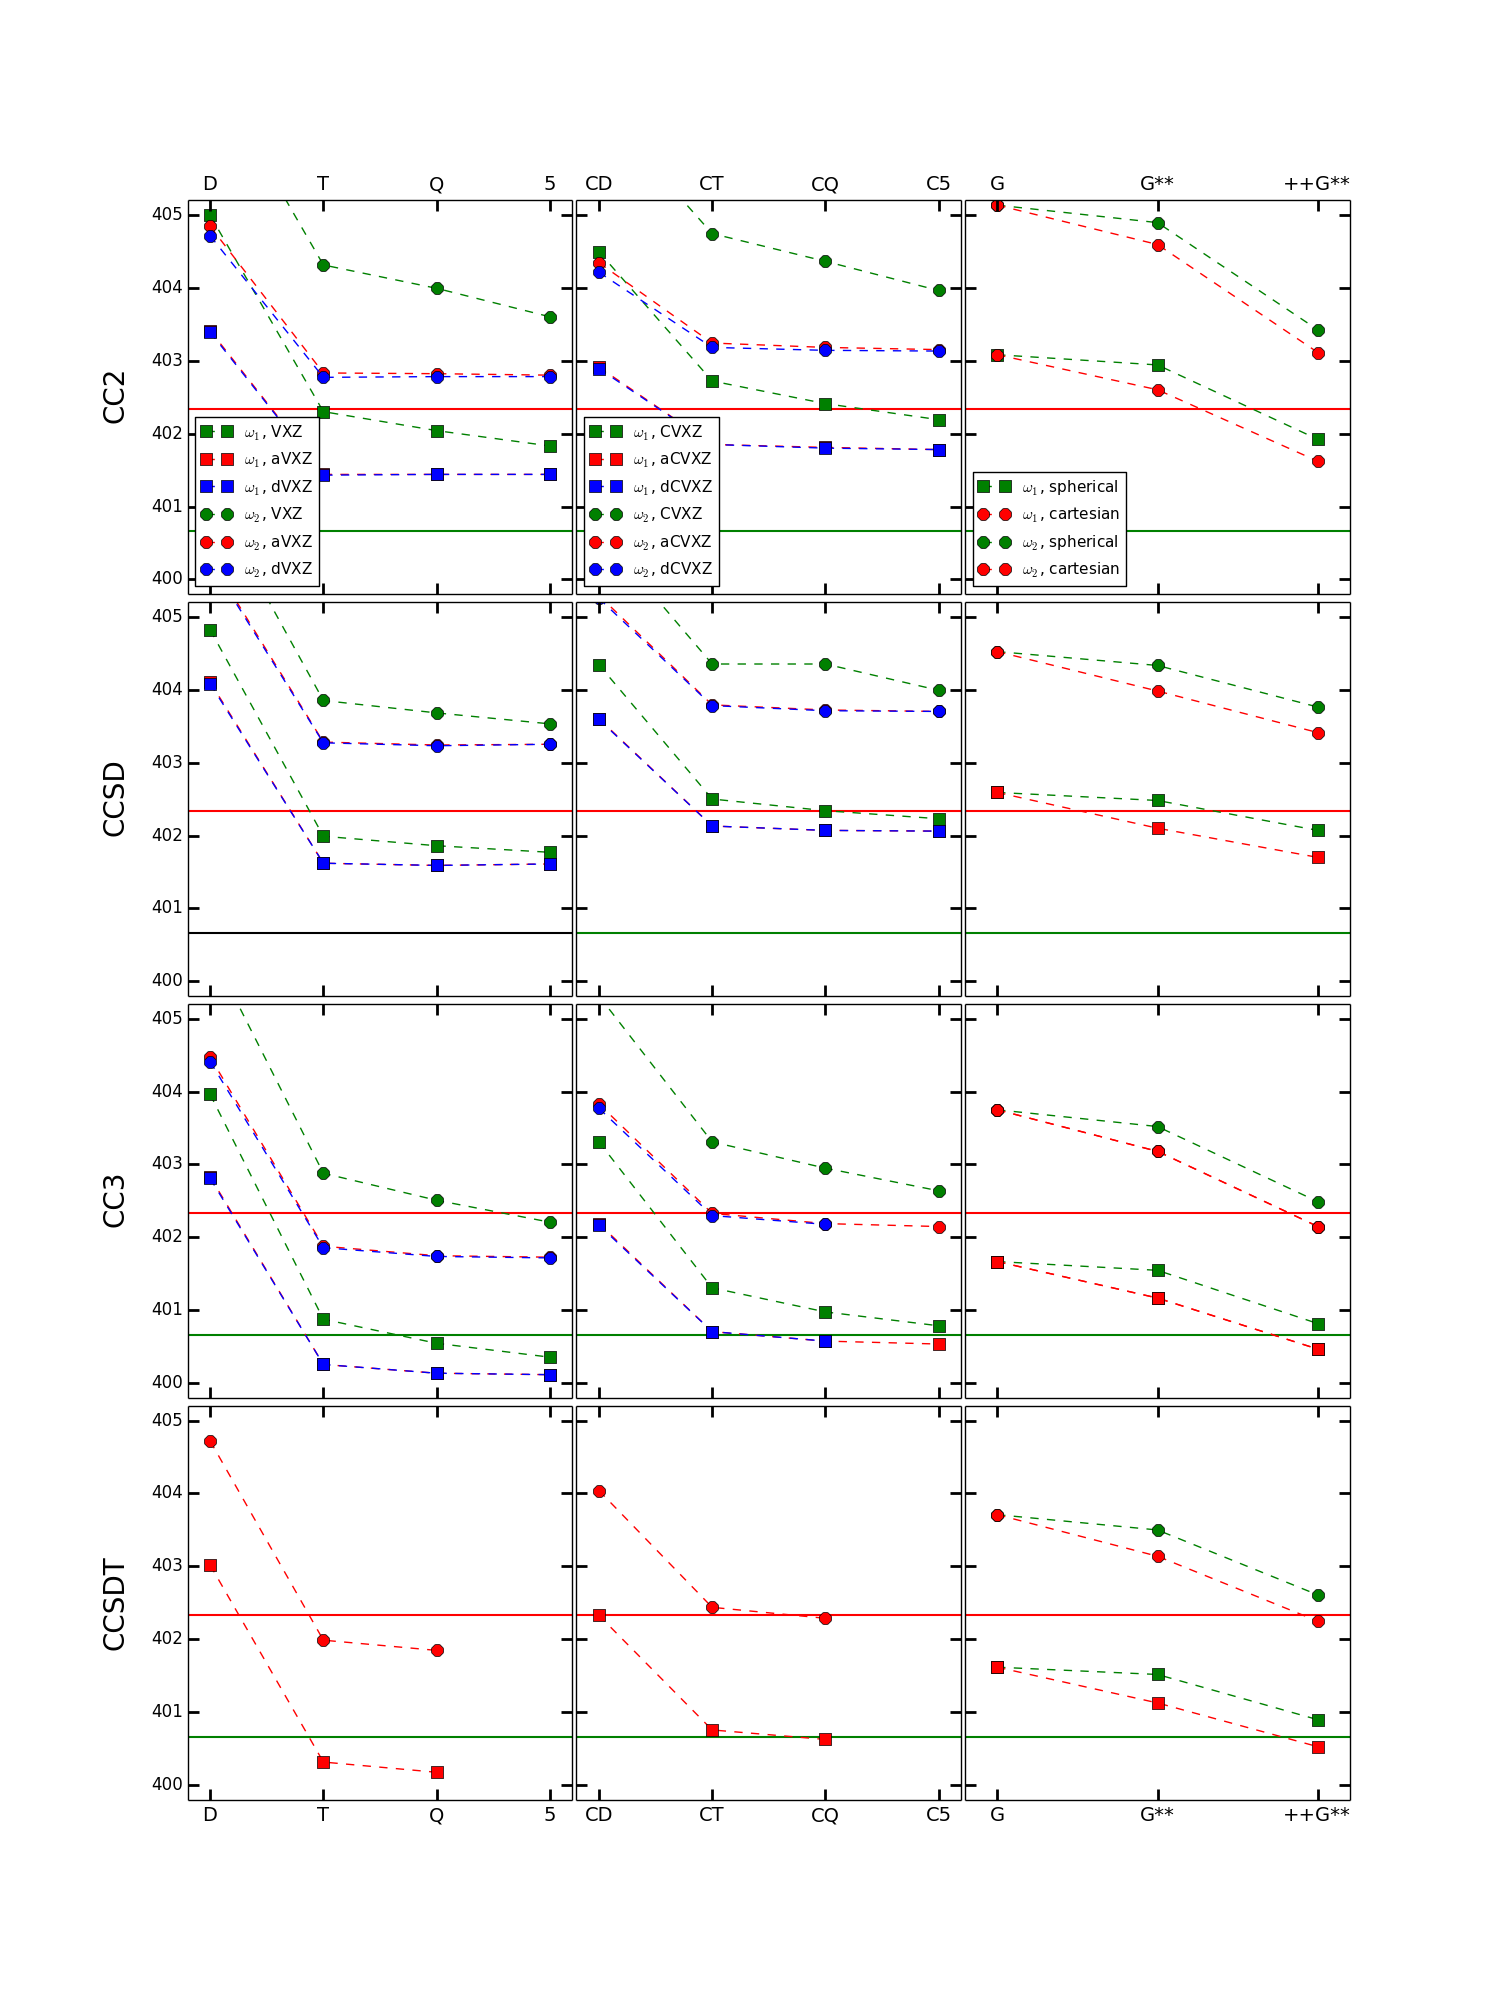
We start our discussion with a detailed comparison of the computed excitation energy values using the different basis sets across the CC hierarchy and with respect to the experimentally derived values. To this end, we plot in Figs. 1 to 4 the trends within each basis set family and method for the considered excitation energies. We will focus our discussion primarily on core excitations that are individually resolved in the experimental spectra: the 1s3s (a1) and 1s3p (b2) transitions in water, the 1s transition for both C and O of CO, and the first three core excitations in NH3. The third intense peak in the X-ray absorption spectrum of H2O is known to originate from the overlap of core transition into a1 and b1 states and will be commented upon in Section III.3. The full set of numerical values of the core-excitation energies is available on arXiv Carbone et al. (2019).
Within each series of correlation consistent (cc) basis sets (regular, single augmented and double augmented), we observe an almost monotonically-decreasing trend (towards the experimental value) while increasing the basis set cardinal number.
In the cc-pVDZ basis, the excitation energies are always overestimated, by 2 to 5 eV depending on the case, with respect to both the other members of the series and the experimental values. By further increasing the cardinal number, the differences within each series reduce to tenths or hundredths of an eV. In other words, any Dunning set of X3 is reasonably accurate, and the results are significantly improved by inclusion of the first level of augmentation. Double augmentation has moderate effects for the chosen core excitations.
For the 1s3s(a1) in water, for instance, the differences between the CCSD results obtained for X=2 (DZ) and X=3 (TZ) in the series cc-pVXZ are always of the order of 3 eV, and slightly lower than 2 eV for the cc-pCVXZ series, progressively reducing to tenths and hundredths of an eV when increasing X. With reference to the experimental value for the same excitation, the basis sets with X=2 overestimate the edge by ca. 3.5–4.5 eV (depending on the basis); for X3, the deviation is reduced to ca. 1.0–1.2 eV for the (x-aug-)cc-pVXZ sets, and to ca. 1.5–1.7 eV for the (singly and doubly augmented) cc-pCVXZ sets.
The trend observed for the first excitation is roughly the same also for the second one. However, for the third and fourth core excitations of water (third peak in the experimental spectrum), as well as any higher lying excitations of more diffuse/Rydberg character than those considered here, it becomes of paramount importance to include additional diffuse functions Coriani et al. (2012); Vidal et al. (2019); federica2019.
Among the Pople basis sets, the 6-311++G** set emerges as remarkably accurate in basically all cases (states and methods) despite its moderate size, as also previously observed for the ADC family of methods Wenzel et al. (2014). Use of Cartesian functions is to be slightly preferred.
The CCSD model systematically overestimates all core excitation energies (roughly of the same amount for all excitations), allowing for a ’rigid–shift’ correction. The CC2 core excitation energies tend to be smaller than the CCSD ones, and they can be both red-shifted and blue-shifted compared to their experimental counterparts. For the first excitation, they are, at first sight, also closer to the experimental value, but the peak separation is underestimated. As we will see in Section III.3, this, together with the results for intensities, actually results in a poor comparison of the CC2 spectral profile with the experimental one, at least for the three systems considered here.
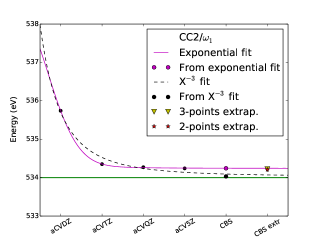
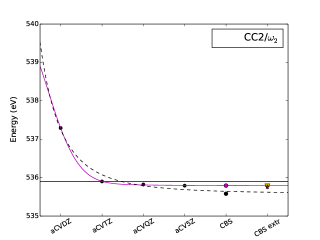
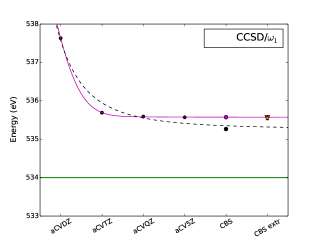
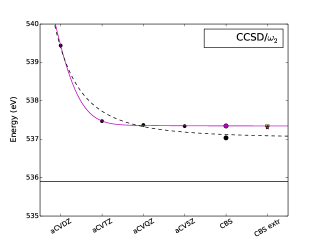
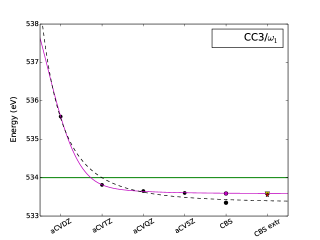
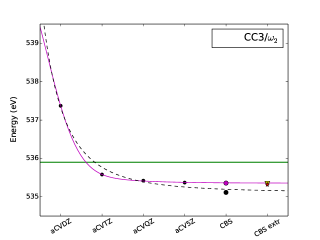
III.2 Extrapolation towards the complete basis set (CBS) limits
As observed in Section III.1, the results in the cc basis sets show a monotonically decreasing behaviour when increasing the cardinal number. The cc basis sets are known to yield a systematic convergence towards the complete basis set limit for the correlation energy of the ground state, as well as for other molecular properties, and various extrapolation formulae have been proposed in the literature. Some of these formulae tend to overestimate the limit, and others to underestimate it. Inspired by the analysis performed by Wenzel et al. for the ADC hierarchies Wenzel et al. (2014), we have considered whether two popular extrapolations formulas, namely the X-3 formula Helgaker et al. (1997) and the exponential formula Peterson et al. (1994),
| (1) | ||||
| (2) |
can be applied to obtain an estimate of the CBS values of the core excitation energies considered in this study. In Eqs. 1 and 2, is the resulting estimated energy of the CBS limit, and is the calculated energy using the basis with the cardinal number X.
The two formulas have been applied in different ways in the literature for different properties. One can fit directly the results of each basis set series, imposing the functional forms in Eq. 1. Alternatively, one can derive the CBS limits via either a two point strategy (on the X-3 formula) or three point strategy (on the exponential formula), using the energy values relative to the two (three) highest values of the cardinal numbers: X = Q, 5 for the two-point extrapolation, and X=T, Q, 5 for the three point extrapolation. In the following, we have considered both strategies.
Notice that in standard basis set extrapolation schemes Helgaker et al. (1997); Peterson et al. (1994), the exponential and X-3 formulae apply to Hartree-Fock and correlation energies, respectively. Since a separation of the excitation energies into HF and correlation contributions are not straightforward, we apply the formulae directly to the computed excitation energies. It is also important to bear in mind that these extrapolation formulae are not rigorous expressions for the basis set dependence of energies, but serve as an estimate of the trend.
In Fig. 5 we show the results obtained for one selected basis set family, the aug-cc-pCVXZ one, for all four CC methods in the case of the water molecule. The trends observed for CO (both edges) and NH3 are completely analogous and can be found in the document on the arXiv Carbone et al. (2019). The CBS values obtained directly from the two points X-3 or three points exponential procedures are basically identical, and only marginally different from those obtained by fitting with the exponential regression over the entire series. This difference is slightly larger than what was observed by Wenzel et al. Wenzel et al. (2014) for the ADC methods.
By fitting the results with a X-3 formula, on the other hand, we could not reproduce the behaviour of the excitation energies.
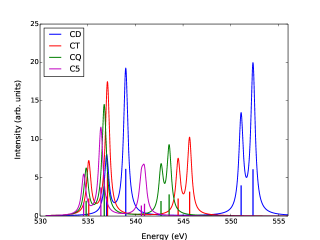
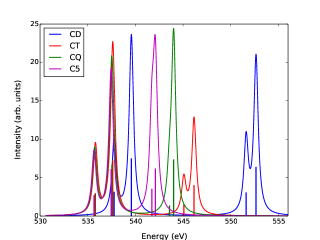
III.3 Spectral bands
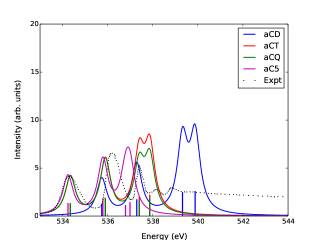
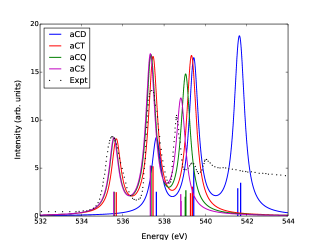
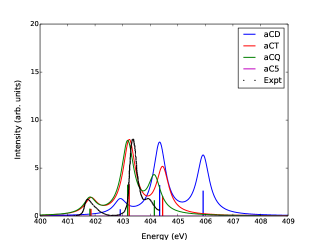
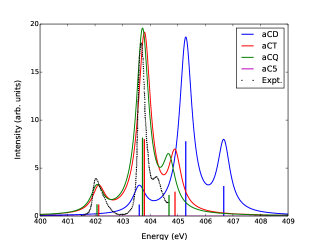
For comparison and assignment of the experimental spectra, the intensities of the absorption bands are required, and they are here obtained from the computed oscillator strengths. The full set of oscillator strengths obtained for the different basis sets at the CC2 and CCSD levels are available on the arXiv.
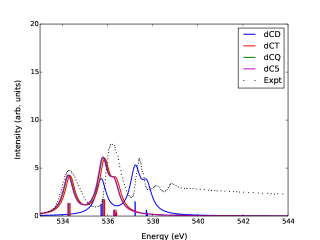
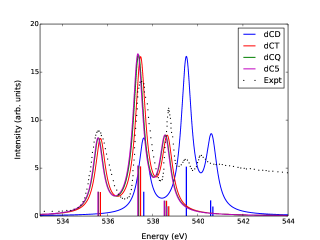
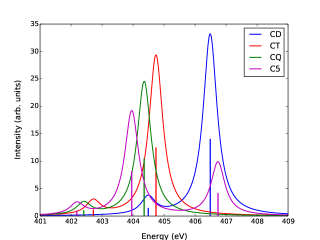
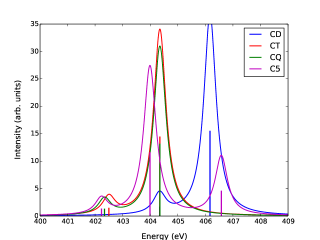
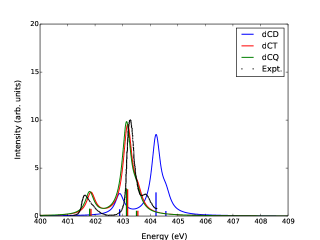
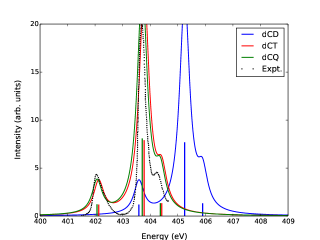
Spectral simulations based on oscillator strengths for the molecules H2O and NH3 computed in the cc-pCVXZ, aug-cc-pCVXZ and d-aug-cc-pCVXZ bases are shown in Fig. 6, and 7. They were obtained using a Lorentzian broadening function with a half-width-half-maximum of 0.01 a.u.
For the first two transitions of water, the CCSD oscillator strengths are practically the same as soon as one set of augmenting functions is added, and little affected by variation of the cardinal number, the largest differences in the spectra being due to variations in the position of the peaks. The situation is quite different for the third peak, which results from the combination of two excitations and has Rydberg character: many basis sets are insufficiently diffuse to yield an accurate description of the oscillator strengths, which are strongly overestimated. Inspection of the symmetry of the excited states also reveals that the third and fourth excited states contributing to the third spectral band switch position energetically in the different basis sets. An efficient strategy to have a good representation of the third band on H2O is to include Rydberg type functions, as done in Ref. Coriani et al. (2012). The CC2 oscillator strengths are more erratic, showing a relative intensity of the peaks at large variance compared to the experimental one, even in the larger basis sets. The CC2 spectra at the O K-edge of H2O are “compressed”, due to the underestimation of the separation between the bands, as it can be appreciated in Fig. 6.
For carbon in CO both the CCSD and the CC2 intensity of the first transition grows slightly within each series as the cardinal number increases. The intensity of the second transition is roughly constant, while large variations are observed for the intensities of the third peak, in particular at CC2 level. For Oxygen, the intense peak has similarly almost constant intensity for all bases at CCSD level, while in the CC2 case some variations are recorded around an average value lower than the CCSD value. The intensities of the second and third peak are extremely low for both methods, and in the CC2 case sometimes even lower than the limit of detection.
Finally, in the case of ammonia (see Fig. 7), at both levels relatively large variations in intensity are observed for the second state (the most intense transition) for the bases lacking diffuse functions, and almost constant values for the other Dunning series. The intensities of the first state are roughly constant with the exception of in the smallest bases, which yield slightly overestimated values. Regarding the third state, the intensity decreases in the singly augmented sets and is almost constant for the doubly augmented ones, an indication of the greater sensitivity of this state to the presence of diffuse functions. The best agreement with the experimental profile is found for the d-aug-cc-pCVQZ basis set (we did not compute the aug-cc-pCV5Z and d-aug-cc-pCV5Z oscillator strengths). At CC2 level, there is in general a greater variation in the intensity, which is significantly smaller than in the CCSD case. Also at the N K-edge of NH3, the peak separation is underestimated, yielding “squeezed” spectral profiles, compared to both CCSD and experiment.
III.4 Ionization energies
Tables 1 and 2 contain the results of the core ionization energies for different basis sets in the CC hierarchy up to CCSDT.
| H2O | NH3 | |||||||
| Basis set | CC2 | CCSD | CC3 | CCSDT | CC2 | CCSD | CC3 | CCSDT |
| VDZ | 539.15 | 543.31 | 541.21 | 541.77 | 406.58 | 408.66 | 407.15 | 407.45 |
| VTZ | 537.56 | 540.67 | 538.54 | 539.04 | 404.65 | 406.30 | 404.69 | 404.90 |
| VQZ | 537.57 | 540.77 | 538.33 | 538.94 | 404.69 | 406.40 | 404.60 | – |
| V5Z | 537.55 | 540.85 | 538.25 | – | 404.70 | 406.49 | 404.59 | – |
| CVDZ | 539.15 | 542.70 | 540.46 | 540.97 | 406.07 | 408.16 | 406.50 | 406.76 |
| CVTZ | 537.92 | 541.14 | 538.90 | 539.40 | 405.05 | 406.82 | 405.12 | 405.33 |
| CVQZ | 537.91 | 541.26 | 538.76 | – | 405.04 | 406.89 | 405.04 | – |
| CV5Z | 537.90 | 541.35 | 538.70 | – | 405.04 | 406.95 | – | – |
| aVDZ | 539.88 | 544.08 | 541.31 | 542.31 | 406.59 | 409.01 | 407.24 | 407.71 |
| aVTZ | 537.61 | 541.00 | 538.49 | 539.23 | 404.70 | 406.51 | 404.72 | 405.02 |
| aVQZ | 537.59 | 540.91 | 538.31 | 539.02 | 404.71 | 406.49 | 404.61 | 404.89 |
| aV5Z | 537.56 | 540.89 | 538.24 | – | 404.71 | 406.52 | – | – |
| aCVDZ | 539.27 | 543.45 | 540.56 | 541.51 | 406.09 | 408.52 | 406.60 | 407.02 |
| aCVTZ | 537.98 | 541.47 | 538.87 | 539.61 | 405.10 | 407.03 | 405.17 | 405.47 |
| aCVQZ | 537.93 | 541.40 | 538.73 | 539.46 | 405.06 | 406.98 | 405.05 | 405.34 |
| aCV5Z | 537.91 | 541.38 | 538.69 | – | 405.05 | 406.97 | – | – |
| 6-311G | 538.16 | 541.07 | 539.15 | – | 405.19 | 406.77 | 405.32 | – |
| 6-311G** | 537.99 | 540.92 | 539.01 | – | 405.02 | 406.61 | 405.15 | – |
| 6-311++G** | 538.09 | 541.46 | 538.97 | – | 405.09 | 406.92 | 405.19 | – |
| Carbon | Oxygen | |||||||
|---|---|---|---|---|---|---|---|---|
| Basis set | CC2 | CCSD | CC3 | CCSDT | CC2 | CCSD | CC3 | CCSDT |
| VDZ | 299.02 | 299.32 | 298.53 | 298.49 | 542.01 | 546.59 | 543.89 | 544.72 |
| VTZ | 297.17 | 296.98 | 295.99 | 295.88 | 539.92 | 543.71 | 541.19 | 541.83 |
| VQZ | 297.26 | 297.08 | 295.98 | 295.88 | 539.92 | 543.68 | 541.66 | 541.66 |
| V5Z | 297.27 | 297.12 | – | – | 539.89 | 543.67 | – | – |
| CVDZ | 298.46 | 298.81 | 297.80 | 297.73 | 541.40 | 545.97 | 543.14 | 543.91 |
| CVTZ | 297.64 | 297.54 | 296.48 | 296.38 | 540.28 | 544.18 | 541.55 | 542.19 |
| CVQZ | 297.65 | 297.59 | 296.44 | 296.34 | 540.25 | 544.18 | – | – |
| CV5Z | 297.66 | 297.61 | – | – | 540.24 | 544.18 | – | – |
| aVDZ | 299.04 | 299.34 | 298.49 | 298.46 | 542.16 | 546.83 | 543.98 | 543.93 |
| aVTZ | 297.20 | 297.04 | 296.00 | 295.90 | 539.96 | 543.79 | 541.18 | 541.86 |
| aVQZ | 297.28 | 297.11 | 295.999 | 295.90 | 539.94 | 543.71 | 541.02 | 541.68 |
| aV5Z | 297.29 | 297.14 | – | – | 539.90 | 543.69 | – | – |
| aCVDZ | 298.50 | 298.84 | 297.80 | 297.76 | 541.54 | 546.20 | 543.22 | 544.12 |
| aCVTZ | 297.68 | 297.62 | 296.53 | 296.43 | 540.32 | 544.27 | 541.57 | 542.25 |
| aCVQZ | 297.66 | 297.61 | 296.44 | 296.36 | 540.27 | 544.21 | 541.44 | 542.12 |
| aCV5Z | 297.66 | 297.62 | – | – | 540.25 | 544.19 | – | – |
Inspection of the results clearly reveals, also for the IE, the inaccuracy of the double zeta basis sets for the core IE: for all three edges (C, N and O) and at all CC levels the X=D basis sets overestimate the IEs by in between 1 to 3 eV. The largest improvement is observed for X=T, whereas going beyond triple- has either moderate or negligible effect, and so also does the inclusion of single augmentation.
Moving along the CC hierarchy, we note that the CCSD IEs are significantly larger (1.5–4 eV) than the CC2 ones for both O and N, whereas for the C K-edge they are just slightly smaller (a few tenths of eV). Inclusion of triple excitations at the approximate CC3 lowers the IEs by 2.5–2.8 eV for O, by 1.6–1.9 eV for N, and 1.0 eV for C. Inclusion of the full treatment of triples by CCSDT, on the other hand, increases the CC3 results by a constant amount (independent of the basis set) of 0.7 eV for the O edge, 0.3 eV for the N edge; the C-edge IEs, on the other hand, are further reduced by 0.1 eV.
Comparing with the experimental results, we observe that in the case of Carbon both CC2 and CCSD overestimate the IE; CC3 and CCSDT either overestimate or underestimate the IE, depending on the basis set, by a few tenths of eV.
The core IEs of the two types of oxygen K-edge (H2O and CO) are significantly understimated (ca 2 eV) at the CC2 level, and overestimated (1.5–2 eV) at the CCSD level. For X T, the CC3 results are 1.0-1.5 eV lower than experiment. The CCSDT results in the largest core-valence set are about 0.3 eV from experiment (and relativistic effects are 0.3 eV).
The N-edge IE is underestimated by 0.5–1.0 eV at the CC2 level, and overestimated by 1.0–1.5 eV at the CCSD level. The CC3 estimates are very similar to the CC2 ones, and around 0.5 eV off in the core-valence bases. The agreement with experiment is further improved by full inclusion of triple excitations: in the aug-cc-pVQZ basis the CCSDT IE is 0.26 eV lower than the experimental IE.
The importance of scalar relativistic effects is illustrated in Table 3. As previously observed Coriani et al. (2012); Myhre et al. (2018); Liu et al. (2019), the relativistic effect is core-specific and practically the same independent of the chosen method and basis set. The effect is to increase the IEs in all cases, which can be ascribed to the contraction, and thereby stabilization, of the core orbitals.
| Nonrel | SFX2C-1e | Rel | Nonrel | SFX2C-1e | Rel | |
| O(H2O) | N(NH3) | |||||
| CCSD/aVTZ | 541.03 | 541.39 | 0.36 | 406.51 | 406.73 | 0.22 |
| CCSD/aVQZ | 540.91 | 541.30 | 0.39 | 406.50 | 406.71 | 0.21 |
| CCSD/aV5Z | 540.90 | 541.28 | 0.38 | 406.52 | 406.73 | 0.21 |
| CCSD/aCVTZ | 541.48 | 541.86 | 0.38 | 407.03 | 407.24 | 0.21 |
| CCSD/aCVQZ | 541.40 | 541.79 | 0.39 | 406.99 | 407.20 | 0.21 |
| CCSD/aCV5Z | 541.38 | 541.77 | 0.39 | 406.98 | 407.19 | 0.21 |
| CCSDT/aVTZ | 539.23 | 539.61 | 0.38 | 405.02 | 405.23 | 0.21 |
| CCSDT/aVQZ | 539.02 | 539.40 | 0.38 | 404.89 | 405.10 | 0.21 |
| CCSDT/aCVTZ | 539.61 | 540.00 | 0.39 | 405.47 | 405.68 | 0.21 |
| CCSDT/aCVQZ | 539.46 | 539.85 | 0.39 | 405.34 | 405.55 | 0.21 |
| O(CO) | C(CO) | |||||
| CCSD/aVTZ | 543.79 | 544.17 | 0.38 | 297.04 | 297.14 | 0.10 |
| CCSD/aVQZ | 543.71 | 544.10 | 0.39 | 297.11 | 297.21 | 0.10 |
| CCSD/aV5Z | 543.69 | 544.07 | 0.38 | 297.14 | 297.24 | 0.10 |
| CCSD/aCVTZ | 544.27 | 544.65 | 0.38 | 297.62 | 297.72 | 0.10 |
| CCSD/aCVQZ | 544.21 | 544.59 | 0.38 | 297.61 | 297.71 | 0.10 |
| CCSD/aCV5Z | 544.19 | 544.57 | 0.38 | 297.62 | 297.72 | 0.10 |
| CCSDT/aVTZ | 541.86 | 542.25 | 0.39 | 295.90 | 295.99 | 0.09 |
| CCSDT/aVQZ | 541.68 | 542.06 | 0.38 | 295.90 | 295.99 | 0.09 |
| CCSDT/aCVTZ | 542.25 | 542.63 | 0.38 | 296.43 | 296.53 | 0.10 |
| CCSDT/aCVQZ | 542.12 | 542.50 | 0.38 | 296.36 | 296.46 | 0.10 |
IV Concluding remarks
We have carried out a coupled cluster investigation of the performance of the standard hierarchy CC2-CCSD-CC3-CCSDT in connection with conventional Dunning correlation-consistent and Pople basis sets to yield accurate vertical core excitation energies (and strengths) and core-ionization energies for N, C and O K-edges in the prototypical molecules H2O, CO and NH3. Complete basis set limit values have been derived.
The use of singly augmented triple-zeta basis sets is sufficiently accurate for the low-energy core excitations, which are of limited or no Rydberg character. The Pople set 6-311++G** set provides results of quality almost comparable as the aug-cc-pVTZ set, but at lower computational cost.
Acknowledgements
S.C. acknowledges financial support from the AIAS-COFUND program (Grant Agreement No. 609033) and from the Independent Research Fund Denmark, DFF-Forskningsprojekt2 (Grant No. 7014–00258B). H.K. acknowledges financial support from the FP7-PEOPLE-2013-IOF funding scheme (Project No. 625321) and a visiting professorship grant at DTU Chemistry from the Otto Mønsted Foundation. RHM acknowledges computer time from NOTUR through Project No. nn2962k. The COST Actions No. MP1306 “Modern Tools for Spectroscopy on Advanced Materials (EUSPEC)”, CM1204 “XUV/X-ray light and fast ions for ultrafast chemistry (XLIC)” and CM1405 “MOLIM–Molecules in Motion” are also acknowledged.
References
- Bergmann et al. (2017) X-Ray Free Electron Lasers: Applications in Materials, Chemistry and Biology; Bergmann, U., Yachandra, V., Yano, J., Eds.; Energy and Environment Series 18; Royal Society of Chemistry, 2017
- Van Kuiken et al. (2012) Van Kuiken, B. E.; Huse, N.; Cho, H.; Strader, M. L.; Lynch, M. S.; Schoenlein, R. W.; Khalil, M. J. Phys. Chem. Lett. 2012, 3, 1695–1700
- Piancastelli et al. (2010) Piancastelli, M.; Simon, M.; Ueda, K. J Electron Spectros Relat Phenomena 2010, 181, 98–110
- Milne et al. (2014) Milne, C.; Penfold, T.; Chergui, M. Coord. Chem. Revi. 2014, 277-278, 44–68
- van Bokhoven and Lamberti (2016) X-Ray Absorption and X-ray Emission Spectroscopy; Theory and Applications; van Bokhoven, J., Lamberti, C., Eds.; Wiley & Sons, 2016
- Wolf et al. (2017) Wolf, T. et al. Nature Commun. 2017, 8, 1–7
- Chergui and Collet (2017) Chergui, M.; Collet, E. Chem. Rev. 2017, 117, 11025–11065
- Lin et al. (2017) Lin, F.; Liu, Y.; Yu, X.; Cheng, L.; Singer, A.; Shpyrko, O. G.; Xin, H. L.; Tamura, N.; Tian, C.; Weng, T. C.; Yang, X. Q.; Meng, Y. S.; Nordlund, D.; Yang, W.; Doeff, M. M. Chem. Rev. 2017, 117, 13123–13186
- Kraus et al. (2018) Kraus, P. M.; Zürch, M.; Cushing, S. K.; Neumark, D. M.; Leone, S. R. Nature Reviews Chemistry 2018, 2, 82–94
- Norman and Dreuw (2018) Norman, P.; Dreuw, A. Chem. Rev. 2018, 118, 7208–7248
- Kuramoto et al. (2005) Kuramoto, K.; Ehara, M.; Nakatsuji, H. J. Chem. Phys. 2005, 122, 014304
- Vinson et al. (2011) Vinson, J.; Rehr, J. J.; Kas, J. J.; Shirley, E. L. Phys. Rev. B: Condens. Matter Mater. Phys. 2011, 83, 115106
- Gilmore et al. (2015) Gilmore, K.; Vinson, J.; Shirley, E.; Prendergast, D.; Pemmaraju, C.; Kas, J.; Vila, F.; Rehr, J. Computer Physics Communications 2015, 197, 109–117
- Ågren et al. (1997) Ågren, H.; Carravetta, V.; Vahtras, O.; Pettersson, M. L. G. Theor. Chem. Acc. 1997, 97, 14–40
- Schirmer (1982) Schirmer, J. Phys. Rev. A 1982, 26, 2395–2416
- Dreuw and Wormit (2015) Dreuw, A.; Wormit, M. WIREs Comput Mol Sci 2015, 5, 82–95
- Wenzel et al. (2014) Wenzel, J.; Wormit, M.; Dreuw, A. J. Comput. Chem. 2014, 35, 1900
- Wenzel et al. (2015) Wenzel, J.; Holzer, A.; Wormit, M.; Dreuw, A. J. Chem. Phys. 2015, 142, 214104
- Cederbaum et al. (1980) Cederbaum, L. S.; Domcke, W.; Schirmer, J. Phys. Rev. A: At. Mol. Opt. Phys. 1980, 22, 206–222
- Stener et al. (2003) Stener, M.; Fronzoni, G.; de Simone, M. Chem. Phys. Lett. 2003, 15, 115
- Ekström et al. (2006) Ekström, U.; Norman, P.; Carravetta, V.; Ågren, H. Phys. Rev. Lett. 2006, 97, 143001
- Ekström and Norman (2006) Ekström, U.; Norman, P. Phys. Rev. A 2006, 74, 042722
- Tu et al. (2007) Tu, G.; Rinkevicius, Z.; Vahtras, O.; Ågren, H.; Ekström, U.; Norman, P.; Carravetta, V. Phys. Rev. A 2007, 76, 022506
- Liang et al. (2011) Liang, W.; Fischer, S. A.; Frisch, M. J.; Li, X. J. Chem. Theory Comput. 2011, 7, 3540–3547
- Besley and Asmuruf (2010) Besley, N. A.; Asmuruf, F. A. Phys. Chem. Chem. Phys. 2010, 12, 12024
- Lestrange et al. (2015) Lestrange, P. J.; Nguyen, P. D.; Li, X. J. Chem. Theory Comput. 2015, 11, 2994–2999
- Besley et al. (2009) Besley, N. A.; Gilbert, A. T.; Gill, P. M. J. Chem. Phys. 2009, 130, 124308
- Derricotte and Evangelista (2015) Derricotte, W. D.; Evangelista, F. A. Phys. Chem. Chem. Phys. 2015, 17, 14360–14374
- Evangelista et al. (2013) Evangelista, F. A.; Shushkov, P.; Tully, J. C. J. Phys. Chem. A 2013, 117, 7378–7392
- Glushkov and Assfeld (2015) Glushkov, V. N.; Assfeld, X. Theor. Chem. Accounts 2015, 135, 3
- Glushkov and Assfeld (2017) Glushkov, V. N.; Assfeld, X. J. Phys. B: At. Mol. Opt. Phys. 2017, 50, 125101
- Ferré and Assfeld (2002) Ferré, N.; Assfeld, X. J. Chem. Phys. 2002, 117, 4119–4125
- Glushkov and Assfeld (2012) Glushkov, V. N.; Assfeld, X. J. Comp. Chem. 2012, 33, 2058–2066
- Koch and Jørgensen (1990) Koch, H.; Jørgensen, P. J. Chem. Phys. 1990, 93, 3333–3344
- Christiansen et al. (1998) Christiansen, O.; Jørgensen, P.; Hättig, C. Int. J. Quantum Chem. 1998, 98, 1
- Stanton and Bartlett (1993) Stanton, J. F.; Bartlett, R. J. J. Chem. Phys 1993, 98, 7029–7039
- Bartlett (2012) Bartlett, R. J. WIREs Comput. Mol. Sci. 2012, 2, 126–138
- Krylov (2008) Krylov, A. I. Ann. Rev. Phys. Chem. 2008, 59, 433–462
- Coriani et al. (2012) Coriani, S.; Christiansen, O.; Fransson, T.; Norman, P. Phys. Rev. A 2012, 85, 022507
- Coriani et al. (2012) Coriani, S.; Fransson, T.; Christiansen, O.; Norman, P. J. Chem. Theory Comput. 2012, 8, 1616
- Fransson et al. (2013) Fransson, T.; Coriani, S.; Christiansen, O.; Norman, P. J. Chem. Phys. 2013, 138, 124311
- List et al. (2014) List, N. H.; Coriani, S.; Kongsted, J.; Christiansen, O. J. Chem. Phys. 2014, 141, 244107
- Coriani and Koch (2015) Coriani, S.; Koch, H. J. Chem. Phys. 2015, 143, 181103
- Coriani and Koch (2016) Coriani, S.; Koch, H. J. Chem. Phys. 2016, 145, 149901
- Myhre et al. (2016) Myhre, R. H.; Coriani, S.; Koch, H. J. Chem. Theory Comput. 2016, 12, 2633–2643
- Myhre et al. (2018) Myhre, R. H.; Wolf, T. J.; Cheng, L.; Nandi, S.; Coriani, S.; Gühr, M.; Koch, H. J. Chem. Phys. 2018, 148, 064106
- Vidal et al. (2019) Vidal, M. L.; Feng, X.; Epifanovsky, E.; Krylov, A. I.; Coriani, S. J. Chem. Theory Comput. 2019, 15, 3117
- Liu et al. (2019) Liu, J.; Matthews, D.; Coriani, S.; Cheng, L. J. Chem. Theory and Comput. 2019, 15, 1642–1651
- Faber and Coriani (2019) Faber, R.; Coriani, S. J. Chem. Theory Comput. 2019, 15, 520–528
- Helgaker et al. (2012) Helgaker, T.; Coriani, S.; Jørgensen, P.; Kristensen, K.; Olsen, J.; Ruud, K. Chem. Rev. 2012, 112, 543–631
- Helgaker et al. (2004) Helgaker, T.; Jørgensen, P.; Olsen, J. Molecular Electronic Structure Theory; Wiley, 2004
- Peng et al. (2015) Peng, B.; Lestrange, P. J.; Goings, J. J.; Caricato, M.; Li, X. J. Chem. Theory Comput. 2015, 11, 4146
- Christiansen et al. (1995) Christiansen, O.; Koch, H.; Jørgensen, P. Chem. Phys. Lett. 1995, 243, 409
- Purvis and Bartlett (1982) Purvis, G. D.; Bartlett, R. J. J. Chem. Phys. 1982, 76, 1910
- Koch et al. (1996) Koch, H.; Sánchez de Merás, A.; Helgaker, T.; Christiansen, O. J. Chem. Phys. 1996, 104, 4157
- Christiansen et al. (1996) Christiansen, O.; Koch, H.; Halkier, A.; Jørgensen, P.; Helgaker, T.; Sánchez de Merás, A. J. Chem. Phys. 1996, 105, 6921
- Koch et al. (1997) Koch, H.; Christiansen, O.; Jørgensen, P.; de Merás, A. S.; Helgaker, T. J. Chem. Phys. 1997, 106, 1808
- Christiansen et al. (1995) Christiansen, O.; Koch, H.; Jørgensen, P. J. Chem. Phys. 1995, 103, 7429–7441
- Kucharski et al. (2001) Kucharski, S. A.; Włoch, M.; Musiał, M.; Bartlett, R. J. J. Chem. Phys. 2001, 115, 8263–8266
- Myhre and Koch (2016) Myhre, R. H.; Koch, H. J. Chem. Phys. 2016, 145, 044111
- Matthews and Stanton (2015) Matthews, D. A.; Stanton, J. F. J. Chem. Phys. 2015, 142, 064108
- Baraban et al. (2016) Baraban, J. H.; Matthews, D. A.; Stanton, J. F. J. Chem. Phys. 2016, 144, 111102
- Dyall (1997) Dyall, K. G. J. Chem. Phys. 1997, 106, 9618–9626
- Liu and Peng (2009) Liu, W.; Peng, D. J. Chem. Phys. 2009, 131, 031104
- Cheng and Gauss (2011) Cheng, L.; Gauss, J. J. Chem. Phys. 2011, 135, 084114
- Aidas et al. (2014) Aidas, K. et al. WIREs Comput. Mol. Sci. 2014, 4, 269
- Stanton et al. (2015) Stanton, J. et al. CFOUR, Coupled-Cluster techniques for Computational Chemistry, 2015. http://www.cfour.de/
- Carbone et al. (2019) Carbone, J. P.; Cheng, L.; Myhre, R. H.; Matthews, D.; Koch, H.; Coriani, S. An analysis of the performance of coupled cluster methods for K-edge core excitations and ionizations using standard basis sets: Additional Tables and Figures., 2019
- Helgaker et al. (1997) Helgaker, T.; Klopper, W.; Koch, H.; Noga, J. J. Chem. Phys. 1997, 106, 9639
- Peterson et al. (1994) Peterson, K. A.; Woon, D. E.; Dunning, T. H. J. Chem. Phys. 1994, 100, 7410–7415
- Schirmer et al. (1993) Schirmer, J.; Trofimov, A.; Randall, K.; Feldhaus, J.; Bradshaw, A. M.; Ma, Y.; Chen, C. T.; Sette, F. Phys. Rev. A 1993, 47, 1136