Dynamic Force Measurements on Swimming Chlamydomonas Cells using Micropipette Force Sensors
Abstract
Flagella and cilia are cellular appendages that inherit essential functions of microbial life including sensing and navigating the environment. In order to propel a swimming microorganism they displace the surrounding fluid by means of periodic motions, while precisely-timed modulations of their beating patterns enable the cell to steer towards or away from specific locations. Characterizing the dynamic forces, however, is challenging and typically relies on indirect experimental approaches. Here, we present direct in vivo measurements of the dynamic forces of motile Chlamydomonas reinhardtii cells in controlled environments. The experiments are based on partially aspirating a living microorganism at the tip of a micropipette force sensor and optically recording the micropipette’s position fluctuations with high temporal and sub-pixel spatial resolution. Spectral signal analysis allows for isolating the cell-generated dynamic forces associated to the periodic motion of the flagella from background noise. We provide an analytic elasto-hydrodynamic model for the micropipette force sensor and describe how to obtain the micropipette’s full frequency response function from a dynamic force calibration. Using this approach, we find dynamic forces during the free swimming activity of individual Chlamydomonas reinhardtii cells of pN resulting from the coordinated flagellar beating with a frequency of Hz. This dynamic micropipette force sensor (DMFS) technique generalises the applicability of micropipettes as force sensors from static to dynamic force measurements, yielding a force sensitivity in the piconewton range. In addition to measurements in bulk liquid environment, we study the dynamic forces of the biflagellated microswimmer in the vicinity of a solid/liquid interface. As we gradually decrease the distance of the swimming microbe to the interface, we measure a significantly enhanced force transduction at distances larger than the maximum extend of the beating flagella, highlighting the importance of hydrodynamic interactions for scenarios in which flagellated microorganisms encounter surfaces.
I Introduction
Microbial motility governs a variety of phenomena in microbiology, biophysics, as well as many other fields of research, and has been studied intensively for decades Purcell [1977], Berg [1975]. The propulsion of bacteria, microalgae, nematodes and other single- and multicellular microorganisms in a liquid medium can be either realized by the periodic motion of cellular appendages such as flagella and cilia, as for single-flagellated spermatozoa and the multiflagellated model microbes E. coli and C. reinhardtii, or by oscillatory shape changes, e.g. in case of the model nematode C. elegans Lauga [2009]. Microbes exhibit rich dynamics in their motility patterns. The perception of gradients of, for example, chemicals, light intensity or fluid flow, may cause precisely-timed modulations of the periodic motions of cellular appendages. In consequence, microbes can navigate towards regions of high nutrient concentration (chemotaxis) Berg [1972], Alon [1999], optimal light intensity (phototaxis) Foster [1984] or align relative to fluid flow (rheotaxis) Miki [2013]. The study of microbial motility in general, and the response of motile microbes to environmental cues in particular, calls for experimental methods allowing to characterize the magnitude of the periodic forces underlying microbial propulsion. However, directly measuring the dynamic forces generated by cellular appendages of motile microbes is challenging due to the size of the organisms and the magnitude of the forces, which are often just a few microns and piconewton, respectively. Moreover, measuring the forces generated by motile cells in their planktonic state, i.e. freely swimming in a liquid medium, demands for experimental techniques that do not rely on supporting the cell by a substrate as in conventional atomic force microscopy approaches Alsteens [2017], Krieg [2019]. Ultimately, one wishes to quantify also the modulations of these forces due to environmental cues, which requires simultaneous access to chemical composition, light intensity, fluid flow or other relevant parameters in the vicinity of the swimming microorganism.
To date, experimental techniques for characterizing the swimming motility of microbes largely rely on optical measurements and on the trapping of self-propelled cells by optical tweezers Ashkin [1987], Min [2009], Stellamanns [2014]. Chlamydomonas reinhardtii, a unicellular, photoactive microalga with a cell diameter of about 8 to 10 µm featuring two anterior flagella, is a prime model organism in microbial motility studies. Measurements of its swimming dynamics have been carried out by tracking the cell body Rüeffer [1985], Minoura [1995], Polin [2009], Guasto [2010], Ostapenko [2018], particle imaging velocimetry (PIV) of the fluid around the organism Guasto [2010], Drescher [2010], Brumley [2014], and by analyzing the spatiotemporal changes of the flagella shape during its swimming strokes Rüeffer [1985], Rueffer [1987], Polin [2009], Goldstein [2009], Bayly [2011], Brumley [2014], Wan [2014, 2014]. The main drawback of these methods is their indirect approach, requiring a model for the flagellar hydrodynamics, typically using slender-body and resistive force theory Johnson [1979], to obtain estimates of the acting forces. Direct force measurements on C. reinhardtii have so far only been realized using optical tweezers McCord [2005]. This approach, however, is limited to the measurement of the maximum (escape) force per cell and cannot provide time-resolved force measurements. Since biophysical techniques enabling truly direct force measurements are lacking to date, a conclusive picture of the mechanics and coordination of cilia and flagella, which control microbial motility, still remains elusive Wan [2018]. This includes an ongoing debate whether hydrodynamic or steric contact forces dominate the interaction of puller-type microswimmers with interfaces, as well as their impact on microbial navigation in confined spaces Kantsler [2013], Contino [2015].
Attaching individual microorganisms to hollow glass micropipettes by applying a negative pressure on the inside of the pipette is a common technique to keep motile cells in the focal plane of the microscope. It allows to track the dynamics of their freely beating cilia or flagella Rueffer [1987], Polin [2009], Goldstein [2009], Bayly [2011], Brumley [2014], Wan [2014, 2014]. In principle, forces can be measured simultaneously through the deflection of the micropipette. However, previous works utilizing such micropipette force sensors Colbert [2009, 2010], Backholm [2013], Kreis [2018], Petit [2018], Backholm [2019], Kreis [2019] were limited to quasi-static measurements. In this case the damping of the micropipette cantilever by hydrodynamic drag forces remains negligible, and forces can be directly recovered from the cantilever deflection and its static spring constant. In the context of microbial propulsion, such micropipette force sensors have been applied successfully to the millimetre-sized nematode C. elegans Schulman [2014, 2014], Backholm [2015], which has a typical beating frequency of about 2 Hz only Schulman [2014]. Many flagellated and ciliated micro-swimmers, however, operate at much higher frequencies. In addition, they generate forces that are smaller by about two to three orders of magnitude, compared to the reported nanonewton propulsion forces of C. elegans. Time-resolved measurements of such forces have been impossible so far because hydrodynamic drag forces become significant in the frequency range of the cantilever actuation.
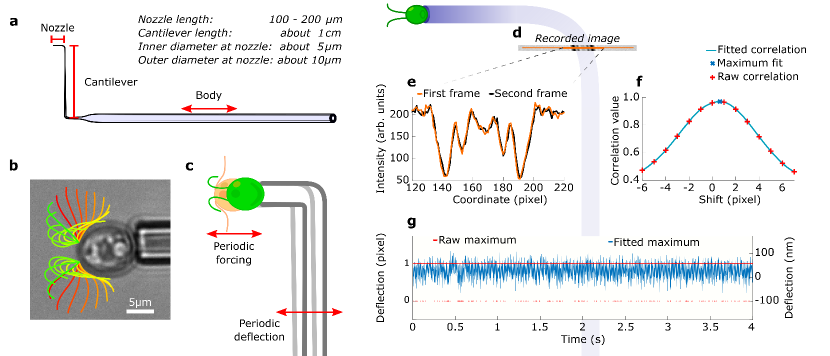
Here, we present the first direct measurements of the dynamic forces originating from the periodic flagella beating of a living microorganism. A highly flexible, double-L-shaped micropipette serves as a calibrated dynamic force cantilever. An individual C. reinhardtii cell is attached to the tip of the micropipette such that forces exerted in the direction of its regular swimming motion are orthogonal to the cantilever arm, see Fig. 1a to c. The pipette deflection is recorded optically with high spatial and temporal resolution. We establish a versatile method for a full calibration of the micropipette’s frequency response function and show that signal analysis in Fourier space allows for isolating the signal caused by the beating flagella of C. reinhardtii from external vibrations and background noise fluctuations. This novel experimental approach enables direct measurement of dynamic forces in the piconewton range, generated by flagellated cells at high frequencies. Simultaneously, important environmental control parameters can be accessed. We resolve the forces generated by the beating flagella of C. reinhardtii as a function of their distance to a solid interface, elucidating the nature of wall interaction mechanisms of puller-type microswimmers.
II Signatures of Cell-Generated Dynamic Forces
II.1 Dynamic Micropipette Force Sensors
The micropipette force sensor used to measure the dynamic forces exerted by the cell’s flagella is custom-made, largely following the recipes for quasi-static force measurements Backholm [2019]. A glass capillary tube is pulled asymmetrically to achieve a long tapered end. Using a microforge, the tapered micropipette is cut to size and bend twice by 90∘, yielding the typical double-L shape shown in Fig. 1a. Alterations of the pulling speed and variations in the shaping of the cantilever allow to adjust the nozzle size and cantilever stiffness. The force sensor is immersed in a liquid cell mounted onto an inverted microscope, which is supported by an active vibration-cancelling table. By attaching a syringe to the pipette and placing it below the level of the liquid cell, i.e. by using a hydrostatic pressure difference, a motile C. reinhardtii cell can be partially aspirated at the tip of the micropipette force sensor. Both flagella beat freely in the liquid medium during all experiments, see Fig. 1b.
II.2 Data Acquisition & Signal Analysis
We now measure the oscillatory forces and flagella beating frequency of C. reinhardtii cells in bulk conditions. In order to extract the micropipette deflection during the microbe’s swimming motion, we record the micropipette cross-section close to the nozzle with a 40x objective, see Fig. 1d and e. A set of data consists of cross-section images taken at frames per second (fps), resulting in an observation time of about 82 seconds. We determine the micropipette’s deflection for any given frame as the shift of the current pipette position relative to the pipette position in the first frame using a cross-correlation analysis of the intensity profiles of the pipette cross-section, see Fig. 1f, following established protocols Kreis [2018], Backholm [2019]. Determining the micropipette position as precisely as possible is crucial for the accuracy of the dynamic force measurement. We find that the pixel-wise correlation analysis, where the maximal correlation alternates between two pixels, does not result in a sufficient spatial resolution and introduces an error in the force measurements. Interpolating the correlation curve and extracting the shift corresponding the the maximum of the interpolation, however, reveals a fluctuating signal with sub-pixel resolution, see Fig. 1g.
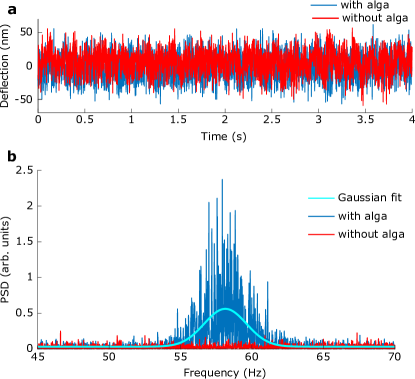
While the micropipette deflection with and without a cell attached appear similar in real space, see Fig. 2a, a distinct signal originating from the oscillatory forcing of the flagella can be identified in the frequency domain, see Fig. 2b. The single-sided power spectrum (normalized squared Fourier coefficients, abbreviated as PSD) of the micropipette fluctuations displays a clear cell signal in the frequency range between 50 to 65 Hz, which agrees well with the typical flagella beating frequency of C. reinhardtii Rüeffer [1985]. This signal disappears once the cell is released from the micropipette nozzle. The Fourier transformation of an -pointed array used to calculate the power spectrum is defined as
| (1) |
Note that despite the fact that all experiments were performed using an active vibration-cancelling table, the full power spectrum may still show signatures of building vibrations at low frequencies and/or electrical devices (e.g. camera fans) at high frequencies. Since none of these external signals fall into the frequency range associated to the flagella beating, they do not interfere with the signal originating from the cell in Fourier space. The beating frequency of the flagella fluctuates over time and the frequency distribution may well be described by a Gaussian distribution Wan [2014], thus, we use a Gaussian fit to extract the cell signal and isolate it from external noise, see Fig. 2b. The fit function of the Gaussian distribution is defined as
| (2) |
with amplitude , mean beating frequency , variance and constant offset . By subtracting the offset from the fit, we eliminate the white noise contribution from the power spectrum. Based on the Gaussian fit to the experimental data, the signal analysis in the power spectrum allows to quantify the flagella’s beating its variance through the parameters and . Using Parseval’s theorem, we can also extract the signal power associated to the oscillatory beating of the flagella as the area of the Gaussian curve minus the offset:
| (3) |
The associated error of is calculated using error propagation of the uncertainties of the fit parameters and . Note that the power spectrum, along with , is given in units of squared deflection, since we have not yet taken into account the frequency response and spring constant of the micropipette cantilever. Also, it is important to distinguish between periodic forcing and mean propulsion force generated by the beating flagella. Due to the definition of the Fourier transform, is composed of forces exerted by the beating flagella that can be constructed from superposition of sinusoidal functions. Consequently, only captures the oscillatory forcing of the flagella motion with zero mean forcing. Note that the mean propulsive force is ideally a constant offset in the pipette deflection (or a peak at zero frequency in the power spectrum) and cannot be readily accessed with this approach.
III Dynamic Force Calibration
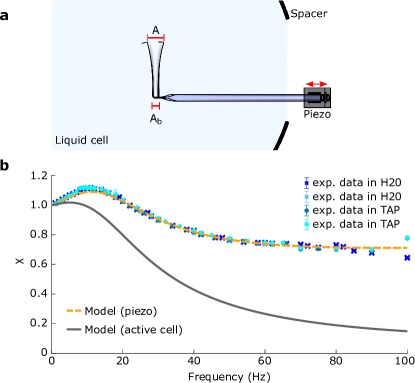
In order to convert the pipette fluctuations into forces, the micropipette force sensor has to be calibrated. For static and quasi-static force measurements, i.e. at low frequencies of at most a few Hz, it suffices to determine the micropipette’s spring constant . The static calibration is performed by utilizing the changing weight of an evaporating water droplet attached to the tip of the micropipette Kreis [2018], Backholm [2019]. Typical spring constants of the pipettes used in our experiments are around 1 nN/µm. Performing measurements on the dynamics of cellular appendages at high frequencies requires a full characterization of the micropipette’s frequency response. Determining the frequency response under the exact same conditions found throughout an experiment, i.e. with an oscillating forcing applied to the pipette nozzle and a stationary micropipette base, is experimentally challenging. We quantify the frequency response under more accessible boundary conditions, where the micropipette is actuated inside the liquid cell with a sinusoidal motion at its clamped body by a closed-loop piezo actuator, as shown in Fig. 3a. The experimental calibration data can then be translated into the response for the boundary conditions found throughout experiments with an active cell using the theoretical model outlined in Section IV. In brief, we model the micropipette force sensor as a tapered, hollow elastic beam that is oscillating in a viscous liquid. The dynamical deflection of the pipette is described with the Kirchhoff equations, coupled to the time-dependent Stokes equations to take viscous and inertial fluid drag into account Sader [1998]. Inertia and hydrodynamic drag of the nozzle are implemented as a localized dynamic loading at the end of the elastic beam. In the model, the boundary conditions found throughout the measurements on active cells correspond to a concentrated time-dependent loading at the tip of a cantilever, while the body of the micropipette is stationary. The calibration measurements correspond to a free tip and a clamped body that is oscillating in normal direction.
Figure 3b shows the frequency response of the micropipette, normalised to the static response. For calibration boundary conditions, i.e. actuation with a piezo, experimental (symbols) and theoretical (dashed line) results are in excellent agreement. For the boundary conditions of experiments with an active cell we calculate the corresponding response of the micropipette cantilever (Fig. 3b, solid line). The error of the response curve is estimated by the mean deviation between the experimental and model calibration data and translated to the active cell case as a relative error.
IV Elasto-Hydrodynamic Model
In order to model the oscillation of the micropipette in a liquid medium, we simplify the pipette geometry, treating the cantilever part as a straight, tapered beam that is oscillating at small amplitude normal to its long axis. The nozzle of the pipette is treated as a long, thin rod that is oscillating in longitudinal direction. Inertial and drag forces from the nozzle are then coupled to the cantilever as a concentrated load at the cantilever’s end, together with the forces generated by attached cells. To model the cantilever motion, we closely follow the approach by Sader Sader [1998], using the Kirchhoff equation for a tapered beam,
| (4) |
Here, is the coordinate along the cantilever of length and is the displacement of the cantilever from its resting position perpendicular to its long axis.
| (5) | ||||
| (6) |
are bending modulus and mass per unit length of the tapered cantilever, respectively. and are Young’s modulus and density of the pipette material, and are inner and outer Radius, respectively, and is the density of the medium inside the pipette. is the spatio-temporal loading distributed along the cantilever, which is given by viscous and inertial drag of the surrounding fluid medium. The spring constant can be derived from the static version of Eq. (4), which is obtained by setting and .
In order to quantify the hydrodynamic drag in the dynamic case, we first analyze the relevant length scales in the problem. These are the amplitude of the oscillation, µm, the outer diameter of the pipette, µm, and the thickness of the viscous boundary layer µm, where is the viscosity of the medium and is the angular frequency of the oscillation. In our case, , which is a small amplitude oscillation in a viscous medium. We define the Reynolds number for the local acceleration term,
| (7) |
and, accordingly, describe the fluid velocity and pressure by the time-dependent Stokes equation Williams [1972], Sader [1998],
| (8) |
supplemented by the continuity equation for an incompressible fluid, , a no-slip boundary condition at the surface of the cantilever, and require a quiescent fluid at large distance. Solving the fluid mechanics problem for the actual shape of the cantilever would require full numerical simulations, coupled to Eq. (4). However, the taper angle of the cantilever is very small and it can locally be approximated by a cylindrical beam, for which analytical solutions to the time dependent Stokes equation exist.
Due to the linearity of Eqs. (4) & (8), they are best solved after Fourier-transformation with respect to time, yielding
| (9) |
and
| (10) |
in which the “ ” indicates transformed quantities and the angular frequency merely acts as a parameter Sader [1998]. The solution of the time-dependent Stokes equation is a lengthy derivation that can be found in Tuck [1969]. Here, we repeat the resulting net load per unit length onto the cantilever Sader [1998],
| (11) |
with the hydrodynamic function that reads, for oscillation perpendicular to the long axis Sader [1998],
| (12) |
where are the modified Bessel functions of the third kind and -th order. Note that in this formulation, and have to be evaluated for the local cross-section and, for a tapered beam, thus depend on .
The boundary conditions are an external load that, together with the hydrodynamic drag of the nozzle, is concentrated at . We approximate the nozzle as a long, thin cylinder of radius and length , and thus describe it by the solution to the axisymmetric version of Stokes’ second problem Tuck [1969]. The boundary condition at is:
| (13) | |||
| (14) |
where is the hydrodynamic function for a long cylinder in axial oscillation and “ ∗ ” denotes conjugation. At the clamped end of the beam at , an oscillation with angular frequency and amplitude is prescribed:
| (15) |
In calibration conditions, and ; in measurement conditions, and . With these boundary conditions, Eq. (9) is solved numerically to obtain the spring constant and resonance curves. Since the resonance curves strongly depend on the pipette geometry, we allow for global additive corrections to the measured geometry parameters, , , , and , that are obtained by fitting the resonance curve to the experimental calibration data. Fitting is performed by a finite differencing scheme of the numerical resonance curves. Importantly, the correction values are constrained to be within the uncertainty of the respective measurements. , , and must fulfil an additional relation that matches the spring constant in the model to the experimentally determined one. The resulting correction values are below one micron for the radii and on the order of µm for the lengths. We provide a Mathematica script as Supplementary Code that demonstrates the numerical solution of the equations above to obtain the calibration and measurement resonance curves displayed in Fig. 3b.
V Oscillatory Forcing of Beating Flagella
The final step of the analysis is the conversion of the signal power , see Section II.2, to physical quantities using the dynamic force calibration outlined above. Note that an inverse Fourier transform does not suffice to recover the motion of the flagella. We have lost the information about the phase throughout the signal analysis by squaring all coefficients to calculate the power spectrum and by fitting the signal with a Gaussian in order to eliminate noise. Instead, we perform a manual inverse Fourier transform by projecting into a sinusoidal with frequency to recover the periodic forcing , using
| (16) |
with spring constant and frequency response . The error of is calculated using error propagation of individual errors of , and , where the error of is taken as the standard deviation of all experimental spring constant calibrations for a given micropipette.
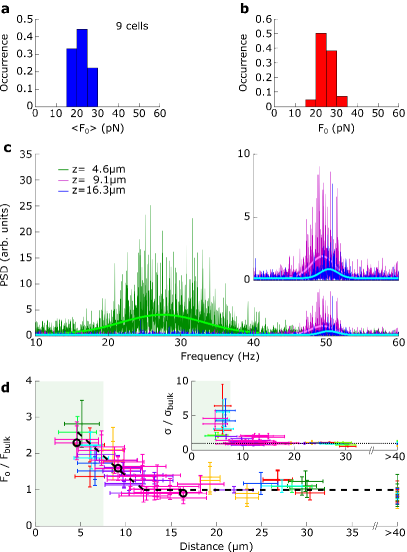
Overall 109 individual measurements with 9 different cells were performed in bulk. The experiments yielded a mean amplitude of the periodic forcing of 23 pN with a standard deviation of 5 pN and a mean beating frequency of 51 Hz with a standard deviation of 6 Hz. Histograms of the mean dynamic force of 9 different cells (at least two measurements per cell) and of 42 measurements of the same cell recorded over a time period of more than two hours are shown in Fig. 4a and b, respectively. Cell-cell variations and variations of the dynamic forces of a single cell over time are larger than the error of individual force measurements (1.8 pN on average).
In the following, we extend our experiments towards dynamic force measurements on living C. reinhardtii cells in the vicinity of a solid wall in order to study the effect of flagella/wall interactions and, in particular, characterize the presence and magnitude of hydrodynamic interactions between beating flagella and the surface of the wall. Figure 4c displays three representative PSDs for the exact same cell, recorded at different distance between the cell body and the surface of a silicon wafer. For m we find a lowered mean beating frequency as compared to the PSD recorded at m, which can be safely considered bulk swimming. Besides the shift of the mean frequency, also the variance of the frequency is found to increase substantially, which indicates that steric interactions alter the regular beating pattern. Interestingly, already at intermediate distances, i.e. m, the signature of the flagella beating in the PSD differs significantly from the bulk measurement, as shown in the inset of Fig. 4c. This is a first indication that hydrodynamic interactions might indeed be detectable in recorded cell signals, given that the flagella of C. reinhardtii only have a maximal forward reach of 7 to 8 µm in the unperturbed beating pattern (see Fig. 1b).
We studied overall 8 different cells at varying distance between the base of the flagella and the wall and recorded the respective dynamic forces following the approach outlined in the previous sections and Eq. (16). Note that we normalise of a given cell by the respective value in bulk conditions to account for cell-cell variations. Based on our results, we consider the experimental data recorded at distances over 15 µm from the wall as bulk measurements. The data for are shown in Fig. 4d, while the inset displays the corresponding normalized variance of the flagella beating frequencies in the PSD. Significant deviations of the forcing from the bulk values occur at distances smaller than about 12 µm from the wall. Below this threshold we find a monotonic increase of the normalized dynamic force for decreasing distance of the beating flagella to the wall. The fact that the dynamic forcing is already significantly enhanced at distances greater than the maximal flagella forward reach of 7 to 8 µm, e.g. we find 3.0 pN at m as compared to 1.9 pN in bulk for the datasets shown in Fig. 4c, strongly suggests an effect of hydrodynamic interactions. In the regime below distances of 7 to 8 µm we expect steric interactions between the flagella and the wall to dominate, in line with the finding that the force transduction is further enhanced ( 4.2 pN for the datasets shown in Fig. 4c). As shown in the inset of Fig. 4d, the normalized variance of the beating frequency abruptly increases at distances of 7 to 8 µm to the wall, which we attribute to flagella desynchronization due to transient flagella-substrate contact during every beating cycle. Thus, as a function of the distance confirms the determination of the maximum forward reach of the flagella from the beating pattern.
VI Discussion
We established a direct experimental approach based on dynamic micropipette force sensors (DMFS) for precise and robust measurements of the dynamic forces generated by periodically beating cellular appendages at high frequencies. The observed mean beating frequency of C. reinhardtii of Hz falls into the expected range of beating frequencies from 40 to 64 Hz Rüeffer [1985] and matches very well the previously reported mean beating frequency of Hz from high-speed cell tracking Guasto [2010]. Our in vivo force measurements on C. reinhardtii yielded a mean amplitude of the periodic forcing of pN provided by the coordinated beating of both flagella. Assuming a sinusoidal functional form of the oscillatory forcing and adding the mean propulsion force as a constant offset, we can construct a minimal model of the instantaneous forcing throughout one beating cycle. By extracting the swimming velocity from cell tracks and applying Stokes drag the mean propulsion force of C. reinhardtii has been estimated to be pN Minoura [1995], which results in a maximum forcing of pN. This value is in quantitative agreement with the measured escape forces of 26 to 31 pN of C. reinhardtii in optical tweezer experiments McCord [2005]. Assuming sinusoidal forcing, our dynamic force measurements yield that 39 % [31 44] (square brackets indicate lowest and highest error bounds) of the beating cycle show negative instantaneous forces, i.e. correspond to the recovery stroke of the beating flagella, which is in accordance with previous calculations of the mean instantaneous cell body speed Guasto [2010] as well as hydrodynamic simulations Geyer [2013].
In conclusion, we provided the first direct measurements of the dynamic forces of swimming microorganisms originating from the beating of their flagella, in varying environmental conditions. We established our experimental approach for C. reinhardtii cells in bulk liquid swimming conditions. With this approach we measured the dynamic forces exerted by a pair of beating flagella in the vicinity of a solid surface.
The natural habitats of many microorganisms, including soil-dwelling C. reinhardtii microalgae, are confined spaces. Consequently, their navigation and motility is governed by frequent interactions with the confining walls. By characterizing the nature of the interactions of flagellated puller-type microbes encountering surfaces quantitatively, we are able to gain new insights regarding the microbial motility in complex natural and physiological environments. We find a gradual increase of the dynamic force transduction as we decrease the flagella-wall distance, well before steric contact interactions might take over, and attribute this regime to the presence of hydrodynamic interactions. This finding is relevant far beyond the microbial domain since eukaryotic flagella are well-preserved phenotypical features that exist in virtually all eukaryotic life forms, including the human body.
On the methodological side, we developed a novel experimental approach for direct dynamic force measurements with pN resolution, extending the applicability of micropipette force sensors from quasi-static to dynamic force measurements. The provided calibration protocol for determining the full frequency response function of the force sensor ultimately enables these quantitative dynamic force measurements. Under controlled experimental conditions the DMFS method allows for extracting periodic forces from the power spectrum of the micropipette deflection data, after isolating the signal from background noise. The force measurements are based on the optical readout of the micropipette deflection with sub-pixel resolution, yielding a force sensitivity in the range of a few piconewton.
The experimental technique is highly versatile and allows to vary physiologically relevant parameters, such as illumination, exposure to drugs, external flow, and proximity to interfaces, even during on-going measurements. In combination with the ability to perform repeated measurements per cell over extended periods of time, DMFS appears as a unique tool to systematically quantify the effect of these parameters on microbial propulsion and the activity of cellular appendages. In the future, the full optical access to the biological sample may allow for simultaneously combining dynamic force measurements with flagella tracking, PIV measurements as well as contrast-enhanced optical techniques to observe the biological processes at work. Since DMFS can be readily implemented into existing experimental setups and by using tailored micropipette force sensors with customiszed geometry and sensitivity, we expect that in the future DMFS can be employed to measure dynamic forces of a variety of living systems, including microorganisms of different size and shape.
VII Acknowledgements
The authors are grateful to K. Dalnoki-Veress, K. Wan, B. Friedrich, H. Nobach and M. Lorenz for discussions. M.M. Makowski is acknowledged for technical assistance. The Göttingen Algae Culture Collection (SAG) kindly provided the C. reinhardtii wild-type strain SAG 11-32b.
O.B. conceived the project. T.J.B. and O.B. designed the experiments. T.J.B. performed the experiments and analyzed the data. T.J.B. and S.K. developed the dynamical model. T.J.B., C.T.K., Q.M. and O.B. developed the measurement protocol. T.J.B. wrote the first draft of the paper. All authors contributed to the preparation of the manuscript.
VIII Appendix: Materials & Methods
VIII.1 Cell cultivation
All experiments have been performed with wild-type Chlamydomonas reinhardtii strain SAG 11-32b. Axenic cell cultures were grown in tris-acetate-phosphate (TAP) medium (reference number A13798-01, Thermo Fisher Scientific, USA) on a 12:12 h day-night cycle in a Memmert IPP 100Plus incubator (Memmert, Germany). The daytime temperature was set to 24∘C with a light intensity of 1 to photons/m2s. During the night cycle, the light intensity was zero and the temperature was reduced to 22∘C. Experiments have been performed during the daytime with vegetative cells in the logarithmic growth phase on the second to fourth day after incubation. Cells were suspended in a liquid cell filled with TAP under ambient conditions (24 – 26∘C).
VIII.2 Micropipette fabrication & calibration consistency checks
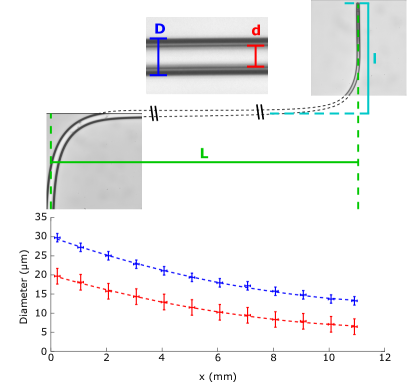
The micropipette cantilevers were custom-made and adjusted in size and stiffness. A blank glass capillary (TW100-6, World Precision Instruments, USA, outer diameter 1 mm, inner diameter 0.75 mm) was pulled to the desired diameter using a micropipette puller (P-97, Sutter Instruments, USA). During the pipette pulling process, one side of the capillary was held stationary, while the other side was slowly pulled away. This yielded one short and one long, tapered pipette. Using a microforge (MF-900, Narishige Group, Japan), the long pipette was cut to the desired length and bend twice to achieve the desired shape. The bend pipette was finally filled with deionised water and placed in a water bath for storage. To modulate the suction pressure during experiments, the pipette was furnished with a water-filled tube attached to a syringe. The cantilever arm had a typical length of about 1 cm with a final bend leading to the nozzle with a length of about 100 to 200 µm. The base of the cantilever arm had an outer diameter typically ranging between 20 to 30 µm, tapering to an outer diameter of less than 15 µm at the nozzle. The inner diameter at the nozzle tip was approximately 5 µm. As shown in Fig. 5, the geometric dimensions of the micropipette force sensors were extracted from micrographs taken along the cantilever arm and nozzle. Subsequently, the measurements of inner and outer diameter were fitted with a second-order polynomial.
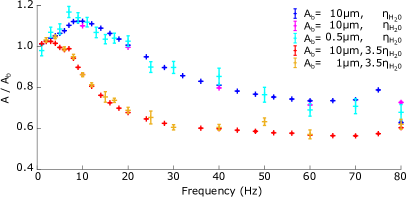
We performed consistency checks to verify the experimental method used to determine the frequency response of the micropipette force sensor. Figure 6 shows the frequency response of the force sensor under different amplitude of the external forcing . The frequency response was found to be independent of the amplitude within the range of applied amplitudes of up to 10 µm, which is about two orders larger than the pipette deflection found in the experiments with cells. To quantify the effect of the viscosity of the liquid surrounding the pipette on the frequency response, we performed the calibration in water and in a mixture of water and glycerol with approximately 3.5 times the viscosity of water. As expected for increased hydrodynamic drag, the damping increased in the later case. The difference in viscosity of distilled water and TAP growth medium, however, was found to have a negligible effect on the micropipette’s frequency response, as shown in Fig. 3b.
VIII.3 Experimental procedure
Experiments were performed in a liquid cell consisting of two glass slides (2947-75x50, Corning, USA) held in place by custom-made frames. Two spacers cut from an o-ring of 3 mm thickness and an inner diameter of 3.8 cm defined the experimental chamber. The glass slides were cleaned with ethanol (Uvasol, Merck, Germany) and completely dried before assembling the cell. The o-rings were also cleaned with ethanol, rinsed with water and then dried. The assembled cell was filled with TAP growth medium and mounted on an inverted microscope (IX83, Olympus, Japan). Liquid C. reinhardtii culture was injected into the cell. The culture was not centrifuged before injection but taken directly out of the liquid cultures in the incubator. The amount of cell culture injected into the liquid cell was adjusted such that a sufficient amount of C. reinhardtii were found in the chamber.
A thin slab of silicon cut from a wafer (type P/Bor, orientation , resistivity 1–20 cm, unilateral polished, Si-Mat, Germany) has been glued onto a custom-made stainless steel substrate holder with PDMS. Substrate and holder were prepared for experiments by sonication in an ethanol bath and subsequent blow-drying with an air gun. The substrate was mounted onto a linear stage (M462 series, Newport Corporation, USA) capable of computer-controlled movement within the focal plane and mechanical adjustment of the height and pitch. The substrate was then inserted into the liquid cell and moved to the focal point of the microscope. Due to the phototaxis of C. reinhardtii, the algae can be guided towards the substrate in the light beam focused on the substrate. Under white light conditions, the flagella stick to surfaces such that the algae accumulate on the substrate Kreis [2018, 2019]. The micropipette cantilever, furnished with a tube and syringe filled with deionised water, was mounted onto a 3-axis piezo-driven manual micromanipulator (PCS-5400, Burleigh, Thorlabs, USA) and inserted into the liquid cell. The substrate was then adjusted such that the surface was orthogonal to the pipette nozzle. An individual cell adhering to the substrate was approached by the pipette and fixated at the pipette nozzle with a suction pressure adjusted manually with the syringe. The fixated alga could then be detached from the substrate by retracting the pipette. Since only the flagella stuck to the substrate Kreis [2018], algae pulled off the substrate were oriented such that the flagella faced away from the pipette. Thus, the direction of the propulsion forces was orthogonal to the cantilever arm and the flagella were beating freely. Note that the flagella were not damaged when pulled off the substrate and recovered their regular beating pattern within tens of seconds Kreis [2018]. For measurements in bulk conditions, the substrate was typically retracted for more than one millimetre from the pipette. In red light, the flagella-mediated adhesion of C. reinhardtii to substrates is inhibited Kreis [2018], thus enabling to probe the steric interactions between flagella and substrate. Measurements during which the flagella, even just transiently, attached to the substrate were discarded. In order to ensure comparability between bulk measurements and measurements in the proximity of the interface, a 550 nm cut-off filter was inserted into the light path for all experiments. The aperture of the microscope was completely opened during experiments and the light intensity was kept constant to ensure consistent illumination. The entire setup was placed on an active anti-vibration table (Halcyonics i4-large, Accurion, Germany) and contained in a closed box to minimize acoustic vibrations and to control the illumination conditions during the experiment.
One data set consisted of 215 monochromatic images of the cross-section of the micropipette cantilever recorded close to the end of the cantilever arm using a 40x objective and a high-speed camera at 400 fps (pco.edge 4.2, PCO, Germany). The relative shift of the micropipette position throughout the recording was determined using a cross-correlation analysis of the intensity profiles of the pipette cross-section, following established protocols Kreis [2018], Backholm [2019]. The intensity profile was extracted from the center line of each image. The profile of the first frame served as a reference for the correlation analysis against which the profiles of all subsequent images were correlated. Subtracting the position of the maximal correlation value in the auto-correlation of the reference profile from the position of the maximum of the cross-correlation of the reference profile with the intensity profiles in subsequent images gives the relative shift of the pipette position compared to the first frame. Interpolating the correlation curve using the Matlab function ’smoothingspline’ over 40 pixel around the discrete maximal correlation value and extracting the shift corresponding the the maximum of the interpolation results in sub-pixel resolution.
VIII.4 Analysis of the power spectrum and noise
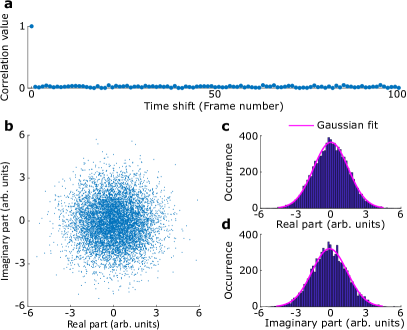
Following the Wiener-Khinchin theorem, we calculated the correlation of the noise in the range of 30 to 130 Hz from the power spectrum without a cell attached to the micropipette (shown in Fig. 2) using the inverse Fourier transform. As sown in Fig. 7a, the correlation revealed a delta peak for zero shift only, i.e. the noise is uncorrelated in time as expected for white noise. Figure 7b displays the scatter of the Fourier coefficients of the same data. The Fourier coefficients were found to follow a Gaussian distribution for both real (see Fig. 7c) and imaginary (see Fig. 7d) part centred around zero with finite variance. From this analysis, we conclude that this is white noise.
Assuming that the micropipette is a linear system, as is the Fourier transform, the white noise in the power spectrum can be accounted for with the offset of the Gaussian fit as illustrated in Eq. (2): Due to linearity, each Fourier coefficient, represented as a signal vector, , in complex space, is constructed as the linear combination of an signal vector originating from the forcing of the cell, , and a noise signal vector . Following the law of cosines, the amplitude of the resulting signal vector, , can be calculated from the cell signal amplitude, , and noise signal amplitude, , as
| (17) |
The phase takes a random value since it is the combination of the phase of and the phase of , the latter being random as discussed above. Averaging over multiple realisations yields
| (18) |
where “ ” indicates averaged quantities. Since the probability distribution of is symmetric around zero, the last term cancels out. If the frequency sampling is sufficiently high, i.e. the frequency binning-width is small such that there is a large number of coefficients within a frequency interval over which the fitted frequency distribution changes significantly, fitting a distribution to the power spectrum is the same as locally averaging over many realisations. For a typical experiment in bulk conditions, the standard deviation of the Gaussian fit varied between 1 to 3 Hz, which was considerably larger than the frequency binning-width Hz. Consequently, white noise was treated as a constant offset in the power spectrum, which can be subtracted in order to isolate the signal originating from the periodic forcing of the attached cell.
References
- Purcell [1977] Purcell, E. M. Life at low Reynolds number. American Journal of Physics 45, 3–11 (1977).
- Berg [1975] Berg, H.C. Bacterial behaviour. Nature 254, 389–392 (1975).
- Lauga [2009] Lauga, E., Powers, T. R. The hydrodynamics of swimming microorganisms. Rep. Prog. Phys. 72, 096601 (2009).
- Berg [1972] Berg, H. C., Brown, D. A. Chemotaxis in Escherichia coli analysed by Three-dimensional Tracking. Nature 239, 500–504 (1972).
- Alon [1999] Alon, U., Surette, M. G., Barbai, N. Leibler, S. Robustness in bacterial chemotaxis. Nature 397, 168–171 (1999).
- Foster [1984] Foster, K. W. et al. A rhodopsin is the functional photoreceptor for phototaxis in the unicellular eukaryote Chlamydomonas. Nature 311, 756–759 (1984).
- Miki [2013] Miki, K., Clapham, D.E. Rheotaxis Guides Mammalian Sperm. Current Biology 23, 443–452 (2013).
- Krieg [2019] Krieg, M. et al. Atomic force microscopy-based mechanobiology. Nature Reviews Physics 1, 41–57 (2019).
- Alsteens [2017] Alsteens, D. et al. Atomic force microscopy-based characterization and design of biointerfaces. Nature Reviews Materials 2, 1–16 (2017).
- Ashkin [1987] Ashkin, A., Dziedzic, J. M., Yamane, T. Optical trapping and manipulation of single cells using infrared laser beams. Nature 330, 769–771 (1987).
- Min [2009] Min, T. L. et al. High-resolution, long-term characterization of bacterial motility using optical tweezers. Nature Methods 6, 831–835 (2009).
- Stellamanns [2014] Stellamanns, E. et al. Optical trapping reveals propulsion forces, power generation and motility efficiency of the unicellular parasites Trypanosoma brucei brucei. Scientific Reports 4, 6515 (2014)
- Rüeffer [1985] Rüffer, U. & Nultsch W. High-speed cinematographic analysis of the movement of chlamydomonas. Cell Motility 5, 251–263 (1985).
- Minoura [1995] Minoura, I. & Kamiya, R. Strikingly different propulsive forces generated by different dynein-deficient mutants in viscous media. Cell Motility and the Cytoskeleton 31, 130–139 (1995).
- Polin [2009] Polin, M., Tuval I., Drescher K., Gollub J. P., Goldstein, R. E. Chlamydomonas swims with two “gears” in a eukaryotic version of run-and-tumble locomotion. Science 325, 487–490 (2009).
- Guasto [2010] Guasto, J. S., Johnson, K. A., Gollub, J. P. Oscillatory Flows Induced by Microorganisms Swimming in Two Dimensions. Physical Review Letters 105, 168102 (2010).
- Ostapenko [2018] Ostapenko, T. et al. Curvature-guided motility of microalgae in geometric confinement. Physical Review Letters 120, 068002 (2018).
- Brumley [2014] Brumley, D. R., Wan, K. Y., Polin, M., Goldstein, R. E. Flagellar synchronization through direct hydrodynamic interactions. eLife 3, 02750 (2014).
- Drescher [2010] Drescher, K., Goldstein, R. E., Michel, N., Polin, M., Tuval, I. Direct measurement of the flow field around swimming microorganisms. Physical Review Letters 105, 168101 (2010).
- Rueffer [1987] Rüffer, U. & Nultsch, W. Comparison of the beating of cis- and trans-flagella of Chlamydomonas cells held on micropipettes. Cell Motility and the Cytoskeleton 7, 87–93 (1987).
- Bayly [2011] Bayly, P. et al. Propulsive forces on the flagellum during locomotion of chlamydomonas reinhardtii. Biophysical Journal 100, 2716–2725 (2011).
- Goldstein [2009] Goldstein, R. E., Polin, M., Tuval, I. Noise and synchronization in pairs of beating eukaryotic flagella. Physical Review Letters 103, 168103 (2009).
- Wan [2014] Wan, K. Y. & Goldstein R. E. Rhythmicity, recurrence, and recovery of flagellar beating. Physical Review Letters 113, 238103 (2014).
- Wan [2014] Wan, K. Y., Leptos, K. C., Goldstein, R. E. Lag, lock, sync, slip: the many ’phases’ of coupled flagella. Journal of The Royal Society Interface 11, 20131160 (2014).
- Johnson [1979] Johnson, R. E., Brokaw, C. J. Flagellar hydrodynamics. A comparison between resistive-force theory and slender-body theory. Biophysical Journal 25, 113-127 (1979).
- McCord [2005] McCord, R. P., Yukich, J. N., Bernd, K. K. Analysis of force generation during flagellar assembly through optical trapping of free-swimming Chlamydomonas reinhardtii. Cell Motility and the Cytoskeleton 61, 137–144 (2005).
- Wan [2018] Wan, K. Y. Coordination of eukaryotic cilia and flagella. Essays in Biochemistry 62, 829–838 (2018).
- Kantsler [2013] Kantsler, V., Dunkel, J., Polin, M., Goldstein, R. E. Ciliary contact interactions dominate surface scattering of swimming eukaryotes. Proc. Nat. Acad. Sciences USA 110, 1187–1192 (2013).
- Contino [2015] Contino, M., Lushi, E., Tuval, I., Kantsler, V., Polin, M. Microalgae Scatter off Solid Surfaces by Hydrodynamic and Contact Forces. Physical Review Letters 115, 258102 (2015).
- Kreis [2018] Kreis, C.T., Le Blay, M., Linne, C., Makowski, M.M. & Bäumchen, O. Adhesion of Chlamydomonas microalgae to surfaces is switchable by light. Nature Physics 14, 45–49 (2018).
- Petit [2018] Petit, J., et al. A modular approach for multifunctional polymersomes with controlled adhesive properties. Soft Matter 14, 894 (2018).
- Backholm [2019] Backholm, M. & Bäumchen, O. Micropipette force sensors for in vivo force measurements on single cells and multicellular microorganisms. Nature Protocols 14, 594–615 (2019).
- Kreis [2019] Kreis, C.T., Grangier, A. & Bäumchen, O. In vivo adhesion force measurements of Chlamydomonas on model substrates Soft Matter 15, 3027-3035 (2019).
- Colbert [2009] Colbert, M. J., Raegen, A. N., Fradin, C., Dalnoki-Veress, K. Adhesion and membrane tension of single vesicles and living cells using a micropipette-based technique. The European Physical Journal E 30, 117-121 (2009).
- Colbert [2010] Colbert, M. J., Brochard-Wyart, F., Fradin, C., Dalnoki-Veress, K. Squeezing and detachment of living cells. Biophysical Journal 99, 3555–3562 (2010).
- Backholm [2013] Backholm, M., Ryu, W. S., Dalnoki-Veress, K. Viscoelastic properties of the nematode Caenorhabditis elegans, a self-similar, shear-thinning worm Proceedings of the National Academy of Sciences of the United States of America 110, 4528–4533 (2013).
- Schulman [2014] Schulman, R. D., Backholm, M., Ryu, W. S., Dalnoki-Veress, K. Dynamic force patterns of an undulatory microswimmer. Physical Review E 89, 050701 (2014).
- Schulman [2014] Schulman, R. D., Backholm, M., Ryu, W. S., Dalnoki-Veress, K. Undulatory microswimming near solid boundaries. Phys. Fluids 26, 101902 (2014).
- Backholm [2015] Backholm, M., Kasper, A. K. S., Schulman, R. D., Ryu, W. S., Dalnoki-Veress, K. The effects of viscosity on the undulatory swimming dynamics of C. elegans. Phys. Fluids 27, 091901 (2015).
- Sader [1998] Sader, J. E. Frequency response of cantilever beams immersed in viscous fluids with applications to the atomic force microscope. Journal of Applied Physics 84, 64–76 (1998).
- Geyer [2013] Geyer, V. F., Jülicher, F., Howard, J., Friedrich, B. M. Cell-body rocking is a dominant mechanism for flagellar synchronization in a swimming alga. Proceedings of the National Academy of Sciences 110, 18058 (2013).
- Williams [1972] Williams, R. E. & Hussey, R. G. Oscillating Cylinders and the Stokes’ Paradox. Physics of Fluids 15, 2083 (1972).
- Tuck [1969] Tuck, E. O. Calculation of Unsteady Flows Due to Small Motions of Cylinders in a Viscous Fluid. Journal of Engineering Mathematics 3, 1 (1969).