STAR Collaboration
Bulk Properties of the System Formed in Au+Au Collisions at = 14.5 GeV at STAR
Abstract
We report systematic measurements of bulk properties of the system created in Au+Au collisions at = 14.5 GeV recorded by the STAR detector at the Relativistic Heavy Ion Collider (RHIC). The transverse momentum spectra of , and are studied at mid-rapidity () for nine centrality intervals. The centrality, transverse momentum (), and pseudorapidity () dependence of inclusive charged particle elliptic flow (), and rapidity-odd charged particles directed flow () results near mid-rapidity are also presented. These measurements are compared with the published results from Au+Au collisions at other energies, and from Pb+Pb collisions at = 2.76 TeV. The results at = 14.5 GeV show similar behavior as established at other energies and fit well in the energy dependence trend. These results are important as the 14.5 GeV energy fills the gap in , which is of the order of 100 MeV, between =11.5 and 19.6 GeV. Comparisons of the data with UrQMD and AMPT models show poor agreement in general.
I INTRODUCTION
According to quantum chromodynamics (QCD), at very high temperature and/or at high density, a de-confined phase of quarks and gluons is expected to be present. At low temperature and low density, quarks and gluons are confined inside hadrons. The exploration of the QCD phase diagram, in the plane of temperature () and the baryon chemical potential (), is one of the primary objectives of high-energy heavy-ion collision experiments TmuBsNN1 ; TmuBsNN2 ; TmuBsNN3 ; HICs1 ; HICs2 ; HICs3 ; HICs4 . During the initial stages of Au+Au collisions at top RHIC energies, there is evidence of a phase with partonic degrees of freedom HICs1 ; HICs2 ; HICs3 ; HICs4 ; expdof1 ; expdof2 ; expdof3 ; expdof4 ; expdof5 ; expdof6 , which later transits into one with hadronic degrees of freedom dof0 ; dof1 ; dof2 ; dof3 . Relevant evidence includes strong suppression of high transverse momentum () hadron production in Au+Au collisions relative to collisions HICs1 ; HICs2 ; HICs3 ; HICs4 ; expdof1 ; expdof2 ; expdof3 ; expdof4 , large elliptic flow () for hadrons containing light as well as strange and charm valence quarks, and the difference between baryon and meson at intermediate expv2 .
At 0, the phase transition is a cross-over. This region is well described by lattice QCD calculations lqcd1 ; lqcd2 . At larger , a first-order phase transition is suggested by lattice QCD lqcd3 and various QCD-based models qcdb1 ; qcdb2 ; qcdb3 ; qcdb4 . The end point of the first-order phase transition in the , plane is the QCD critical point qcpt1 ; qcpt2 . To discover this critical point and to search for the phase boundary, the Beam Energy Scan (BES-I) program besp1 ; besp2 ; besp3 ; besp5 was carried out by RHIC in the years 2010 and 2011. Au+Au collisions were recorded at = 7.7, 11.5, 19.6, 27, and 39 GeV. In the year 2014, another Au+Au collision energy at = 14.5 GeV was added to this BES-I program to bridge the 100 MeV gap in bes_paper between the beam energies of 11.5 and 19.6 GeV.
In this paper, we present bulk properties of the system, namely spectra (,,), , , particle ratios, kinetic freeze-out properties, rapidity-odd directed flow (charged hadrons), and (charged hadrons) in Au+Au collisions at = 14.5 GeV. A systematic study of these observables as a function of , pseudo-rapidity (), and collision centrality is discussed in detail. Comparisons of the results with those in Au+Au collisions at other RHIC energies and with Pb+Pb collisions at = 2.76 TeV are presented. The results are also compared to model calculations, namely UrQMD (a hadronic transport model) urqmd and AMPT (a transport model with both hadronic and partonic interactions) ampt . Earlier measurements suggest that systems at lower energies, such as 7.7 and 11.5 GeV, behave like hadron gases, while at energies of 19.6 GeV and above, they show partonic behavior Adamczyk:2013dal ; Adamczyk:2014ipa ; Adamczyk:2014mzf ; star_v2_bes_prl ; star_v2_bes_prc ; star_phispectra_bes_prc ; phi_v2_nasim ; star_v2_200gev_prl ; star_v1_bes_2 ; Adamczyk:2017nof . The Au+Au collisions at = 14.5 GeV, lying between these two energies, allow studies of the interplay between hadronic and partonic phases.
II EXPERIMENT AND DATA ANALYSIS
II.1 STAR Detector
This paper reports the results for Au+Au collisions at = 14.5 GeV taken by the STAR detector star at RHIC under the BES-I program. The selected minimum-bias data triggered by the Beam Beam Counters (BBCs) bbc1 ; bbc2 are used for this analysis. The BBCs are two scintillator-based detectors situated on both sides of the center of STAR at pseudorapidity 3.8 5.2 with full azimuthal coverage. The detector primarily used for tracking is the Time Projection Chamber (TPC) tpc . The TPC is a gas detector filled with P10 gas ( Argon and Methane). It operates at a pressure of 2 mbar above atmospheric pressure in a constant magnetic field of 0.5 Tesla in the longitudinal () direction. The TPC has an acceptance of in pseudorapidity and in azimuth. Through ionization energy loss () measurements of the particles traversing the TPC gas, different particles can be identified. The Time of Flight (TOF) detector is also used for particle identification tof . The TOF uses Multi Resistive Plate Chamber (MRPC) technology. It provides full azimuthal coverage and has a pseudorapidity acceptance of .
II.2 Event Selection
The primary vertex of each event is determined by finding the best common point from where most of the tracks originate. Along the beam direction, a vertex position cut of cm is applied to select events for the spectra analysis. For and analyses, a broader cut of cm is applied to obtain reasonable statistics. In Au+Au collisions at 14.5 GeV, the mean vertex position for all events is centred at () cm in - plane. A radial vertex position cut (defined by ) of cm from the centre is applied to reject interactions involving the beam pipe. After these event cuts, the number of events analyzed for , , spectra is nearly 10 million, while the number for inclusive charged particle and analyses is about 17 million.
II.3 Centrality Selection
The uncorrected charged-particle multiplicity distribution is compared and fitted with Glauber Monte-Carlo (MC) simulations as shown in Fig. 1. The detailed procedure to obtain the simulated multiplicity using Glauber Monte-Carlo is similar to that described in v2_bes_chg . The minimum-bias trigger events are divided into nine centrality classes: 0–5%, 5–10%, 10–20%, 20–30%, 30–40%, 40–50%, 50–60%, 60–70% and 70–80%. The quoted fractions are in terms of the total cross section obtained from the simulated events with the Glauber model. In addition, quantities such as average number of participating nucleons , number of binary collisions etc. are estimated and are listed in Table 3.
II.4 Track Selection
| Spectra | ||
|---|---|---|
| DCA (cm) | ||
| Number of fit points | ||
| Fraction of fit points | ||
| Number of points |
Details of the track cuts are tabulated in Table 1. The distance of closest approach (DCA) of tracks to the primary vertex is required to be less than 3 cm to suppress tracks from secondary decays. In the spectra analysis, the number of fit points associated with a track has to be 25 or more out of a maximum possible 45 hits in the TPC, while for and analyses, 15 or more hits are required. The cuts in these analyses are the same as the standard cuts established in previous STAR published papers. The fraction of fit points on a track is required to be greater than of the total possible hits to avoid split tracks. To have a good ionization energy loss resolution for tracks, the number of TPC hits used to determine is required to be 15 or more. The spectra results are obtained for tracks within the rapidity window . Inclusive charged particle and analyses are carried out using tracks within pseudorapidity .
II.5 Particle Identification
Particle identification in the TPC is carried out by measuring the truncated mean of the ionization energy loss () for each of the selected tracks. The measured of the charged particles as a function of rigidity, (momentum per charge in units of the electron charge) is presented in the top panel of Fig. 2. The solid curves represent theoretical values predicted by the Bichsel bichsel formula. The TPC can identify pions, kaons and protons with relatively low momentum, but the separate bands start merging at higher momentum. The pions and kaons can be identified up to of 0.8 GeV/ and protons up to 1.0 GeV/.
For particle identification at relatively higher momentum, the TOF detector is utilized. In this analysis, TOF information is used for particle identification in the range 0.4–2.0 GeV/ (0.5–2.0 GeV/) for pions and kaons (protons). The lower panel of Fig. 2 shows the characteristic plot for TOF in which the inverse of particle velocity in units of the speed of light, , is plotted as a function of . The solid lines are the expected values for pions, kaons and protons.
The distribution for a specific particle type
in the TPC does not have a Gaussian shape z-var . It has been
demonstrated that a more appropriate Gaussian variable for a given
choice of particle type is the -variable z-var , defined as
| (1) |
where is the particle type (, , , or in the present analysis) and is the corresponding prediction of from the Bichsel function bichsel . The distribution for each particle type is expected to peak at 0.
The distributions are constructed for a particular choice of particle, for a given range within rapidity . The top panel of Fig. 3 shows the distribution for positively charged tracks of GeV/. The distributions are then fitted by a multi-Gaussian function to extract the raw yield. The area under the Gaussian curve for the particle under consideration gives the yield of that particle for that range. As can be noticed from Fig. 3, the pion peak is slightly shifted towards the negative side of zero on the axis. This could be due to issues related to calibration. However, any shift of the pion peak from zero does not have an impact on the raw yield value. This method is applicable for low values, up to the point where the distributions for pions, kaons and protons are well separated. For higher , where the distributions start to overlap, the widths of the Gaussian distributions are constrained according to the values at lower . Following a similar procedure for each particle type, raw yields are extracted for different ranges in nine centrality classes.
The raw yields from TOF are obtained using the variable defined as
| (2) |
where , , , and are particle momentum, Time-of-flight, path length of the particle, and the speed of light, respectively. Within , the distributions are obtained for the particle of interest in a given range, and one example is shown in the bottom panel of Fig. 3 for the case of . To extract the raw yields using distributions, we follow the same procedure as done in Refs. bes_paper ; tof-m2 . In this method, the distributions from data are fitted using the predicted distributions. The predicted distribution is generated by the measured time-of-flight from experimental data, thus including the TOF detector response behavior, for a given -identified particle. It is observed that the predicted distributions do not change much with and can be extended to higher where identification is limited. These predicted distributions of pions, kaons and protons are used simultaneously to fit the measured distributions to obtain the raw yield as shown for in the bottom panel of Fig. 3 for range 0.5–0.6 GeV/. In this way, the raw yields are obtained for all bins, centralities and different particles.
II.6 Flow Analysis
The azimuthal distribution of emitted particles with respect to the reaction plane can be decomposed in a Fourier series art1 . The harmonic coefficients () in this expansion are defined as,
| (3) |
Here, angle brackets denote an average over all particles in all events for a given or bin, and is the azimuth of the reaction plane angle. The first harmonic coefficient is called the directed flow (), while the second is called the elliptic flow (). Since the is unknown experimentally, it is estimated from
| (4) |
where is -order event plane azimuth, are weights, and is the total number of particles in an event used for the event plane calculation art1 . The observed is calculated with respect to the reconstructed event plane using
| (5) |
The observed are then corrected for event plane resolution res_cent ; res_nsm .
Two types of event plane angles are used in this analysis: the TPC event plane v2_bes_chg and the BBC event plane bbc_ep . In the TPC event plane method, a second-order event plane angle () is reconstructed from TPC tracks at mid-rapidity (). To reduce nonflow contributions, we utilize the -sub method, with an additional -gap of 0.1 between the sub-events, and then average the results from the two sub-events v2_bes_chg . In the BBC event plane method, a first-order event plane (), reconstructed using the hits in both BBC detectors in opposite hemispheres (3.85.2), is used to calculate and . Re-centering and shift techniques were applied for each hemisphere independently to flatten the TPC event plane and BBC event plane art1 . More details about these methods can be found in a previous publication v2_bes_chg .
In addition to the event plane method, the multi-particle correlation method v2qc ; v2gen is used to calculate of charged particles. In this method, the reference flow (e.g., integrated over ) can be estimated both from two- and four-particle cumulants:
| (6) |
| (7) |
Here and are two- and four-particle cumulants. The two- and four-particle cumulants without detector bias then can be formulated as
| (8) |
| (9) |
Here, double angle brackets denote an average over all events. More details about these methods are presented in v2_bes_chg .
III CORRECTION FACTORS
III.1 Monte-Carlo Embedding Technique
Several correction factors for the spectra are calculated from MC simulations known as the embedding technique. The method is outlined below and more details can be found in Refs. besp1 ; bes_paper ; prc . For a given particle, MC tracks having flat rapidity and distributions are simulated in the STAR detector using GEANT3. Those simulated tracks are then embedded into real events at the raw data level. The multiplicity of embedded tracks in any real event is no more than 5% of the measured real charged particle multiplicity of that event. These embedded tracks are reconstructed in the same manner as the real data reconstruction. The embedding sample is used to calculate various correction factors such as tracking efficiency and acceptance, and energy loss correction as discussed below.
III.2 Energy Loss Correction
The TPC track reconstruction algorithm assumes the pion mass for each particle when correcting for multiple Coulomb scattering and energy loss in the TPC gas, which mostly affect particles of low momenta. Therefore, a correction for momentum loss by heavier particles like and () is needed. This correction is obtained from MC simulation or embedding techniques. The distribution of momentum difference between reconstructed momentum and initial momentum as a function of gives the amount of energy loss correction for each track. The relevant plot for Au+Au collisions at = 14.5 GeV, showing the dependence of energy loss, is presented in Fig. 4 for pions (left), kaons (middle) and protons (right). The red curve represents a functional fit to the data points in the case of kaons and protons,
| (10) |
where and are fit parameters. This energy loss fraction is the same for all centrality classes for a particular particle type. All the results shown in this paper have been corrected for this energy loss effect.
III.3 Tracking Efficiency and Acceptance
A correction for detector efficiency and acceptance needs to be applied to the spectra of analyzed particles. This correction factor is obtained from the embedding technique described above. The combined tracking efficiency and acceptance is the ratio of the distribution of reconstructed to original Monte-Carlo tracks as a function of in the rapidity range of interest. This functional dependence of combined tracking efficiency and acceptance on is presented in Fig. 5 for reconstructed pions (left), kaons (middle), and protons (right) in Au+Au collisions at = 14.5 GeV. The curves represent the functional fit of the form , used to parameterize the efficiency. This correction factor is thus calculated for each particle type in nine centrality classes and each spectrum is divided by this fraction.
III.4 TOF Matching Efficiency
The TOF detectors form a curved cylindrical surface surrounding the TPC and have a reduced geometric acceptance compared to the TPC. Circumstances arise where TPC tracks are not detected in TOF, especially at low momentum, either because the track is out of the TOF acceptance or because of the TOF inefficiency. As a result, the yield of particles identified by TOF needs to be corrected, in addition to the TPC track reconstruction efficiency. This is referred to as the TOF matching efficiency or TOF particle identification efficiency for TPC tracks. This efficiency is calculated from the STAR data as the ratio of the number of tracks detected in TOF to the total number of tracks in the TPC within the acceptance under study. It is shown as a function of in Fig. 6 for pions (left), kaons (middle) and protons (right) in Au+Au collisions at = 14.5 GeV for 0–5% centrality. The raw yields obtained using TOF are divided by the matching efficiency for each centrality, range, and for each particle type.
III.5 Pion Background Correction
The measured pions get a contribution from the feed-down of weak decays, muon contamination, and background pions produced in the detector material. Therefore, it is important to remove these background contributions from the total pion yield. To obtain this correction, we used the same approach as done in Refs. bes_paper ; prc . The Monte-Carlo simulated events are generated by HIJING hijing and are processed through the STAR detector simulated by GEANT3 geant . These events are reconstructed in the same manner as real data. In the MC sample, the pion background fraction is estimated since different contributions to the total pion yield are known. The pion background fraction decreases exponentially with . Its value at low (=0.225 GeV/) is 16 and becomes negligible above 0.6 GeV/. It shows negligible centrality dependence, hence the same correction is applied for all centrality classes.
III.6 Proton Background Correction
The yield of protons has a significant contribution from background protons coming from interactions of highly energetic particles with the detector material. In order to estimate the proton background fraction, we follow the same procedure as used in Refs. prc ; pbkgrnd ; bes_paper . This fraction is estimated by comparing the proton and antiproton DCA distributions obtained from real data. The difference between the proton and antiproton DCA distribution gives the estimate of proton background contribution. The proton background fraction decreases as a function of and decreases from peripheral to central collisions. At 0.60–0.65 GeV/, its typical value is about 40% in peripheral collisions and 2% in central collisions. For minimum bias collisions, proton background at low is around and becomes almost negligible for GeV/. The (anti)protons also have a contribution of feed-down from weak decays of hyperons, which include particles like which has not been measured. Contrary to pions, the analysis cut of DCA 3 cm includes almost all daughter particles from hyperon decays pbkgrnd_2 ; 200gevprl . Thus, (anti)proton yields presented here are all inclusive similar to those at other RHIC energies bes_paper ; prc .
IV Systematic Uncertainties
To estimate the size of systematic uncertainties associated with the spectra of the particles under study, we vary the event and track cuts, and the quality of fits to measurements. The following parameters are varied: the event range (from cm to cm), track cuts like DCA (from 3 cm to 2 cm), number of fit points (from 25 to 20), and number of points (from 15 to 10). We have also varied the fit range for the distribution and the PID selection (using ) cut of a given particle used for the predicted distribution.
| 1 | |||
| Track Cuts | |||
| PID | |||
| Extrapolation | |||
| Corrections | |||
| Proton Background | - | - | 5–6% |
| Total |
Apart from these systematic uncertainties for the case of spectra, an additional error of 5 is added in quadrature due to detector tracking efficiency and acceptance bes_paper ; prc ; 200gevprl . The pion feed-down correction and the proton background fraction also contribute to the systematic uncertainty; however, the former is negligible and the latter contributes about 5–6% only at low . All the sources of systematic uncertainty are added in quadrature and are tabulated in Table 2. The total systematic uncertainties on pion, kaon and proton yields are , and , respectively.
The calculation of integrated particle yields () and requires a fitting function to extrapolate the spectra to the unmeasured region. Thus, another important source of systematic uncertainty in and is extrapolation. For pions, kaons and protons, the default fit functions used to extract yields are Bose-Einstein, -exponential, and double exponential, respectively. To estimate the systematic uncertainty, these fit functions for pions, kaons and protons are changed to -exponential, Boltzmann and -exponential functions, respectively. The relevant functional forms are
-
•
Bose-Einstein:
-
•
-exponential:
-
•
-exponential:
-
•
Boltzmann:
-
•
Double-exponential:
The systematic uncertainty on mean mainly comes from the errors associated with extrapolation of spectra. The fitting range of the fit function also affects the value of , which is included as a source of systematic uncertainty. The systematic uncertainty on for pions, kaons and protons is , and , respectively.
The systematic uncertainty on integrated particle ratios is calculated from the systematic uncertainty on . The systematic uncertainty due to tracking efficiency cancels in particle ratios. The error associated with extrapolation mostly cancels in the case of particle to antiparticle ratios, but does not cancel for the ratios of different particle species.
The Blast-Wave fit bw to particle spectra provides the kinetic freeze-out parameters. The point-to-point systematic uncertainty associated with the spectra propagates to the systematic uncertainties on the kinetic freeze-out parameters. The ranges used for fitting also affect the results. These variations are included in the systematic uncertainty on kinetic freeze-out parameters.
The systematic uncertainties for and measurements are estimated by varying event and track cut parameters from their default values. The -position of the primary vertex is varied between 60 and 80 cm. The DCA of the primary tracks is varied between 2.0 cm and 3.0 cm. The number of fit points is varied from 18 to 25. In the case of measurements, the -gap is varied between 0.05 and 0.075. In total, about 100 combinations of such cut variations are considered and the RMS of the variation is taken as the systematic uncertainty. A maximum of 2% relative systematic uncertainty due to event cuts, and 1% due to track cuts, is found for the various centrality classes and for the various and bins.
V RESULTS AND DISCUSSIONS
V.1 Transverse Momentum Spectra
The transverse momentum spectra for , , , , , and in Au+Au collisions at = 14.5 GeV are presented in Fig. 7. The spectra are plotted for nine collision centralities 0–5%, 5–10%, 10–20%, 20–30%, 30–40%, 40–50%, 50–60%, 60–70%, 70–80%. Further information can be extracted from the particle spectra through functional fitting in terms of and . As mentioned earlier the functions used for this purpose are Bose-Einstein, -exponential and double exponential for pions, kaons and protons, respectively. It can be inferred that the invariant yields exhibit a dependence (decrease with increasing ) as well as a centrality dependence (decrease towards the peripheral collisions). The shapes of the kaon and (anti)proton spectra show a gradual flattening from peripheral to central collisions. The trend is less pronounced for pions. This flattening reflects a stronger effect of radial flow on particles with higher mass and for events with increasing centrality.
V.2 Average Transverse Momenta
Average transverse momenta quantitatively reflect the slopes of the measured spectra of the particles. i.e., the transverse dynamics influences . The dependence of on the number of nucleon participants is shown in Fig. 8 for Au+Au collisions at = 14.5 GeV. These averages are compared with the corresponding results from Au+Au collisions at = 7.7, 11.5, 19.6, 27, 39, 62.4, and 200 GeV measured by STAR in earlier runs expdof1 ; expdof2 ; expdof3 ; expdof4 ; bes_paper ; prc ; 200gevprl . It is seen from the figure that of , and increases with increasing . This indicates an increase of radial flow from peripheral to central collisions Heinz:2013th . Mean and inferred radial flow also increase from pions to kaons, and from kaons to protons. The behavior of as a function of in Au+Au collisions at = 14.5 GeV is similar within error bars to what is observed at other BES-I energies, although it slowly increases with collision energy. The values of for , , , , , and are listed in Table 5 for Au+Au collisions at = 14.5 GeV.
V.3 Particle Yields
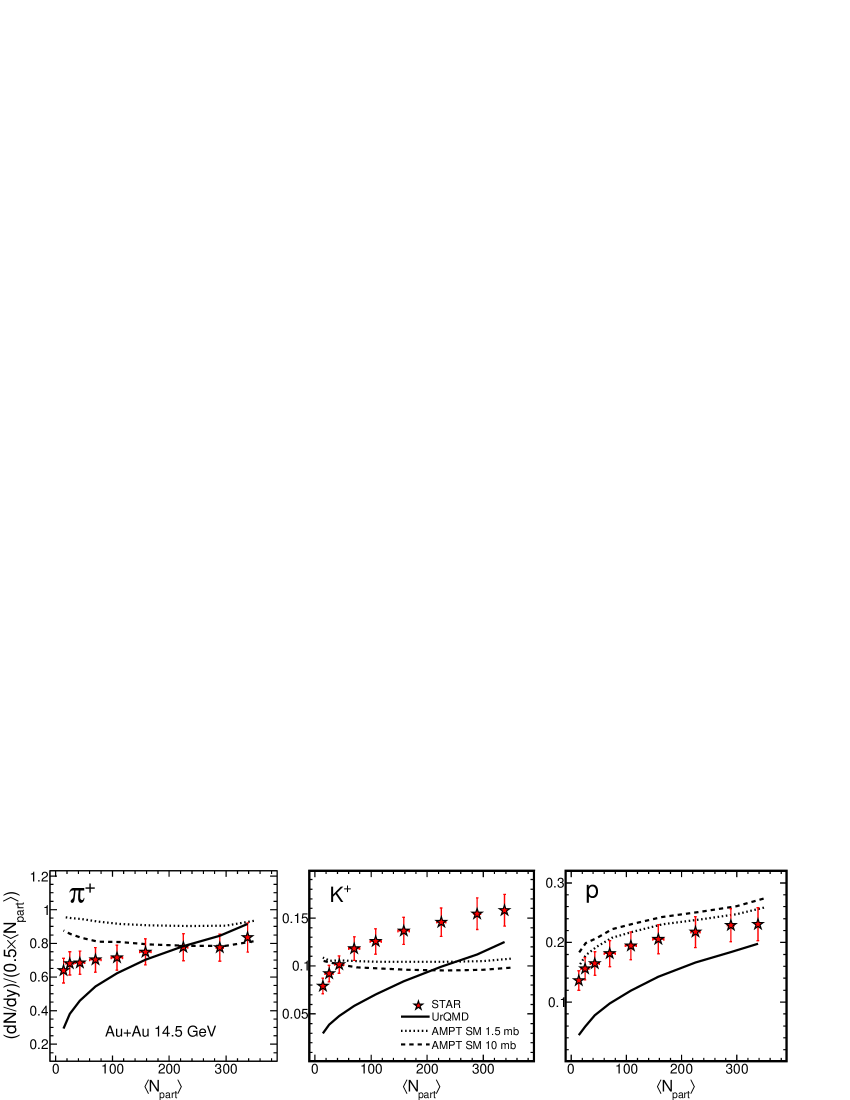
The particle production in a collision centrality interval is defined as or particle yield, which we measure at midrapidity () and is obtained by integrating over . The measured is shown in Fig. 9 for , , , , and , normalized with 0.5, as a function of in Au+Au collisions at = 14.5 GeV. These yields are compared with the corresponding results from Au+Au collisions at = 7.7, 11.5, 19.6, 27, 39, 62.4, and 200 GeV measured by STAR in earlier runs expdof1 ; expdof2 ; expdof3 ; expdof4 ; bes_paper ; prc ; 200gevprl . The values of for , , , , , and are also tabulated in Table 4 for Au+Au collisions at = 14.5 GeV.
The pion, kaon, and proton yields slowly increase from peripheral to central collisions. This may indicate contributions from hard processes which depend on the number of nucleon-nucleon binary collisions, increasing with more than linearly Wang:2000bf . The antiproton yields remain almost flat with centrality. This may be due to an increasing baryon-antibaryon annihilation effect with increasing centrality. The yields of pions, kaons, and antiprotons all increase with increasing collision energy. However, the yield of protons shows the opposite trend and decreases up to 39 GeV after which it starts to increase. This reflects an increase in baryon density due to baryon stopping at lower energies Randrup:2006nr ; bes_paper ; besp1 . The results in Au+Au collisions at = 14.5 GeV show a similar behaviour as observed by STAR at other energies expdof1 ; expdof2 ; expdof3 ; expdof4 ; bes_paper ; prc ; 200gevprl .
V.4 Particle Ratios
Particle ratios provide additional information about particle production and the system evolution in high-energy heavy-ion collisions. In this context, we have analyzed particle ratios in Au+Au collisions at = 14.5 GeV, and compared to published results for Au+Au collisions at other collision energies expdof1 ; expdof2 ; expdof3 ; expdof4 ; bes_paper ; prc ; 200gevprl .
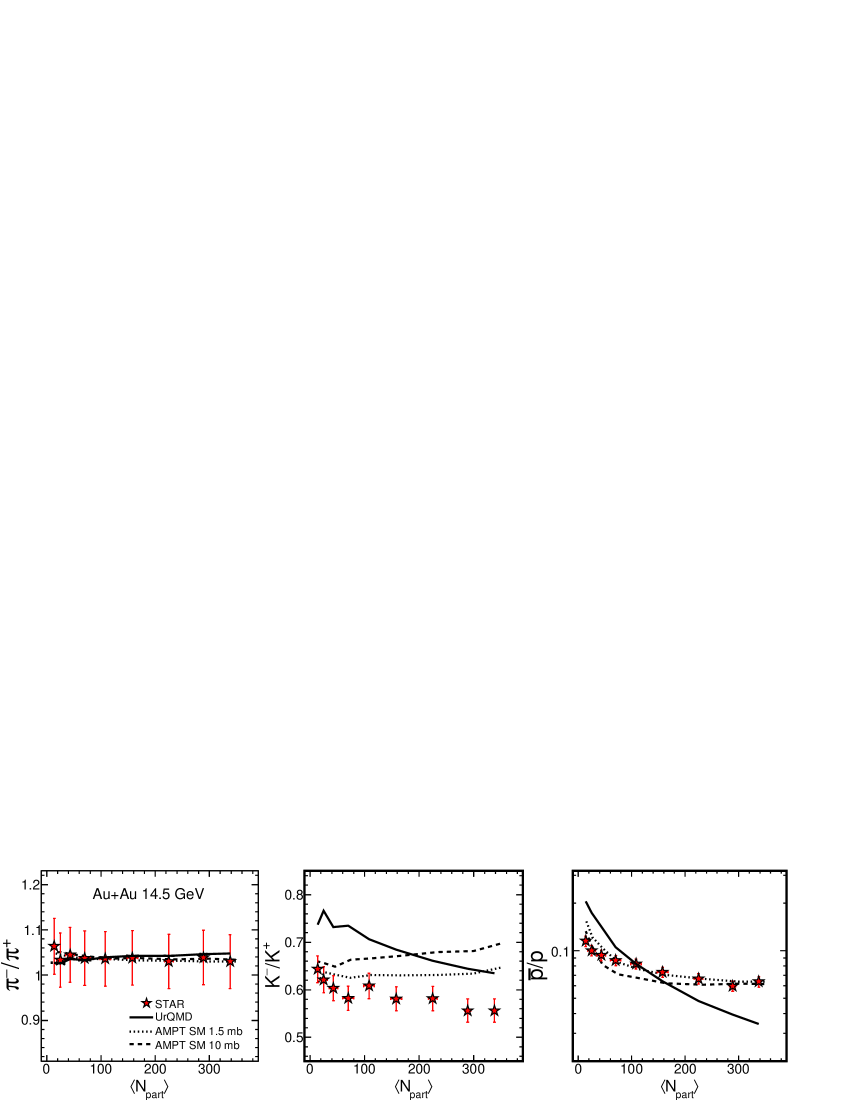
Figure 10 shows the dependence of the antiparticle to particle ratios on in Au+Au collisions at = 14.5 GeV. These ratios are compared with the corresponding results from Au+Au collisions at = 7.7, 11.5, 19.6, 27, 39, 62.4, and 200 GeV measured by STAR in earlier runs expdof1 ; expdof2 ; expdof3 ; expdof4 ; bes_paper ; prc ; 200gevprl . The ratio has no significant centrality dependence and hovers around unity for all energies. At lower energies, including Au+Au collisions at = 14.5 GeV, this ratio is slightly greater than one, which is due to isospin conservation and the contribution from decays of resonances like baryons bes_paper ; besp1 . This effect is more visible at lower energies due to the comparatively smaller yield of pions. The ratio is almost flat within uncertainties across all centralities. However, this ratio shows an increase with increasing beam energy. This is because at lower energies, associated production is the dominant mechanism, producing only , whereas with increasing energy, pair production dominates, producing both and bes_paper ; besp1 . The ratio shows a modest increase from central to peripheral collisions, which could be attributed to an increase in proton yields as a result of baryon stopping and/or a decrease in antiproton yields due to annihilation in central collisions bes_paper ; besp1 . This ratio also increases with increasing collision energy. All these antiparticle-to-particle ratios in Au+Au collisions at = 14.5 GeV follow the same general patterns as observed at other energies expdof1 ; expdof2 ; expdof3 ; expdof4 ; bes_paper ; prc ; 200gevprl .
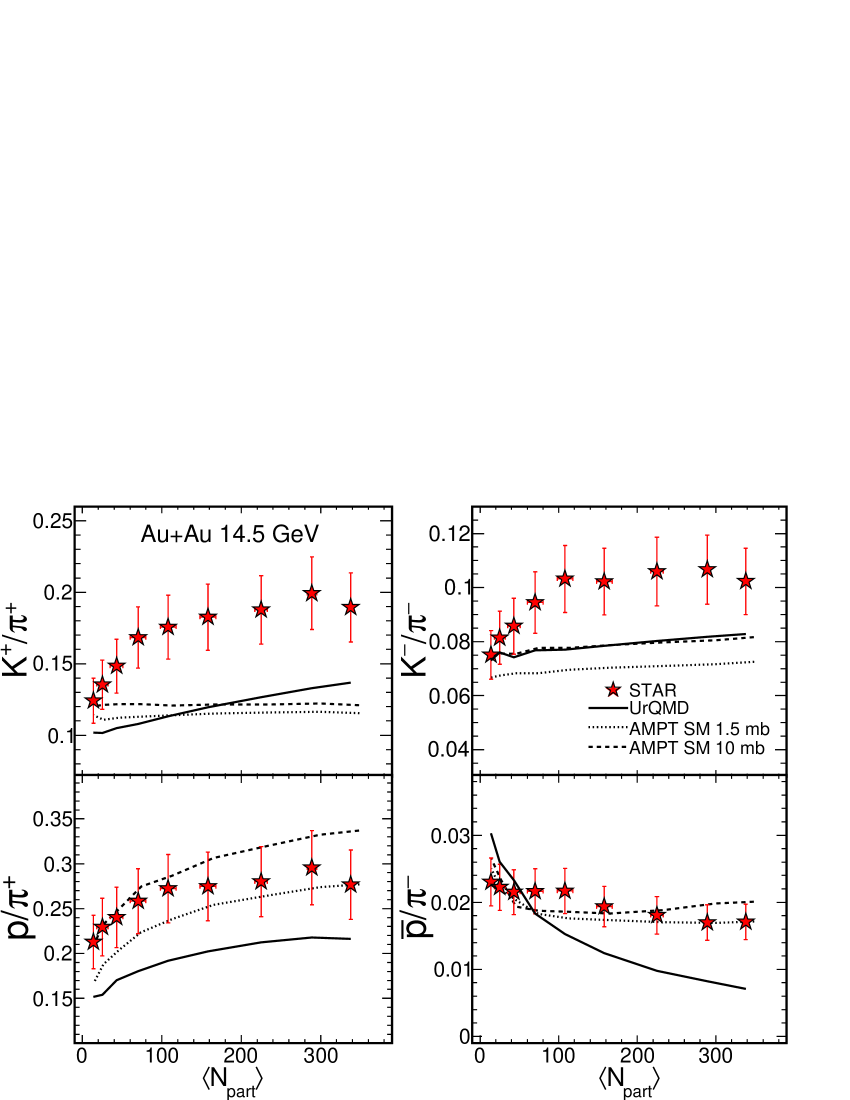
Various ratios of different particle species such as /, /, and / are shown in Fig. 11 for Au+Au collisions at = 14.5 GeV. Previously published results from the STAR experiment at other beam energies expdof1 ; expdof2 ; expdof3 ; expdof4 ; bes_paper ; prc ; 200gevprl are also shown for comparison. Both / and / ratios increase from peripheral to mid-central collisions and then remain almost independent of . This pattern is due to strangeness equilibrium described in various thermodynamical models model1 ; model2 and is also impacted by baryon stopping at midrapidity. The results from Au+Au collisions at = 14.5 GeV fit well in the energy dependence trend. The ratio increases slowly from peripheral to central collisions, whereas the ratio stays flat across all values of . Also, there is a decrease in the ratio and an increase of the ratio with increasing collision energy, which together can be attributed to baryon stopping at lower energies being prominent for central collisions.
V.5 Kinetic Freeze-out Properties
The invariant yields and spectra of particles give us tools to
study the freeze-out properties of the system. There are two
freeze-out stages observed in high-energy heavy-ion collision
experiments: chemical freeze-out and kinetic freeze-out.
First, inelastic collisions among the particles cease, defining the
chemical freeze-out stage. After that point, there is no further
production of new particles, and the yields of particle types becomes
fixed. Various thermodynamic models are widely applied to extract the
information of this stage in terms of chemical freeze-out temperature
and baryon chemical potential HICs4 ; bes_paper ; thermus ; th_model . Thereafter, the particles collide only elastically. After
further expansion of the system, as the inter-particle separation
becomes large, such elastic collisions between particles also cease,
leading to the kinetic freeze-out stage. The momenta of the particles
are fixed after this point, and the particles freely propagate to the
detector. The particle spectra thus contain information about the kinetic freeze-out stage. Hydrodynamics inspired models such as the Blast-Wave model are used to extract the kinetic freeze-out properties HICs4 ; bes_paper ; prc ; bw . This stage is characterized by the kinetic freeze-out temperature and radial flow velocity , which carry signatures of the transverse expansion of the system. Here, we follow the previously adopted procedures to study the kinetic freeze-out properties in Au+Au collisions at = 14.5 GeV. The chemical freeze-out properties are not discussed in this paper as the final measurements for strange hadrons yields for and are not available. These will be reported in a future STAR paper.
The calculation of kinetic freeze-out parameters is carried out through a Blast-Wave model bw fit to the measured particle spectra in Au+Au collisions at = 14.5 GeV. It is a hydrodynamics inspired model in which the particles are assumed to be locally thermalized at the kinetic freeze-out temperature and move with a common radial flow velocity . For such a radially boosted uniform hard sphere, the transverse momentum distribution of the produced particles can be written as bw ; bes_paper ; prc
| (11) |
where is the transverse mass of the particle, , and and are modified Bessel functions. A flow velocity profile of the following form is used bw ; bes_paper ; prc .
| (12) |
where is the surface velocity, is the radial position in the thermal source with radius R, and the exponent in the flow velocity profile is a parameter. The average transverse radial flow velocity is given by .
To extract the kinetic freeze-out parameters, simultaneous Blast-Wave model fits to the , and spectra are performed bw ; bes_paper ; prc as plotted in Fig. 12 for central Au+Au collisions at = 14.5 GeV. The low- region of the pion spectra is affected by resonance decays, and therefore the pion spectra above GeV/ are used for fitting. The Blast-Wave model is not very suitable for fitting the high region of the spectra fit-bw1 . Hence, the Blast-Wave model fits are very sensitive to the range used fit-bw2 . The previously optimized ranges bes_paper ; prc ; fit-bw2 are used for Au+Au collisions at = 14.5 GeV to extract the kinetic freeze-out parameters. The fit ranges used for pions, kaons, and protons are 0.5–1.35 GeV/, 0.3–1.35 GeV/, and 0.5–1.25 GeV/, respectively.
Figure 13 presents the kinetic freeze-out parameters (left) and (middle) as a function of , and presents the correlation between and (right) for Au+Au collisions at = 14.5 GeV. These results are compared with published data for Au+Au collisions at = 7.7, 11.5, 19.6, 27, 39, 62.4, and 200 GeV measured by STAR in earlier runs bes_paper ; prc . shows a dependence on , decreasing from peripheral to central collisions. This observation supports the prediction of a short-lived fireball in the case of peripheral collisions Tk . The average flow velocity , on the other hand, increases from peripheral to central collisions. This indicates a higher rate of expansion of the system in central collisions. It is also seen that higher RHIC energies such as 62.4 and 200 GeV, have comparatively higher than other BES-I energies. Lastly, the correlation plot between and confirms an anti-correlation between these two quantities, i.e. as decreases, increases. The behavior of the kinetic freeze-out parameters in Au+Au collisions at = 14.5 GeV is consistent with previous observations bes_paper ; prc . The extracted fit parameters , , and along with the /ndf values from the Blast-Wave model fits in Au+Au collisions at = 14.5 GeV are reported in Table 6.
V.6 Azimuthal Anisotropy
V.6.1 The event plane resolution
Due to the finite multiplicity in each event, the event plane angle () deviates from the reaction plane azimuthal angle (). Hence a resolution correction needs to be performed to obtain the correct measurement of the flow coefficients () art1 . For this analysis, the event planes are determined from the TPC in the midrapidity region, and from the BBC at forward rapidity.
Figure 14 shows the second-order event-plane resolution from the TPC (left panel) and the first-order event-plane resolution from the BBC (right panel) as a function of centrality in Au+Au collisions at = 14.5 GeV. The event plane resolution has been calculated for nine collision centralities: 0–5%, 5–10%, 10–20%, 20–30%, 30–40%, 40–50%, 50–60%, 60–70% and 70–80%. As the event plane resolution depends on the number of particles used for event plane reconstruction, it shows a tendency to increase from peripheral to central collisions. On the other hand, the event plane is calculated using the anisotropic flow of the event itself, and therefore it tends to decrease towards central collisions where flow values are small. Because of these two competing effects, the overall resolution first increases from peripheral to mid-central collisions and then decreases. Figure 14 includes event plane resolutions for the same methods at other BES-I energies studied previously by STAR. Due to limited statistics and poor BBC resolution, the FTPC ftpc_star event plane is used instead of BBC at 39 GeV. As expected the resolution of the TPC and BBC event planes decreases as the collision energy increases, since the resolution depends on the multiplicity and on the signal art1 . The 14.5 GeV resolution does not lie between that observed at the adjacent beam energies above and below, and instead is slightly lower than a smooth trend would predict. This is a consequence of the additional material of the Heavy Flavor Tracker close to the beam pipe, which was present only during the 2014 run at 14.5 GeV. The event plane resolution corrections to the observed are applied on an event-by-event basis res_cent ; res_nsm . In this method, the resolution correction has been applied by dividing the flow coefficient of each track, , by the event-plane resolution for the appropriate centrality class.
V.6.2 Comparison of from different methods
Figure 15 presents inclusive charged particle , using various methods, for Au+Au collisions at = 14.5 GeV. The methods have different sensitivities to nonflow effects and fluctuations. For the purpose of exact comparisons, for each method is divided by the elliptic flow based on the two-particle cumulant method (denoted ) and the ratios are shown in the lower panels of Fig. 15. The difference of compared to , , and depends on the range. A larger difference is observed in the low- region ( 1 GeV/). From GeV/ and above, the difference stays roughly constant. The difference between and is relatively small, and is less dependent on . The results suggest that nonflow contributions to the event plane and two-particle correlation methods depend on . They also indicate that the use of the first-order reaction plane (BBC event plane) to study the second harmonic flow reduces flow fluctuations which are not correlated between different harmonics.
V.6.3 Dependence of on transverse momentum, pseudorapidity and centrality
Results for charged particle as a function of for six collision centrality intervals are presented in the top panel of Fig. 16. The shows a monotonically increasing trend with increasing for Au+Au collisions at = 14.5 GeV. The differential also exhibits centrality dependence. The trends of () are similar to those observed at other BES-I energies. The bottom panel of Fig. 16 presents the -integrated for six centrality classes. The has a weak dependence on . Also, there is a clear centrality dependence observed in . The trend of is similar to that for other BES-I energies expdof1 ; expdof2 ; expdof3 ; expdof4 ; bes_paper ; prc ; 200gevprl .
The larger magnitude of in peripheral collisions can be attributed to the larger initial eccentricity in coordinate space for peripheral collisions. The participant eccentricity is the initial configuration space eccentricity of the participating nucleons. The root-mean-square participant eccentricity () is calculated from a MC Glauber model glauber1 ; glauber2 and reported in Table 3.
In Fig. 17, the centrality dependence of over eccentricity is shown for Au + Au collisions at = 14.5 GeV for 10–20%, 30–40%, and 50–60% collision centralities. Central collisions have higher than peripheral collisions. This finding is consistent with a picture where collective interactions are stronger in collisions with a larger number of participants. The centrality dependence of is observed to be similar to that reported previously by STAR expdof1 ; expdof2 ; expdof3 ; expdof4 ; bes_paper ; prc ; 200gevprl .
V.6.4 Beam energy dependence of
The BES-I data from the STAR experiment offer an opportunity to study the collision energy dependence of using a wide-acceptance detector at midrapidity. Figure 18 shows the comparison of the dependence of for = 14.5 GeV at 10–20%, 20–30%, and 30–40% centralities with other published results from STAR expdof1 ; expdof2 ; expdof3 ; expdof4 ; bes_paper ; prc ; 200gevprl ; v2_62gev ; v2_62_200gev and ALICE v2_2.76TeV . One reason to select the results for this comparison is to keep the method for extraction consistent with the published results from ALICE. Another reason is that is found to have low sensitivity to nonflow correlations. The 200 GeV data are empirically fit by a fifth-order polynomial function. For comparison, the from other energies are divided by the fit function and shown in the lower panels of Fig. 18. We choose the 200 GeV data as a reference because its statistical uncertainties are smallest. For below 2 GeV/, the values rise with increasing collision energy. Above 2 GeV/, the values are comparable within statistical uncertainties. The increase of () as a function of energy can be attributed to the change of chemical composition from low to high energies bes_paper and/or larger collectivity at the higher collision energies.
Figure 19 presents the dependence of for = 7.7 to 200 GeV. The 14.5 GeV data points are plotted as solid red stars. The dashed red line in the upper panel in Fig. 19 shows an empirical fit to the results from Au+Au collisions at = 7.7 GeV. The bottom panel presents the ratio of from all beam energies with respect to this fitted curve. The changes shape as the beam energy decreases. The shape at 14.5 GeV follows the trend of other beam energies.
V.6.5 Transverse momentum, pseudorapidity, and centrality dependence of
Measurements of the charged particle in three centralities (0-10%, 10–40% and 40-80%) in Au+Au collisions at = 7.7 – 39 GeV are presented in Fig. 20. This work focuses only on the (pseudo)rapidity-odd component of the first harmonic coefficient (directed flow). Since this component by definition has the property , the integral of over any symmetric range is zero. Therefore, in presenting the above-mentioned pseudorapidity-integrated dependence, the at negative is multiplied by . By definition, must approach zero as approaches zero. The observed starts from a negative value, then crosses zero around 1–2 GeV depending on collision energy and centrality. We see that, in more peripheral collisions and/or at higher energies, the sign change might occur at higher compared to more central collisions and lower energies. The values of the charged particle for three centralities (0-10%, 10–40% and 40-80%) in Au+Au Au+Au collisions at = 14.5 GeV are listed in Table 7.
Figure 21 presents the charged particle as a function of for three centrality classes in Au+Au collisions at = 7.7 – 39 GeV. The slope at midrapidity for charged particles increases from central to peripheral collisions. The trend in as a function of centrality for = 7.7 – 39 GeV shows a similar behavior as observed in other STAR published data expdof1 ; expdof2 ; expdof3 ; expdof4 ; bes_paper ; prc ; 200gevprl . The values of the charged particle as a function of for three centrality classes in Au+Au Au+Au collisions at 14.5 GeV are listed in Table 8.
V.6.6 Beam-energy dependence of
The left panel in Fig. 22 shows a comparison of at 30–60% centrality for Au+Au collisions at = 7.7 – 200 GeV and for Pb+Pb collisions at =2.76 TeV. We observe a clear energy dependence in the for = 7.7 GeV - 2.76 TeV. To calculate the slope of , we fit the data with a function . The linear term in this function () gives the slope (). The right panel in Fig. 22 shows the beam energy dependence of for 0-10%, 10–40% and 40-80% centralities for Au+Au collisions at = 7.7 – 200 GeV. The for 30-60% centrality for the above energies are compared with the same from the published data from Au+Au collisions at = 200 GeV at RHIC and Pb+Pb collisions at = 2.76 TeV at the LHC. We observe a smooth increase in the magnitude of at mid-pseudorapidity with decreasing beam energy for 30-60% centrality.
V.7 Model Comparisons
Measurements from STAR suggest that at 7.7 GeV and 11.5 GeV, particle production is dominated by hadronic processes, whereas at energies around 20 GeV and above, partonic degrees of freedom become more important star_v2_bes_prl ; star_v2_bes_prc ; star_phispectra_bes_prc ; phi_v2_nasim ; star_v2_200gev_prl . The = 14.5 GeV Au+Au collisions analyzed here thus lie in a transition region of great interest. Various bulk properties of the system like , , particle ratios, elliptic flow , and directed flow measured in Au+Au collisions at = 14.5 GeV are compared with calculations from AMPT (version 2.25t7d) ampt and UrQMD (version 3.3p1) urqmd . The initial parameter settings for the models follow the recommendations in the cited papers. The UrQMD model treats only hadronic interactions whereas AMPT has two versions — a string melting version (denoted AMPT-SM) which allows for both partonic and hadronic interactions among the particles, while the default version of AMPT treats only hadronic interactions. Recently, there have been studies with the AMPT-SM model to explain the particle multiplicity and flow measurements at RHIC and LHC using different values of the parton cascade scattering cross-section such as 1.5 mb and 10 mb. It was found that a 1.5 mb scattering cross-section gives a better description of data at these energies Xu:2011fi ; Ye:2017ooc . We have generated AMPT-SM events with two different partonic cross sections (1.5 mb and 10 mb), denoted as AMPT 1.5mb and AMPT 10mb. The larger the partonic cross section, the later the hadronic cascade begins.
V.7.1 Mean transverse momentum
The average of , and as a function of obtained from UrQMD, AMPT 1.5mb and AMPT 10mb model calculations are compared with STAR measurements for Au+Au collisions at = 14.5 GeV in Fig. 23. The value of for all the studied particles is found to be too low in all AMPT-SM calculations. UrQMD is generally too low in also, but is closer to the data, and shows good agreement for protons.
V.7.2 Particle yields
Figure 24 shows divided by versus for , and from Au+Au collisions at = 14.5 GeV. The STAR measurements are compared with UrQMD and with AMPT 1.5mb and AMPT 10mb. UrQMD and AMPT are close to the data for central collisions, but deviate for peripheral collisions. All models disagree markedly with measurements. In the case of protons, AMPT-SM is close, with AMPT 1.5mb being slightly but consistently closer, while UrQMD lies well below the data at all centralities.
V.7.3 Particle ratios
Antiparticle to particle ratios (, and ) as a function of in Au+Au collisions at = 14.5 GeV are shown in Fig. 25. These measured ratios are compared with UrQMD and AMPT-SM calculations. The pion ratios from all models are in close agreement with experiment, while AMPT gets the wrong trends for the kaons. The proton ratios from AMPT-SM are in good agreement with experiment, while UrQMD shows poor agreement.
Figure 26 shows STAR measurements of , , and ratios as a function of in Au+Au collisions at = 14.5 GeV, along with UrQMD and AMPT-SM model calculations. and ratios are under-predicted by all model calculations. In the case of , AMPT-SM straddles the data, and in the case of , AMPT-SM shows good agreement. On the other hand, the latter two ratios are not tracked by UrQMD.
V.7.4 Elliptic flow
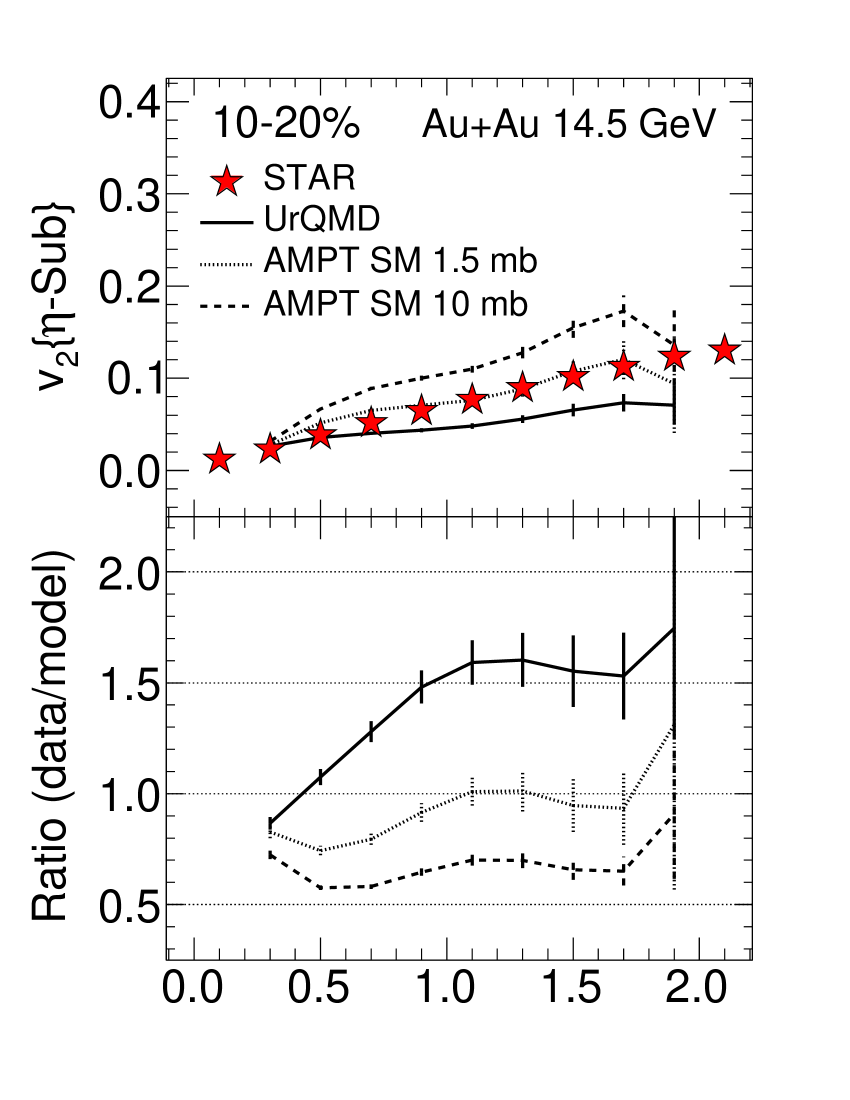
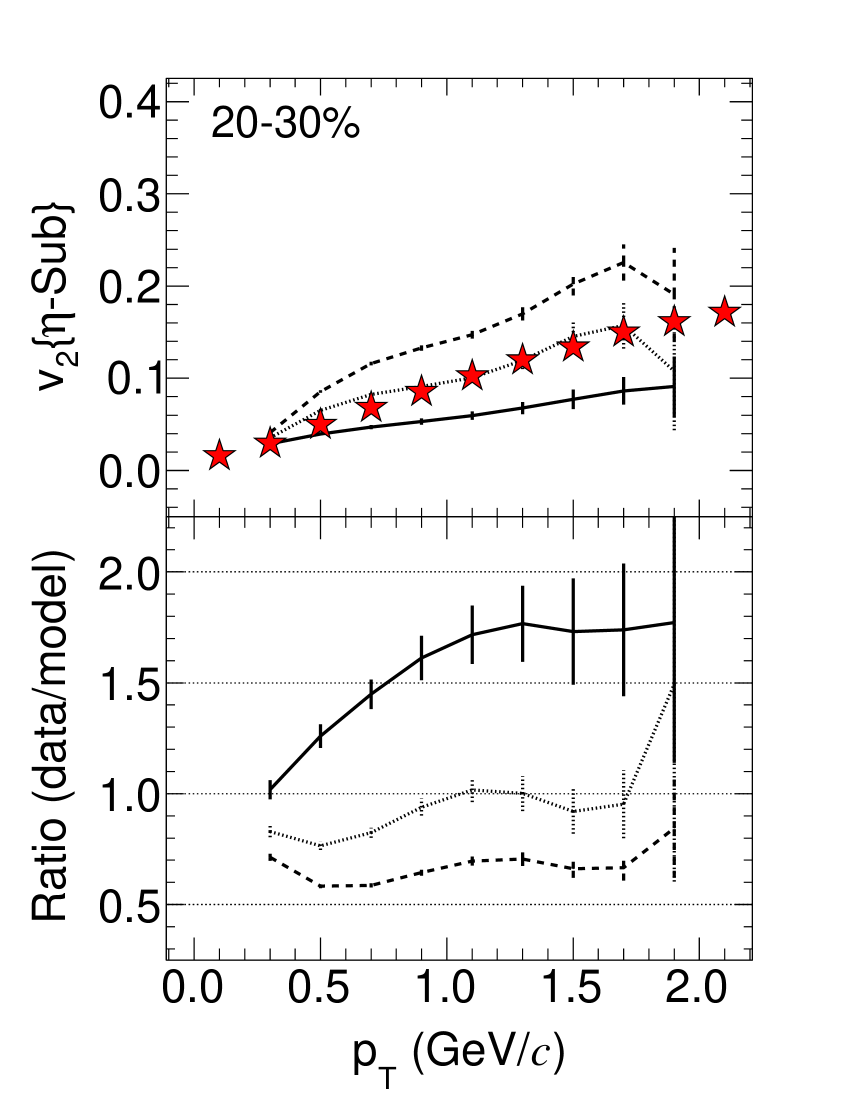
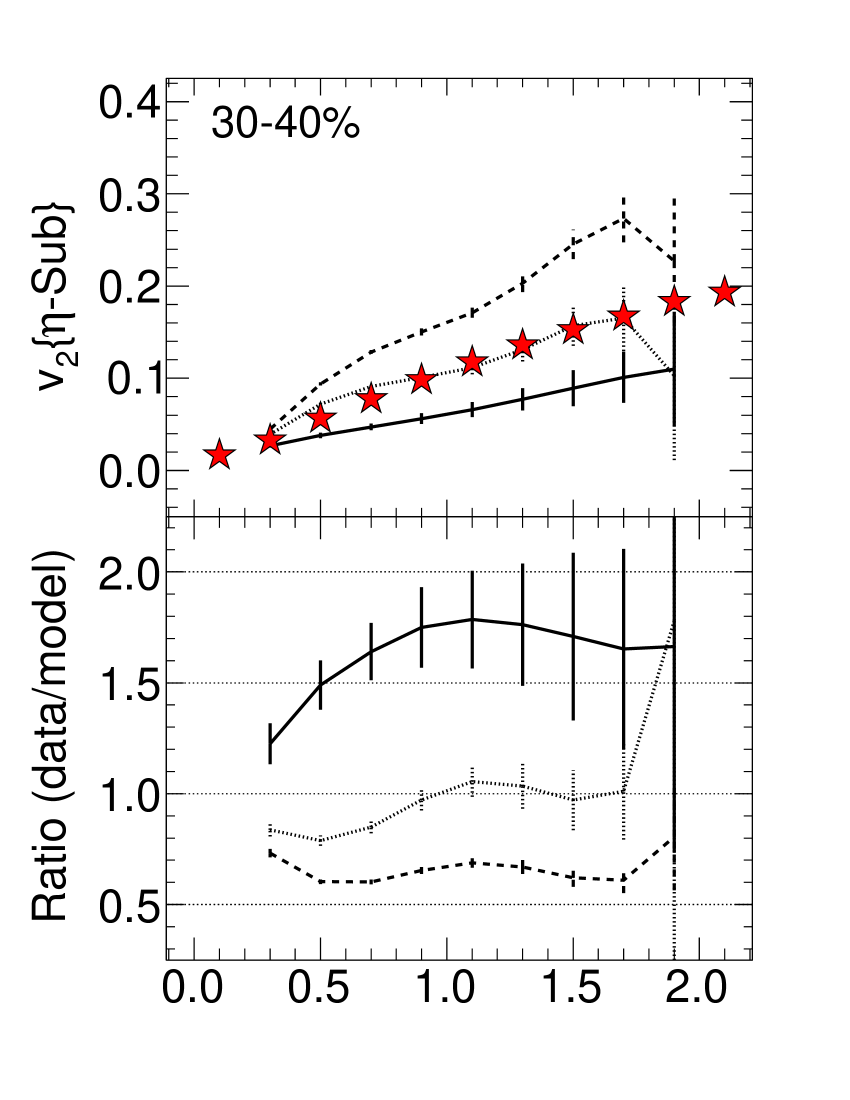
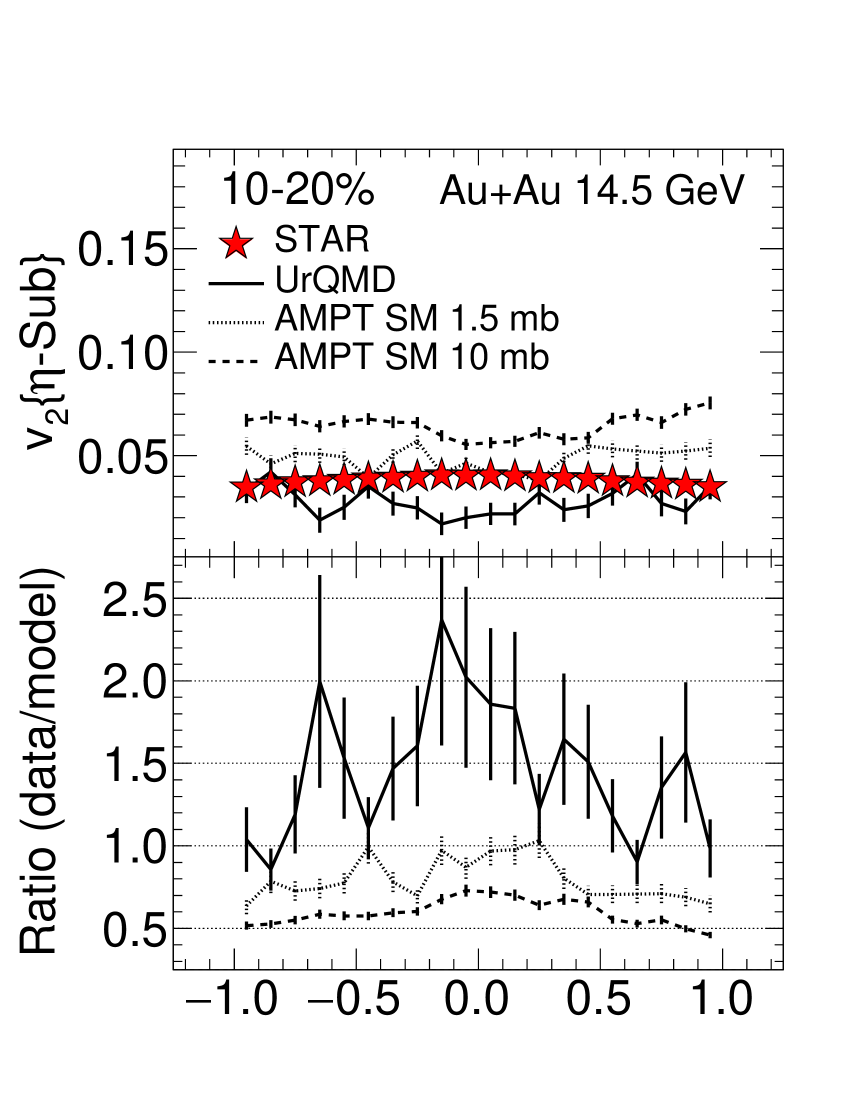
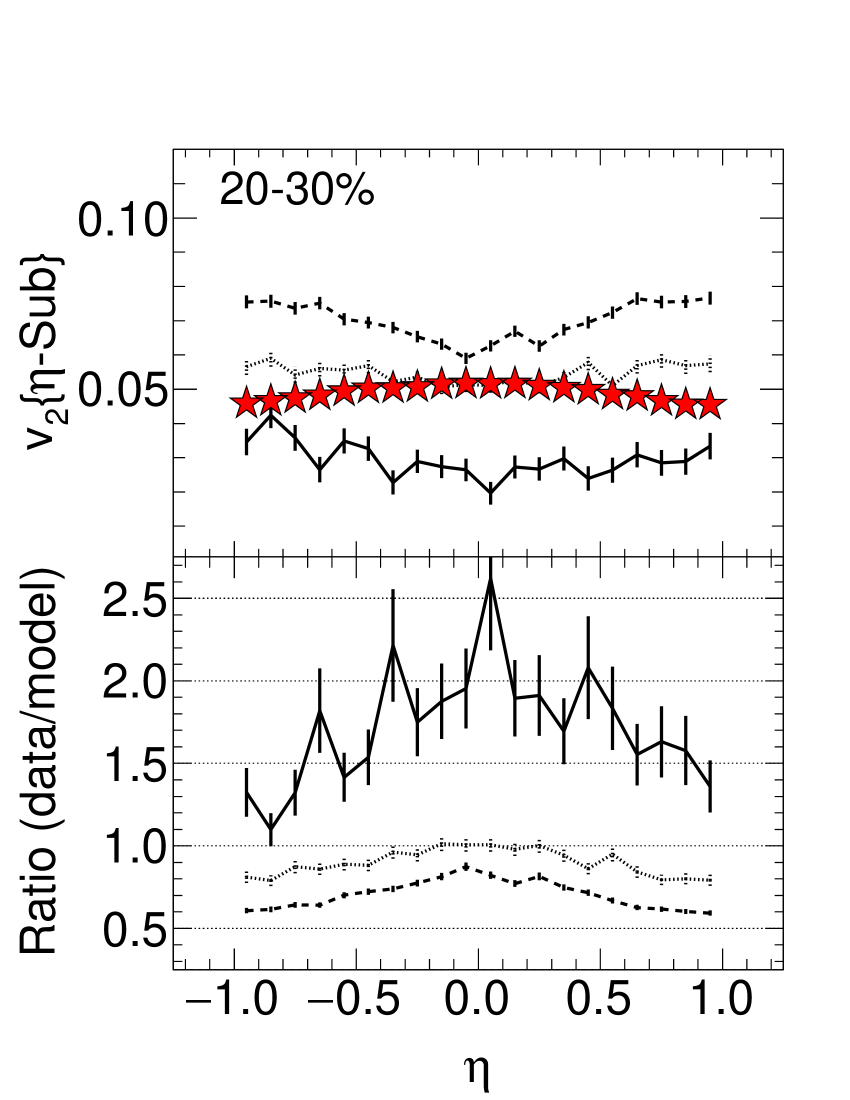
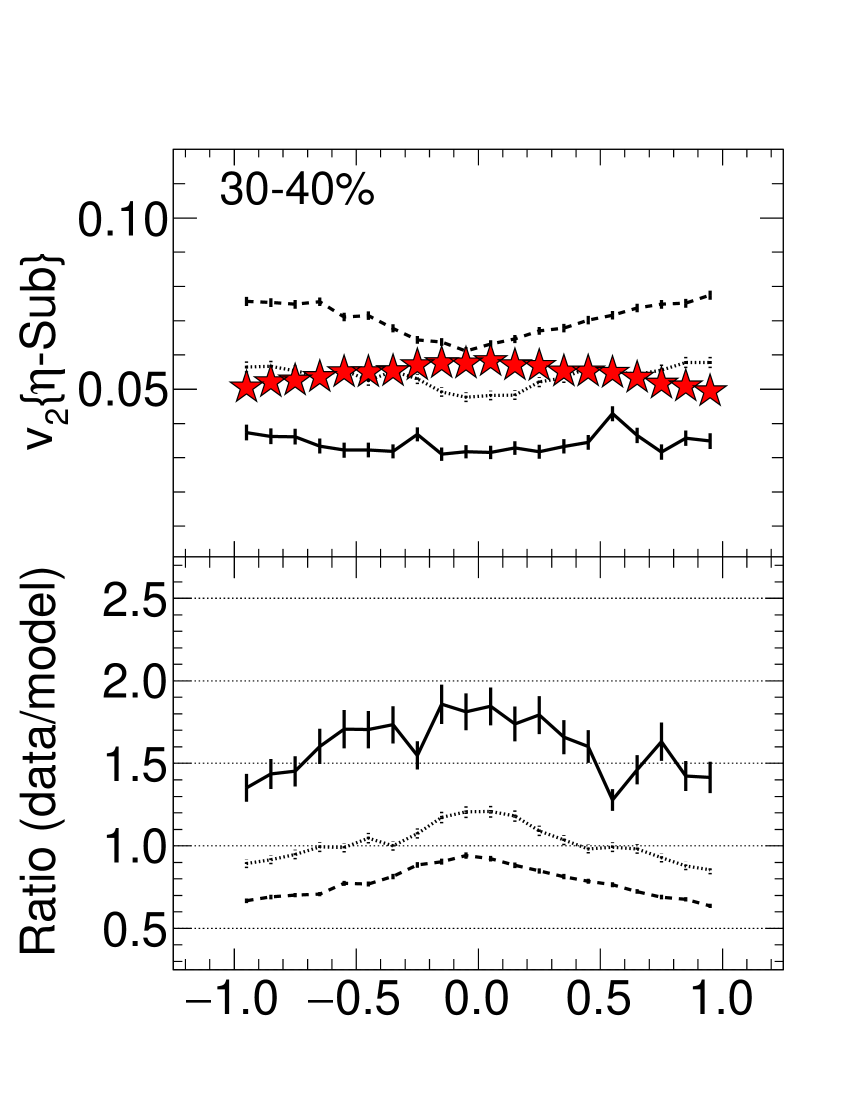
The upper panels of Fig. 27 present the dependence of for 14.5 GeV Au+Au collisions at 10–20%, 20–30% and 30–40% centralities. The STAR measurements are compared with UrQMD, AMPT 1.5mb, and AMPT 10mb. The lower panels of Fig. 27 present the ratio of the experimental data to each model calculation. The AMPT 1.5mb calculation exhibits the best agreement, with AMPT 10mb being consistently too high and UrQMD consistently too low. Figure 28 presents very similar comparisons as Fig. 27, except transverse momentum dependence is replaced by pseudorapidity dependence. Here, again we observe similar behavior, i.e. the AMPT 1.5mb calculation exhibits the better agreement.
V.7.5 Directed flow
Figure 29 presents charged particle (left panel) and (right panel) for 10–40% centrality Au+Au collisions at = 14.5 GeV. These STAR measurements are compared to UrQMD, AMPT, AMPT 1.5mb, and AMPT 10mb model calculations.
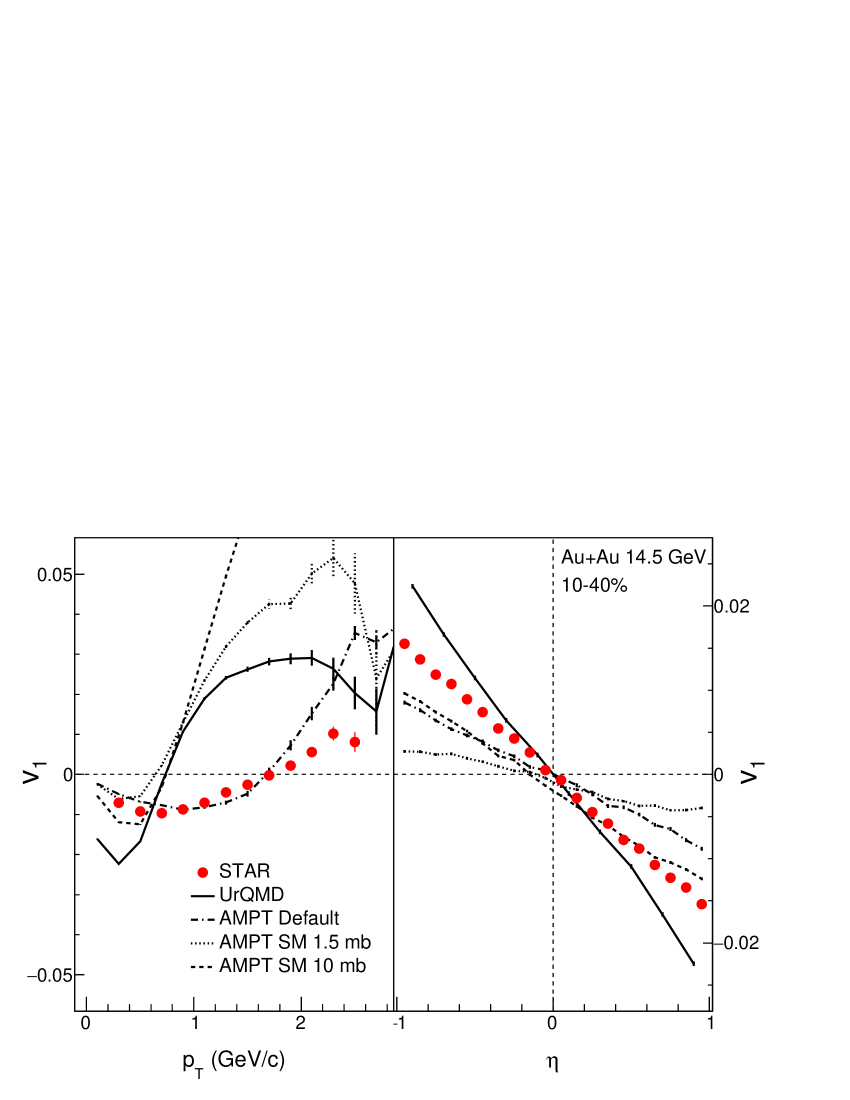
UrQMD shows poor agreement with the measurements, whereas the default AMPT roughly tracks up to GeV/. AMPT 1.5mb and AMPT 10mb are both significantly worse than the default AMPT for . No model calculation agrees with the measured data for . The latest state-of-the-art models do not show even qualitative agreement with measurements for identified particles at BES-I energies v1_review . It should be noted that in both AMPT-SM options, antibaryons violate at , as required by symmetry. This is a known artefact of the implementation of the quark coalescence mechanism in AMPT. A recent paper has shown that this artefact can be fixed with a modified quark coalescence prescription zun_xu .
VI SUMMARY
We have presented basic observables for identified particles in Au+Au collisions at = 14.5 GeV. The transverse momentum spectra of , , , and at midrapidity () are measured for nine centralities: 0–5%, 5–10%, 10–20%, 20–30%, 30–40%, 40–50%, 50–60%, 60–70% and 70–80%. Bulk properties such as average transverse momentum , particle yields , particle ratios, chemical and kinetic freeze-out properties, charged particle elliptic and directed flow ( and ) are extracted for Au+Au collisions at = 14.5 GeV. All the results are compared with the published measurements at other collisions energies.
The mean values for , and increase from peripheral to central collisions – an indication of increasing radial flow in more central collisions. The centrality dependence of radial flow is more pronounced in kaons compared to pions, and in protons compared to kaons.
Midrapidity particle yields for , and show a mild centrality dependence, while no dependence on centrality is observed for . The for , and increase with collision energy, while for it decreases with collision energy up to 39 GeV and then increases. This effect is attributed to baryon stopping at lower RHIC energies.
No significant centrality dependence is observed in the case of and ratios. is slightly greater than unity, which is due to isospin conservation and the contribution from decays of resonances like the . The ratio slightly decreases from peripheral to central collisions as a consequence of increasing baryon stopping in central collisions. The and ratio increases with increasing centrality and follow the energy dependence trend established at other energies. The energy dependence is due to the dominance of pair production over associated production at higher energies. The ratio increases from peripheral to central collisions, but no significant dependence on centrality is observed in the case of ratio.
Kinetic freeze-out parameters are obtained from simultaneous Blast-Wave model fits to the spectra for , and . The kinetic freeze-out temperature decreases from peripheral to central collisions, which is suggestive of a short-lived fireball in peripheral collisions. On the other hand, average flow velocity increases from peripheral to central collisions, indicating larger radial flow for central collisions, consistent with results.
The measured bulk observables are compared to UrQMD and AMPT model calculations. Values of are underestimated by both the UrQMD and AMPT models. The AMPT model agrees with the measured for pions () and protons, but does not reproduce kaon . The UrQMD model mostly shows poor agreement with for all the measured particles. ratios are reproduced within uncertainties by both AMPT and UrQMD models. All models show poor agreement with STAR data of and ratios. The ratio is well described by AMPT but not by UrQMD. The measured and ratios are poorly reproduced by UrQMD, while AMPT does better. The dependence of of charged particles at midrapdity, on and is similar to that observed at other BES-I energies. The in peripheral collisions is larger than in central collisions. A clear centrality dependence is observed in . A weak dependence of the -integrated charged particle on is observed. The shape of at 14.5 GeV resembles that reported at other beam energies.
The magnitude of charged particle increases from central to peripheral collisions at 14.5 GeV, and a similar pattern is observed at other beam energies. The magnitude of decreases with increasing beam energy.
The UrQMD model underpredicts the STAR measurement of charged particle at 14.5 GeV. The AMPT string melting option with 10 mb parton-parton interaction cross section overpredicts the data, while the 1.5 mb option is closer. The UrQMD model shows poor agreement with both and at 14.5 GeV.
The measured observables (, , particle ratios, chemical and kinetic freeze-out parameters, and ) in Au+Au collisions at = 14.5 GeV conform to the smooth trend of beam energy dependence reported in prior publications. The results at 14.5 GeV are important since they fill the gap in of the order of about 100 MeV between beam energies 11.5 GeV and 19.6 GeV. The results will help in tuning the parameters of various models intended to explain the low energy data. Previous measurements by the STAR collaboration have revealed interesting trends related to the dominance of hadronic interaction and partonic interactions in observables such as higher moments of conserved quantities Adamczyk:2013dal , Adamczyk:2014ipa , correlations Adamczyk:2014mzf , azimuthal anisotropy star_v2_bes_prl , and Adamczyk:2017nof between = 11.5 and 19.6 GeV. The data set at 14.5 GeV has provided a clearer understanding of the beam-energy dependence of bulk observables.
VII ACKNOWLEDGEMENTS
We thank the RHIC Operations Group and RCF at BNL, the NERSC Center at LBNL, and the Open Science Grid consortium for providing resources and support. This work was supported in part by the Office of Nuclear Physics within the U.S. DOE Office of Science, the U.S. National Science Foundation, the Ministry of Education and Science of the Russian Federation, National Natural Science Foundation of China, Chinese Academy of Science, the Ministry of Science and Technology of China and the Chinese Ministry of Education, the National Research Foundation of Korea, Czech Science Foundation and Ministry of Education, Youth and Sports of the Czech Republic, Hungarian National Research, Development and Innovation Office (FK-123824), New National Excellency Programme of the Hungarian Ministry of Human Capacities (UNKP-18-4), Department of Atomic Energy and Department of Science and Technology of the Government of India, the National Science Centre of Poland, the Ministry of Science, Education and Sports of the Republic of Croatia, RosAtom of Russia and German Bundesministerium fur Bildung, Wissenschaft, Forschung and Technologie (BMBF) and the Helmholtz Association.
| Centrality (%) | ||||||
|---|---|---|---|---|---|---|
| 338 2 | 788 30 | 0.04 0.01 | 0.10 0.01 | 0.12 0.01 | 25.5 0.6 | |
| 289 6 | 634 20 | 0.11 0.01 | 0.15 0.01 | 0.16 0.01 | 22.9 0.7 | |
| 226 8 | 454 24 | 0.18 0.01 | 0.22 0.01 | 0.24 0.01 | 19.3 0.8 | |
| 159 10 | 283 24 | 0.27 0.01 | 0.30 0.01 | 0.32 0.01 | 15.5 0.9 | |
| 108 10 | 168 22 | 0.32 0.01 | 0.37 0.01 | 0.40 0.01 | 12.4 1.0 | |
| 70 8 | 94 18 | 0.37 0.01 | 0.44 0.01 | 0.47 0.01 | 9.8 1.1 | |
| 44 8 | 50 12 | 0.39 0.01 | 0.51 0.01 | 0.54 0.01 | 7.6 1.1 | |
| 26 7 | 25 9 | 0.40 0.01 | 0.59 0.01 | 0.62 0.01 | 5.6 1.2 | |
| 14 5 | 12 5 | 0.37 0.01 | 0.68 0.01 | 0.72 0.01 | 3.5 1.2 |
| Centra- | ||||||
|---|---|---|---|---|---|---|
| lity() | ||||||
| 141 0.2 14 | 145 0.2 15 | 26.7 0.04 2.8 | 14.9 0.03 1.6 | 39.0 0.03 4.7 | 2.5 0.02 0.3 | |
| 112 0.2 11 | 116 0.1 12 | 22.3 0.04 2.4 | 12.4 0.03 1.2 | 33.1 0.03 4.0 | 2.0 0.01 0.2 | |
| 87.3 0.1 9.1 | 90.0 0.1 9.2 | 16.4 0.03 1.7 | 9.5 0.02 1.0 | 24.5 0.03 2.9 | 1.6 0.01 0.2 | |
| 59.1 0.1 6.1 | 61.3 0.1 6.4 | 10.8 0.02 1.1 | 6.3 0.02 0.6 | 16.2 0.02 2.0 | 1.2 0.01 0.1 | |
| 38.6 0.1 4.0 | 40.0 0.1 4.1 | 6.8 0.02 0.7 | 4.1 0.01 0.4 | 10.5 0.02 1.3 | 0.9 0.01 0.1 | |
| 24.6 0.1 2.6 | 25.5 0.1 2.6 | 4.1 0.01 0.4 | 2.4 0.01 0.3 | 6.3 0.01 0.8 | 0.60 0.004 0.07 | |
| 14.7 0.04 1.5 | 15.4 0.04 1.5 | 2.2 0.01 0.2 | 1.3 0.01 0.1 | 3.5 0.01 0.4 | 0.33 0.003 0.04 | |
| 8.5 0.03 0.9 | 8.8 0.03 0.9 | 1.2 0.01 0.1 | 0.72 0.01 0.07 | 1.9 0.01 0.2 | 0.16 0.003 0.02 | |
| 4.5 0.03 0.5 | 4.8 0.03 0.6 | 0.55 0.01 0.06 | 0.36 0.01 0.04 | 0.6 0.01 0.1 | 0.11 0.002 0.01 |
| Centra- | ||||||
|---|---|---|---|---|---|---|
| lity() | ||||||
| 395 0.1 22 | 392 0.1 21 | 586 0.1 32 | 560 0.1 30 | 811 0.1 53 | 807 0.2 69 | |
| 393 0.1 22 | 390 0.1 21 | 575 0.1 32 | 559 0.1 30 | 798 0.1 52 | 800 0.2 68 | |
| 393 0.2 22 | 388 0.2 21 | 574 0.1 32 | 552 0.1 30 | 781 0.1 51 | 776 0.2 66 | |
| 389 0.2 21 | 384 0.2 20 | 560 0.2 31 | 540 0.1 29 | 765 0.1 50 | 751 0.3 64 | |
| 382 0.2 21 | 380 0.2 20 | 555 0.2 31 | 532 0.1 29 | 730 0.1 48 | 726 0.3 62 | |
| 374 0.3 21 | 374 0.3 20 | 530 0.2 29 | 513 0.1 28 | 686 0.1 45 | 675 0.4 57 | |
| 365 0.3 20 | 366 0.3 19 | 518 0.3 29 | 495 0.2 27 | 646 0.1 42 | 640 0.4 54 | |
| 356 0.4 20 | 355 0.4 19 | 496 0.4 27 | 475 0.2 26 | 627 0.1 40 | 606 0.1 52 | |
| 349 1 19 | 347 1 18 | 484 1 27 | 460 1 25 | 587 2 38 | 573 1 49 |
| Centrality() | (MeV) | ndf | ||
|---|---|---|---|---|
| 114 7 | 0.485 0.036 | 0.97 0.28 | 0.119 | |
| 116 7 | 0.442 0.035 | 0.98 0.29 | 0.097 | |
| 118 7 | 0.429 0.034 | 0.99 0.33 | 0.119 | |
| 122 7 | 0.401 0.034 | 1.00 0.39 | 0.056 | |
| 124 8 | 0.371 0.042 | 1.34 0.42 | 0.123 | |
| 130 6 | 0.312 0.036 | 1.73 0.61 | 0.232 | |
| 134 6 | 0.238 0.031 | 2.26 0.78 | 0.398 | |
| 136 6 | 0.194 0.030 | 2.76 0.87 | 0.484 | |
| 139 7 | 0.168 0.030 | 2.83 1.20 | 0.354 |
| (GeV/) | ( 0–10%) | (10–40%) | (40–80%) |
|---|---|---|---|
| 0.30 | -0.0027 0.0003 0.0001 | -0.0071 0.0001 0.0004 | -0.0130 0.0002 0.0007 |
| 0.50 | -0.0034 0.0003 0.0002 | -0.0093 0.0001 0.0005 | -0.0176 0.0002 0.0008 |
| 0.70 | -0.0032 0.0004 0.0002 | -0.0096 0.0001 0.0004 | -0.0201 0.0003 0.0009 |
| 0.90 | -0.0024 0.0006 0.0003 | -0.0087 0.0002 0.0003 | -0.0216 0.0004 0.0010 |
| 1.10 | 0.0014 0.0008 0.0005 | -0.0070 0.0003 0.0004 | -0.0219 0.0006 0.0007 |
| 1.30 | 0.0019 0.0010 0.0005 | -0.0045 0.0003 0.0001 | -0.0226 0.0008 0.0005 |
| 1.50 | 0.0047 0.0014 0.0007 | -0.0025 0.0005 0.0003 | -0.0209 0.0011 0.0009 |
| 1.70 | 0.0040 0.0019 0.0007 | -0.0002 0.0006 0.0003 | -0.0185 0.0016 0.0008 |
| 1.90 | 0.0079 0.0026 0.0007 | 0.0024 0.0009 0.0003 | -0.0179 0.0023 0.0008 |
| 2.10 | 0.0095 0.0036 0.0014 | 0.0059 0.0012 0.0004 | -0.0173 0.0032 0.0013 |
| 2.30 | 0.0155 0.0050 0.0021 | 0.0097 0.0017 0.0007 | -0.0125 0.0046 0.0015 |
| 2.50 | 0.0089 0.0069 0.0024 | 0.0081 0.0024 0.0007 | -0.0067 0.0065 0.0024 |
| ( 0–10%) | (10–40%) | (40–80%) | |
|---|---|---|---|
| -0.95 | 0.0059 0.0008 0.0007 | 0.0157 0.0003 0.0005 | 0.0334 0.0006 0.0000 |
| -0.85 | 0.0048 0.0008 0.0006 | 0.0137 0.0003 0.0003 | 0.0295 0.0005 0.0000 |
| -0.75 | 0.0034 0.0008 0.0003 | 0.0119 0.0002 0.0001 | 0.0258 0.0005 0.0000 |
| -0.65 | 0.0030 0.0007 0.0003 | 0.0108 0.0002 0.0001 | 0.0211 0.0005 0.0000 |
| -0.55 | 0.0019 0.0007 0.0003 | 0.0089 0.0002 0.0001 | 0.0186 0.0005 0.0000 |
| -0.45 | 0.0015 0.0007 0.0003 | 0.0073 0.0002 0.0001 | 0.0137 0.0005 0.0000 |
| -0.35 | 0.0032 0.0007 0.0003 | 0.0054 0.0002 0.0000 | 0.0111 0.0005 0.0002 |
| -0.25 | 0.0015 0.0007 0.0003 | 0.0043 0.0002 0.0001 | 0.0083 0.0005 0.0001 |
| -0.15 | 0.0015 0.0007 0.0006 | 0.0026 0.0002 0.0001 | 0.0049 0.0005 0.0001 |
| -0.05 | 0.0007 0.0007 0.0004 | 0.0005 0.0002 0.0001 | 0.0013 0.0005 0.0001 |
| 0.05 | -0.0004 0.0007 0.0003 | -0.0007 0.0002 0.0001 | -0.0025 0.0005 0.0002 |
| 0.15 | -0.0008 0.0007 0.0003 | -0.0028 0.0002 0.0001 | -0.0051 0.0005 0.0001 |
| 0.25 | -0.0013 0.0007 0.0004 | -0.0045 0.0002 0.0001 | -0.0072 0.0005 0.0001 |
| 0.35 | -0.0011 0.0007 0.0002 | -0.0058 0.0002 0.0001 | -0.0123 0.0005 0.0001 |
| 0.45 | -0.0009 0.0007 0.0003 | -0.0078 0.0002 0.0002 | -0.0151 0.0005 0.0002 |
| 0.55 | -0.0035 0.0007 0.0003 | -0.0088 0.0002 0.0002 | -0.0182 0.0005 0.0003 |
| 0.65 | -0.0029 0.0007 0.0003 | -0.0107 0.0002 0.0001 | -0.0230 0.0005 0.0001 |
| 0.75 | -0.0034 0.0008 0.0003 | -0.0123 0.0002 0.0000 | -0.0255 0.0005 0.0002 |
| 0.85 | -0.0041 0.0008 0.0008 | -0.0134 0.0002 0.0001 | -0.0285 0.0005 0.0004 |
| 0.95 | -0.0027 0.0008 0.0007 | -0.0154 0.0003 0.0002 | -0.0338 0.0006 0.0005 |
References
- (1) I. Arsene et al. (BRAHMS Collaboration), Nucl. Phys. A 757, 1 (2005).
- (2) K. Adcox et al. (PHENIX Collaboration), Nucl. Phys. A 757, 184 (2005).
- (3) B. B. Back et al. (PHOBOS Collaboration), Nucl. Phys. A 757, 28 (2005).
- (4) J. Adams et al. (STAR Collaboration), Nucl. Phys. A 757, 102 (2005).
- (5) J. Cleymans and K. Redlich, Phys. Rev. C 60, 054908 (1999).
- (6) F. Becattini, J. Manninen, and M. Gazdzicki, Phys. Rev. C 73, 044905 (2006).
- (7) A. Andronic, P. Braun-Munzinger, and J. Stachel, Nucl. Phys. A 772, 167 (2006).
- (8) J. Adams et al. (STAR Collaboration), Phys. Rev. Lett. 91, 072304 (2003).
- (9) J. Adams et al. (STAR Collaboration), Phys. Rev. Lett. 91, 172302 (2003).
- (10) B. Abelev et al. (STAR Collaboration), Phys. Rev. Lett. 97, 152301 (2006).
- (11) B. Abelev et al. (STAR Collaboration), Phys. Lett. B 655, 104 (2007).
- (12) B. Abelev et al. (STAR Collaboration), Phys. Rev. Lett. 99, 112301 (2007).
- (13) B. Abelev et al. (STAR Collaboration), Phys. Rev. C 77, 054901 (2008).
- (14) K. Rajagopal and F. Wilczek, in At the Frontier of Particle Physics/Handbook of QCD, edited by M. Shifman (World Scientific, 2001), Vol. 3, Chap. 35.
- (15) F. Karsch, E. Laermann, A. Peikert, Nucl. Phys. B 605, 579 (2001).
- (16) E. Laermann and O. Philipsen, Ann. Rev. Nucl. Part. Sci. 53, 163 (2003).
- (17) M. Stephanov, PoS LAT2006, 024 (2006).
- (18) L. Adamczyk et al. (STAR Collaboration), Phys. Rev. Lett. 118, 212301 (2017).
- (19) Y. Aoki, G. Endrodi, Z. Fodor, et al., Nature 443, 675 (2006).
- (20) M. Cheng, N. Christ, S. Datta, et al., Phys. Rev. D 77, 014511 (2008).
- (21) S. Ejiri, Phys. Rev. D 78, 074507 (2008).
- (22) M. Asakawa and K. Yazaki, Nucl. Phys. A 504, 668 (1989).
- (23) A. Barducci, R. Casalbuoni, S. De Curtis, et al., Phys. Lett. B 231, 463 (1989).
- (24) A. Barducci, R. Casalbuoni, S. De Curtis, et al., Phys. Rev. D 41, 1610 (1990).
- (25) M. A. Stephanov, Prog. Theor. Phys. Suppl. 153, 139 (2004).
- (26) Z. Fodor and S. Katz, JHEP 04, 050 (2004).
- (27) R. Gavai and S. Gupta, Phys. Rev. D 78, 114503 (2008).
- (28) B. Abelev et al. (STAR Collaboration), Phys. Rev. C 81, 024911 (2010).
- (29) B. Mohanty, Nucl. Phys. A 830, 899c (2009).
- (30) M. Aggarwal et al. (STAR Collaboration), arXiv:1007.2613.
- (31) L. Kumar, Mod. Phys. Lett. A 28, 1330033 (2013).
- (32) L. Adamczyk et al., (STAR Collaboration), Phys. Rev. C 96, 044904 (2017).
- (33) S. A. Bass et al., Prog. Part. Nucl. Phys. 41, 255 (1998); M. Bleicher et al., J. Phys. G 25, 1859 (1999).
- (34) Z. W. Lin, C. M. Ko, B. A. Li, et al., Phys.Rev. C 72, 064901 (2005).
- (35) L. Adamczyk et al. (STAR Collaboration), Phys. Rev. Lett. 112, 032302 (2014).
- (36) L. Adamczyk et al. (STAR Collaboration), Phys. Rev. Lett. 112, 162301 (2014).
- (37) L. Adamczyk et al. (STAR Collaboration), Phys. Rev. Lett. 113, 052302 (2014).
- (38) L. Adamczyk et al. (STAR Collaboration), Phys. Rev. Lett. 110, 142301 (2013).
- (39) L. Adamczyk et al. (STAR Collaboration), Phys. Rev. C 88, 014902 (2013).
- (40) L. Adamczyk et al. (STAR Collaboration), Phys. Rev. C 93, 021903(R) (2016).
- (41) Md. Nasim, Phys. Rev. C 89, 034909 (2014).
- (42) L. Adamczyk et al. (STAR Collaboration), Phys. Rev. Lett. 116, 062301 (2016).
- (43) L. Adamczyk et al. (STAR Collaboration), Phys. Rev. Lett. 120, 062301 (2018).
- (44) L. Adamczyk et al. (STAR Collaboration), Phys. Rev. Lett. 121, 032301 (2018).
- (45) K. Ackermann et al. (STAR Collaboration), Nucl. Instrum. Methods Phys. Res. A 499, 624 (2003).
- (46) F. Bieser, H. Crawford, J. Engelage et al., Nucl. Instrum. Methods Phys. Res. A 499, 766 (2003).
- (47) C. A. Whitten (STAR Collaboration), AIP Conf. Proc. 980, 390 (2008).
- (48) M. Anderson, J. Berkovitz, W. Betts et al., Nucl. Instrum. Methods Phys. Res. A 499, 659 (2003).
- (49) W. Llope, Nucl. Instrum. Methods Phys. Res. B 241, 306 (2005).
- (50) L. Adamczyk et al. (STAR Collaboration), Phys. Rev. C 86, 054908 (2012).
- (51) H. Bichsel, Nucl. Instrum. Methods Phys. Res. A 562, 154 (2006).
- (52) M. Aguilar-Benitez, W. Allison, A. Batalov et al., Z. Phys. C 50, 405 (1991).
- (53) M. Shao et al, Nucl. Instrum. Methods Phys. Res. A 558, 419 (2006).
- (54) A. M. Poskanzer and S. A. Voloshin, Phys. Rev. C 58, 1671 (1998).
- (55) H. Masui, A. Schmah and A. Poskanzer, Nucl. Instrum. Methods Phys. Res. A 833, 181 (2016).
- (56) M. Nasim and B. Mohanty, Int. J. of Mod. Phys. E 24, 1550027 (2015).
- (57) G. Agakishiev et al. (STAR Collaboration), Phys. Rev. C 85, 014901 (2012).
- (58) A. Bilandzic, R. Snellings, and S. Voloshin, Phys. Rev. C 83, 044913 (2011).
- (59) N. Borghini, P. M. Dinh, and J.-Y. Ollitrault, Phys. Rev. C 64, 054901 (2001).
- (60) B. Abelev et al. (STAR Collaboration), Phys. Rev. C 79, 034909 (2009).
- (61) X.-N. Wang and M. Gyulassy, Phys. Rev. D 44, 3501 (1991).
- (62) V. Fine and P. Nevski, Proc. CHEP 2000, 143 (2000).
- (63) J. Adams et al. (STAR Collaboration), Phys. Rev. C 70, 041901 (2004).
- (64) M. M. Aggarwal et al. (STAR Collaboration), Phys. Rev. C 83, 034910 (2011).
- (65) J. Adams et al. (STAR Collaboration), Phys. Rev. Lett. 92, 112301 (2004).
- (66) E. Schnedermann, J. Sollfrank, and Y. W. Heinz, Phys. Rev. C 48, 2462 (1993).
- (67) U. Heinz and R. Snellings, Ann. Rev. Nucl. Part. Sci. 63, 123 (2013).
- (68) X. N. Wang and M. Gyulassy, Phys. Rev. Lett. 86, 3496 (2001).
- (69) J. Randrup and J. Cleymans, Phys. Rev. C 74, 047901 (2006).
- (70) N. Xu and M. Kaneta, Nucl. Phys. A 698, 306 (2002).
- (71) J. Cleymans, B. Kampfer, M. Kaneta, S. Wheaton and N. Xu, Phys. Rev. C 71, 054901 (2005).
- (72) S. Wheaton, J. Cleymans and M. Hauer, Comput. Phys. Commun. 180, 84 (2009).
- (73) A. Andronic, F. Beutler, P. Braun-Munzinger, et al., Phys. Lett. B 675, 312 (2009).
- (74) G. Wilk and Z. Wlodarczyk, Phys. Rev. Lett. 84, 2770 (2000).
- (75) B. Abelev et al. (ALICE Collaboration), Phys. Rev. C 88, 044910 (2013).
- (76) U. W. Heinz, arXiv:hep-ph/0407360.
- (77) K. H. Ackermann et al., Nucl. Instrum. Methods A 499, 713 (2003).
- (78) M. Miller, R. Snellings, arXiv:nucl-ex/0312008.
- (79) M. L. Miller, K. Reygers, S. J. Sanders, and P. Steinberg, Annu. Rev. Nucl. Part. Sci. 57, 205 (2007).
- (80) J. Adams et al. (STAR Collaboration), Phys. Rev. C 73, 034903 (2006).
- (81) B. I. Abelev et al. (STAR Collaboration), Phys. Rev. Lett. 101, 252301 (2008).
- (82) K. Aamodt et al. (ALICE Collaboration), Phys. Rev. Lett. 105, 252302 (2010).
- (83) J. Xu and C. M. Ko, Phys. Rev. C 83, 034904 (2011).
- (84) Y. J. Ye, J. H. Chen, Y. G. Ma, S. Zhang and C. Zhong, Chin. Phys. C 41, 084101 (2017).
- (85) S. Singha, P. Shanmuganathan and D. Keane, Adv. High Energy Physics 2016, 2836989 (2016).
- (86) C.-Q. Guo, C.-J. Zhang and J. Xu, Eur. Phys. J. A 53, 233 (2017).