Recalibration of the binding energy of hypernuclei measured in emulsion experiments and its implications ††thanks: Supported by the Key Research Program of the Chinese Academy of Science (XDPB09), the National Natural Science Foundation of China (11890714, 11775288, 11421505, 11520101004), the China Scholarship Council (201704910615), the U.S. Department of Energy, Office of Science (DE-FG02-89ER40531, DE-SC-0012704)
Abstract
The separation energy for -hypernuclei, denoted , measured in 1967, 1968, and 1973 are recalibrated using the current best mass estimates for particles and nuclei. The recalibrated are systematically larger (except in the case of He) than the original published values by about 100 keV. The effect of this level of recalibration is very important for light hypernuclei, especially for the hypertriton. The early values measured in 1967, 1968, and 1973 are widely used in theoretical research, and the new results provide better constraints on the conclusions from such studies.
keywords:
Hypernuclei, Binding energy, Recalibrationpacs:
21.80.+a, 21.10.−k, 21.10.Dr
1 Introduction
A hypernucleus contains one or more strange quarks, and in the most common type of hypernucleus, a neutron is replaced by a hyperon. The first hypernucleus was discovered by Marion Danysz and Jerzy Pniewski in 1952 in a balloon-flown emulsion plate [1]. Many other hypernuclei were observed during the following few years in emulsion experiments[2, 3]. The hypertriton is the lightest hypernucleus, and is composed of a proton, a neutron, and a hyperon. The antimatter partner of the hypertriton was discovered in a heavy ion collision experiment by the STAR collaboration at the Relativistic Heavy Ion Collider (RHIC) located at Brookhaven National Laboratory in 2010[4] and confirmed in 2015 by the ALICE collaboration at the Large Hadron Collider (LHC) located at CERN[5]. The hyperon-nucleon () interaction plays an important role in understanding the strong nuclear force [6, 7], and since hyperons may exist in the core of neutron stars[8], the interaction is also of importance for the study of neutron star properties[9, 10, 8]. Hyperon-nucleon scattering would be a good tool to explore the interaction, however it is very challenging to obtain stable hyperon beams due to the hyperon’s very short lifetime. Hypernuclei are a natural interaction system and thus their lifetime and binding energy have a direct connection to the strength of interaction[11, 12, 13]. A precise determination of hypernuclear lifetime and binding energy can serve as critical inputs for theoretical study of the strong force and of neutron star interiors[6, 7, 8, 9, 10, 11, 12, 14, 15, 16].
Although data on hyperon-nucleon scattering is lacking, measurements of the separation energy for -hypernuclei have been available through nuclear emulsion experiments[2, 3, 9, 17, 18, 19, 20]. The separation energy is defined as (, where , and are the mass of hypernucleus, the hyperon, and the nuclear core of the hypernucleus, respectively, and is the speed of light. The measurements provided by emulsion experiments need to be revisited because the masses of particles and nuclei used in the original publications are different from contemporary best estimates from the PDG (Particle Data Group)[21] and the AMDC (Atomic Mass Data Center, located at the Institute of Modern Physics, Chinese Academy of Sciences, Lanzhou)[22, 23]. A case in point is a recent improved measurement of the hypertriton’s reported by the STAR collaboration in 2019[24, 25], where the best estimate is significantly larger than the previous commonly-cited value published in 1973[20]. However, the early measurements of have been used as critical inputs for theoretical research. For example, Ref.[11] applied the EFT approach at LO to -shell hypernuclei with precise few-body stochastic variational method calculations to address the over-binding problem of He. In another relevant example, Ref.[10] considered two different models of three-body force which is constrained by the separation energy of medium-mass hypernuclei, but the authors obtained dramatically different results for the maximum mass of neutron stars using different models of the three-body force. Stronger constraints on the interaction are necessary to properly understand the role of hyperons in neutron stars. From this point of view, it is timely and highly desirable to recalibrated these early measurements using the contemporary best mass estimates for particles and nuclei[21, 22, 23] to provide more accurate constraints for contemporary studies[9, 11, 26, 27].
2 Techniques of recalibration
| (2) |
where is the total kinetic energy released when a hypernucleus decays through a mesonic decay channel, represents the nuclear core of the hypernucleus, is the mass of a particle or nucleus, and the subscript refers to the decay daughter. was determined using the range-energy relation in emulsion[2, 3, 18, 19, 20, 28], while was directly determined from the masses of particles and nuclei available at the time of publication. A series of papers for nuclide masses was published at that time (in 1954[29], 1960[30, 31], 1962[32], 1965[33], 1971[34], and 1977[35]), and the nuclide masses published in 1960[30, 31] were used in Ref.[17] on measurements. Ref.[17] shared the same corresponding author as Refs.[18, 19, 20], and therefore we assume here that the masses used in 1967[18] and 1968[19] were taken from the nuclide mass paper published in 1965[33]. We also assume here that the masses used in 1973[20] were taken from the nuclide mass paper published in 1971[34]. The masses for , proton, , and the relevant nuclei used in the past and in 2019 are listed in Table 1. From Table 1, it is evident that the early masses of particles and nuclei are different from current values. Consequently, the values used in 1967, 1968, and 1973 were such that the original published measurements were not as accurate as they could be. Fortunately, the early values can be recalibrated by comparing the difference in between the old publications and modern numbers. According to the masses listed in Table 1, the for light hypernuclei with mass number 3 - 15 are calculated for specific decay channels in the years 1967, 1968, 1973, and 2019. Table 2 presents and , where the latter is the difference between in 2019 and in the specific earlier year. is used for recalibrating the measured in 1967, 1968, and 1973. The original is recalibrated for each decay channel listed in Table 2. After recalibration, this paper provides more precise estimations of the values. Table 3 lists the original and recalibrated values for a combination of all available decay channels for the listed -hypernuclei with mass numbers 3-15.
We note that the early emulsion measurements in 1968 and 1973 benefited from a compensating effect in normalizing the values via measuring the mass of the hyperon with the decay daughter range of 1-2 cm in the same emulsion stack[19, 20]. Because the mass of hyperon and the appear with opposite sign in equation 1, it was argued that systematic errors arising from uncertainties in both the range-energy relation and the emulsion density had been largely offset by the normalization procedure and a small systematic error of 0.04 MeV was determined for the early measurements[19, 20, 36, 37, 38]. Although an identical mass was measured in 1968 and 1973, the differences of between measurements in these two years are large (up to 0.50 0.17 (stat.) MeV[20]), which is significantly larger than the systematic error of 0.04 MeV. The ranges of from decays in the emulsion experiments were chose to be 1-2 cm, a range interval that covers the great majority of from hypernuclear decays. Nevertheless, the distribution of ranges from decay and hypernuclear decay are different[19, 20, 28]. This difference in range can also yield a difference in the measured value as large as 0.43 0.13 (stat.) MeV [28], and cannot ensure the deviations of measured value for decay and hypernuclear decay are in the same direction[28]. Recent precise measurements show that for p-shell hypernuclei, there is a discrepancy in the range of 0.4-0.8 MeV between early emulsion measurements and their measurements[39]. The authors of Ref.[39] also argued that the emulsion data significantly underestimated the systematic error, which is dependent on the specific hypernucleus. Based on the above statement, we believe that the compensating effect described above may not fully account for the systematic error, and a recalibration of the differences seems to be a more reliable method.
| Particle/Nucleus | NPB1 (1967)[18] | NPB4 (1968)[19] | NPB52 (1973)[20] | 2019 |
|---|---|---|---|---|
| 139.59[40] | 139.58[41] | 139.58[42] | 139.57[21] | |
| p | 938.26[40] | 938.26[41] | 938.26[42] | 938.27[21] |
| 1115.44[19] | 1115.57[19] | 1115.57[20] | 1115.68[21] | |
| d | 1875.51 | 1875.51 | 1875.63 | 1875.61 |
| t | 2808.76 | 2808.76 | 2808.95 | 2808.92 |
| 3He | 2808.23 | 2808.23 | 2808.42 | 2808.39 |
| 4He | 3727.17 | 3727.17 | 3727.42 | 3727.38 |
| 5He | 4667.64 | 4667.64 | 4667.89 | 4667.68 |
| 6He | 5605.22 | 5605.22 | 5605.60 | 5605.53 |
| 6Li | 5601.20 | 5601.20 | 5601.58 | 5601.52 |
| 6Be | 5604.97 | 5604.97 | 5605.35 | 5605.30 |
| 7Li | 6533.46 | 6533.46 | 6533.90 | 6533.83 |
| 7Be | 6533.81 | 6533.81 | 6534.25 | 6534.18 |
| 8Li | 7470.94 | 7470.94 | 7471.45 | 7471.36 |
| 8Be | 7454.43 | 7454.43 | 7454.93 | 7454.85 |
| 8B | 7471.90 | 7471.90 | 7472.40 | 7472.32 |
| 9Be | 8392.28 | 8392.28 | 8392.84 | 8392.75 |
| 9B | 8392.83 | 8392.83 | 8393.40 | 8393.31 |
| 10Be | 9324.97 | 9324.97 | 9325.60 | 9325.50 |
| 10B | 9323.91 | 9323.91 | 9324.54 | 9324.44 |
| 11B | 10251.96 | 10251.96 | 10252.66 | 10252.55 |
| 11C | 10253.43 | 10253.43 | 10254.13 | 10254.02 |
| 12C | 11174.23 | 11174.23 | 11174.98 | 11174.86 |
| 13C | 12108.79 | 12108.79 | 12109.61 | 12109.48 |
| 13N | 12110.50 | 12110.50 | 12111.32 | 12111.19 |
| 14N | 13039.46 | 13039.46 | 13040.34 | 13040.20 |
| 15O | 13970.39 | 13970.39 | 13971.33 | 13971.18 |
| Hypernucleus | Decay modes | NPB1 (1967)[18] | NPB4 (1968)[19] | NPB52 (1973)[20] | 2019 | |||
|---|---|---|---|---|---|---|---|---|
| H | + 3He | 43.13 | 0.20 | 43.27 | 0.06 | 43.20 | 0.13 | 43.33 |
| + p + d | 37.59 | 0.25 | 37.73 | 0.11 | 37.73 | 0.11 | 37.84 | |
| H | + 4He | 57.44 | 0.21 | 57.58 | 0.07 | 57.52 | 0.13 | 57.65 |
| + p + t | 37.59 | 0.25 | 37.73 | 0.11 | 37.73 | 0.11 | 37.84 | |
| + d + d | 33.59 | 0.22 | 33.73 | 0.08 | 33.68 | 0.13 | 33.81 | |
| He | + p + 3He | 37.59 | 0.25 | 37.73 | 0.11 | 37.73 | 0.11 | 37.84 |
| + p + p + d | 32.05 | 0.30 | 32.19 | 0.16 | 32.26 | 0.09 | 32.35 | |
| He | + p + 4He | 37.59 | 0.25 | 37.73 | 0.11 | 37.73 | 0.11 | 37.84 |
| + d + 3He | 19.28 | 0.21 | 19.42 | 0.07 | 19.36 | 0.13 | 19.49 | |
| + p + p + t | 17.74 | 0.29 | 17.88 | 0.15 | 17.94 | 0.09 | 18.03 | |
| + p + d + d | 13.74 | 0.26 | 13.88 | 0.12 | 13.89 | 0.11 | 14.00 | |
| He | + d + 4He | 40.81 | -0.01 | 40.95 | -0.15 | 40.83 | -0.03 | 40.80 |
| He | + 7Li | 47.61 | 0.20 | 47.75 | 0.06 | 47.69 | 0.12 | 47.81 |
| + p + 6He | 37.59 | 0.25 | 37.73 | 0.11 | 37.73 | 0.11 | 37.84 | |
| + t + 4He | 45.14 | 0.20 | 45.28 | 0.06 | 45.22 | 0.12 | 45.34 | |
| + p + t + t | 25.29 | 0.24 | 25.43 | 0.10 | 25.43 | 0.10 | 25.53 | |
| Li | + p + 6Li | 37.59 | 0.25 | 37.73 | 0.11 | 37.73 | 0.11 | 37.84 |
| + 3He + 4He | 41.65 | 0.21 | 41.79 | 0.07 | 41.73 | 0.13 | 41.86 | |
| + p + d + 4He | 36.11 | 0.26 | 36.25 | 0.12 | 36.26 | 0.11 | 36.37 | |
| Be | + p + p + p + 4He | 38.87 | 0.35 | 39.01 | 0.21 | 39.14 | 0.08 | 39.22 |
| Li | + 4He + 4He | 54.97 | 0.21 | 55.11 | 0.07 | 55.05 | 0.13 | 55.18 |
| + p + t + 4He | 35.12 | 0.25 | 35.26 | 0.11 | 35.26 | 0.11 | 35.37 | |
| + d + d + 4He | 31.12 | 0.22 | 31.26 | 0.08 | 31.21 | 0.13 | 31.34 | |
| + d + 6Li | 32.60 | 0.21 | 32.74 | 0.07 | 32.68 | 0.13 | 32.81 | |
| Be | + 8B | 37.76 | 0.21 | 37.90 | 0.07 | 37.84 | 0.13 | 37.97 |
| + p + 7Be | 37.59 | 0.25 | 37.73 | 0.11 | 37.73 | 0.11 | 37.84 | |
| + p + 3He + 4He | 36.00 | 0.25 | 36.14 | 0.11 | 36.14 | 0.11 | 36.25 | |
| + p + p + 6Li | 31.94 | 0.29 | 32.08 | 0.15 | 32.14 | 0.09 | 32.23 | |
| + p + p + d + 4He | 30.46 | 0.30 | 30.60 | 0.16 | 30.67 | 0.09 | 30.76 | |
| Li | + 9Be | 54.51 | 0.21 | 54.65 | 0.07 | 54.60 | 0.12 | 54.72 |
| + p + 8Li | 37.59 | 0.25 | 37.73 | 0.11 | 37.73 | 0.11 | 37.84 | |
| + t + 6Li | 36.83 | 0.20 | 36.97 | 0.06 | 36.91 | 0.12 | 37.03 | |
| Be | + 9B | 37.45 | 0.20 | 37.59 | 0.06 | 37.52 | 0.13 | 37.65 |
| + p + 4He + 4He | 37.68 | 0.25 | 37.82 | 0.11 | 37.82 | 0.11 | 37.93 | |
| B | + p + 8B | 37.59 | 0.25 | 37.73 | 0.11 | 37.73 | 0.11 | 37.84 |
| + p + p + p + 6Li | 31.77 | 0.33 | 31.91 | 0.19 | 32.03 | 0.07 | 32.10 | |
| Be | + p + p + 8Li | 20.67 | 0.29 | 20.81 | 0.15 | 20.86 | 0.10 | 20.96 |
| B | + p + 9B | 37.59 | 0.25 | 37.73 | 0.11 | 37.73 | 0.11 | 37.84 |
| + p + p + 4He + 4He | 37.82 | 0.30 | 37.96 | 0.16 | 38.03 | 0.09 | 38.12 | |
| B | + 11C | 46.33 | 0.20 | 46.47 | 0.06 | 46.40 | 0.13 | 46.53 |
| + p + d + 4He + 4He | 31.65 | 0.26 | 31.79 | 0.12 | 31.80 | 0.11 | 31.91 | |
| + 4He + 7Be | 38.78 | 0.21 | 38.92 | 0.07 | 38.86 | 0.13 | 38.99 | |
| + 3He + 4He + 4He | 37.19 | 0.21 | 37.33 | 0.07 | 37.27 | 0.13 | 37.40 | |
| + p + 4He + 6Li | 33.13 | 0.25 | 33.27 | 0.11 | 33.27 | 0.11 | 33.38 | |
| + t + 8B | 19.10 | 0.21 | 19.24 | 0.07 | 19.18 | 0.13 | 19.31 | |
| B | + 4He + 4He + 4He | 46.30 | 0.22 | 46.44 | 0.08 | 46.39 | 0.13 | 46.52 |
| C | + 13N | 39.58 | 0.20 | 39.72 | 0.06 | 39.65 | 0.13 | 39.78 |
| + p + 4He + 4He + 4He | 30.31 | 0.25 | 30.45 | 0.11 | 30.45 | 0.11 | 30.56 | |
| N | + 15O | 44.92 | 0.21 | 45.06 | 0.07 | 45.00 | 0.13 | 45.13 |
| Hypernucleus | NPB1 (1967)[18] | NPB4 (1968)[19] | NPB52 (1973)[20] | |||
| Original | Recalibrated | Original | Recalibrated | Original | Recalibrated | |
| H | 0.20 0.12 | 0.41 | 0.01 0.07 | 0.08 | 0.15 0.08 | 0.27 |
| H | 2.13 0.06 | 2.35 | 2.23 0.03 | 2.31 | 2.08 0.06 | 2.20 |
| He | 2.20 0.06 | 2.45 | 2.36 0.04 | 2.47 | 2.42 0.04 | 2.53 |
| He | 3.08 0.03 | 3.33 | 3.08 0.02 | 3.19 | 3.17 0.02 | 3.28 |
| He | 4.09 0.27 | 4.08 | 4.38 0.19 | 4.23 | 4.42 0.13 | 4.39 |
| He | 4.67 0.28 | 4.88 | 4.25 0.25 | 4.34 | No data | No data |
| Li | 5.46 0.12 | 5.68 | 5.60 0.07 | 5.67 | 5.64 0.04 | 5.77 |
| Be | 5.36 0.23 | 5.71 | 5.06 0.19 | 5.27 | 5.09 0.11 | 5.17 |
| Li | 6.72 0.08 | 6.93 | 6.84 0.06 | 6.91 | 6.81 0.03 | 6.94 |
| Be | 6.67 0.16 | 6.89 | 6.87 0.08 | 6.95 | 6.91 0.07 | 7.02 |
| Li | 8.27 0.18 | 8.49 | 8.23 0.19 | 8.34 | 8.59 0.17 | 8.70 |
| Be | 6.66 0.08 | 6.88 | 6.62 0.05 | 6.68 | 6.80 0.03 | 6.93 |
| B | No data | No data | No data | No data | 7.89 0.15 | 7.98 |
| Be | No data | No data | No data | No data | 9.30 0.26 | 9.40 |
| B | No data | No data | No data | No data | 8.82 0.12 | 8.93 |
| B | 10.30 0.14 | 10.51 | 9.99 0.18 | 10.11 | 10.24 0.06 | 10.37 |
| B | 11.26 0.16 | 11.48 | 10.95 0.16 | 11.03 | 11.45 0.07 | 11.58 |
| C | 10.51 0.51 | 10.71 | No data | No data | 11.45 0.12 | 11.57 |
| N | No data | No data | No data | No data | 13.59 0.14 | 13.72 |
3 Results and discussions
We note that it is tempting to average the recalibrated early measurements for each hypernucleus to obtain a more precise best value. However, as we explained above, without a better understanding of the systematic uncertainty associated with emulsion measurements, it is not appropriate to perform a weighted average. From Table 3, it is evident that the recalibrated values are systematically larger than the original estimates except in the case of He. Comparing with the original H = MeV which was published in 1973 and widely used in modern theoretical studies, the recalibrated = MeV is closer to the latest result, namely = MeV published by the STAR collaboration in 2019[24, 25]. The latest precise measurement of H by A1 collaboration in 2016 is 2.157 0.005 (stat.) 0.077 (syst.) MeV[43], which is also closer to our recalibrated values compared with the original values presented in 1973. In addition, in contrast to the original emulsion measurements, our recalibrated values for He and Li are also closer to the latest measurement He) = MeV by the HKS collaboration[44] in 2016 and Li) = MeV[45, 46] by the FINUDA collaboration in 2009 than original values of emulsion experiments. These numbers corroborate the expectation that all the recalibrated values presented in this paper are indeed better estimates than the early measurements in the light hypernuclei region. In recent years, collaborations at Jefferson Lab and the DANE-FINUDA collaboration measured with good accuracy for heavier hypernuclei, namely Li) = MeV[47], Be) = MeV[45, 46], Be) = MeV[48], B) = MeV[45], B) = MeV[49], C) = MeV[50], and N) = MeV[45]. Comparing these measurements with early emulsion measurements, some recent results indicate larger . However, some of them show smaller .
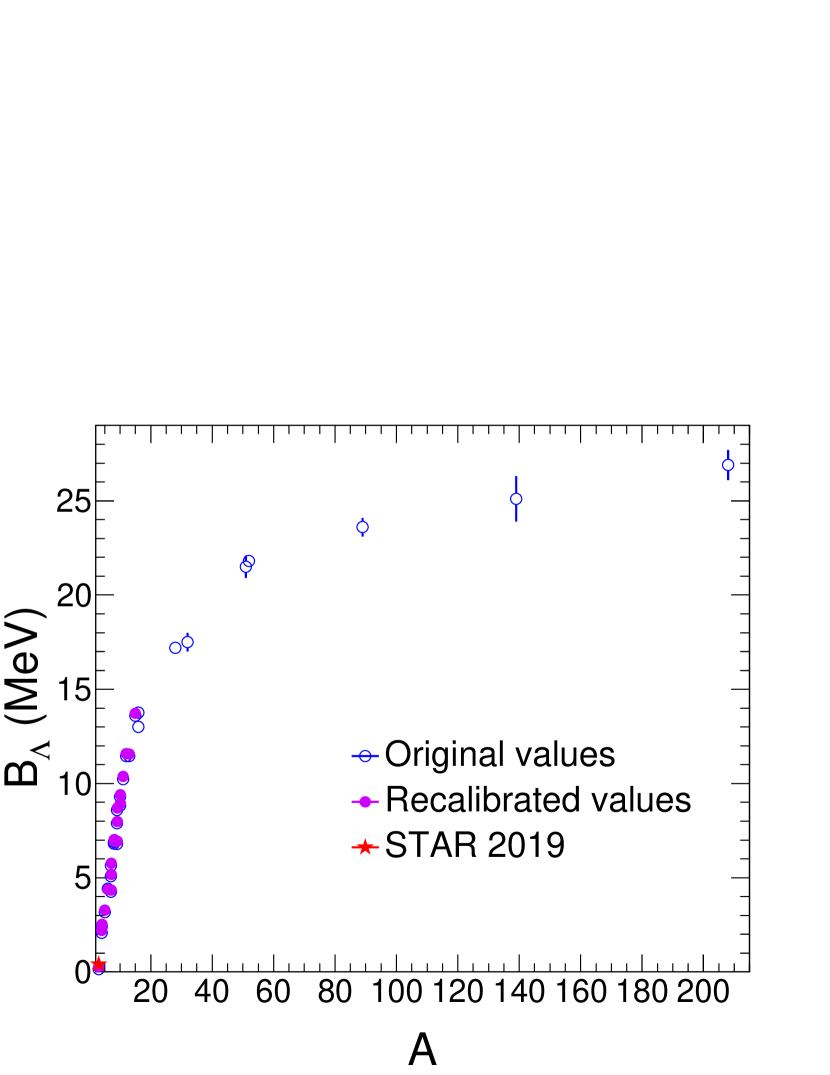
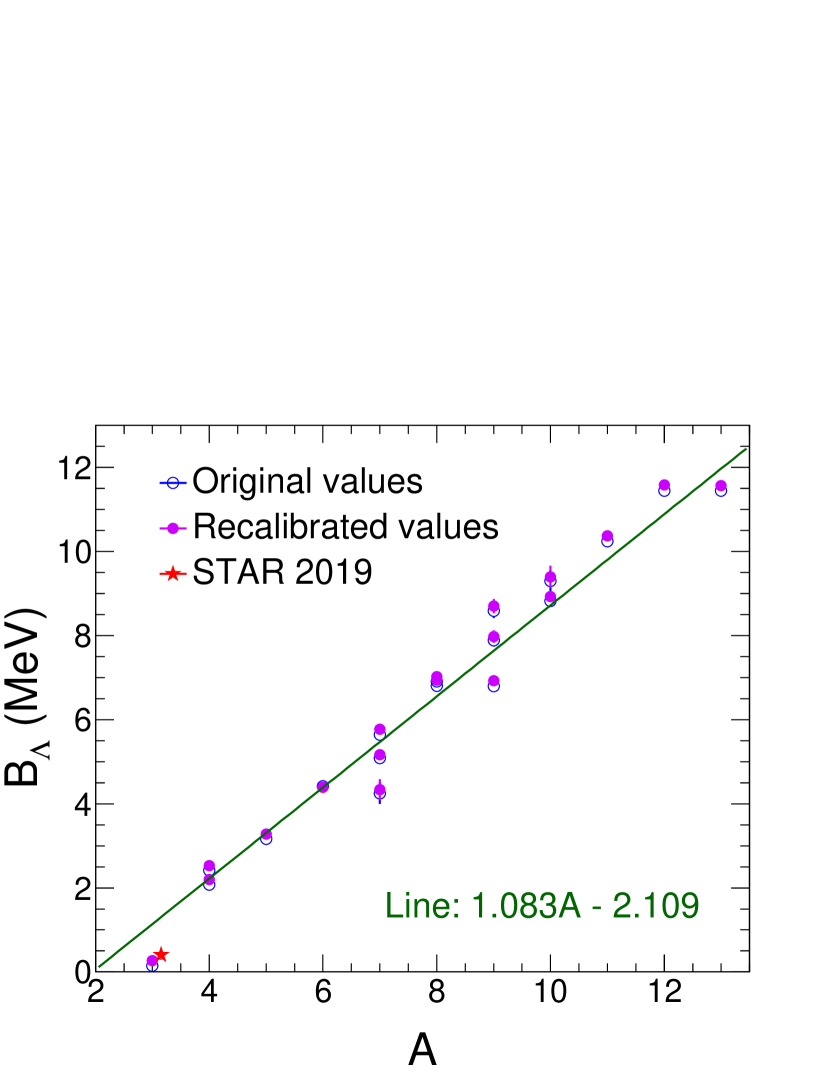
The recalibrated separation energy of hypernuclei in 1973 (except for He, whose value dates from 1968) along with values[9] for hypernuclei with mass number are collected in Figs. 1, 2, and 3. Figure 1 shows as a function of hypernuclear mass number . From Fig. 1, it is evident that dramatically increases with mass number up to about . As becomes larger, increases more slowly and indicates a trend towards saturation in the limit of very large . As shown in the right panel of Fig. 1, a straight line provides a good fit to the recalibrated in the region of light hypernuclei, i.e., .
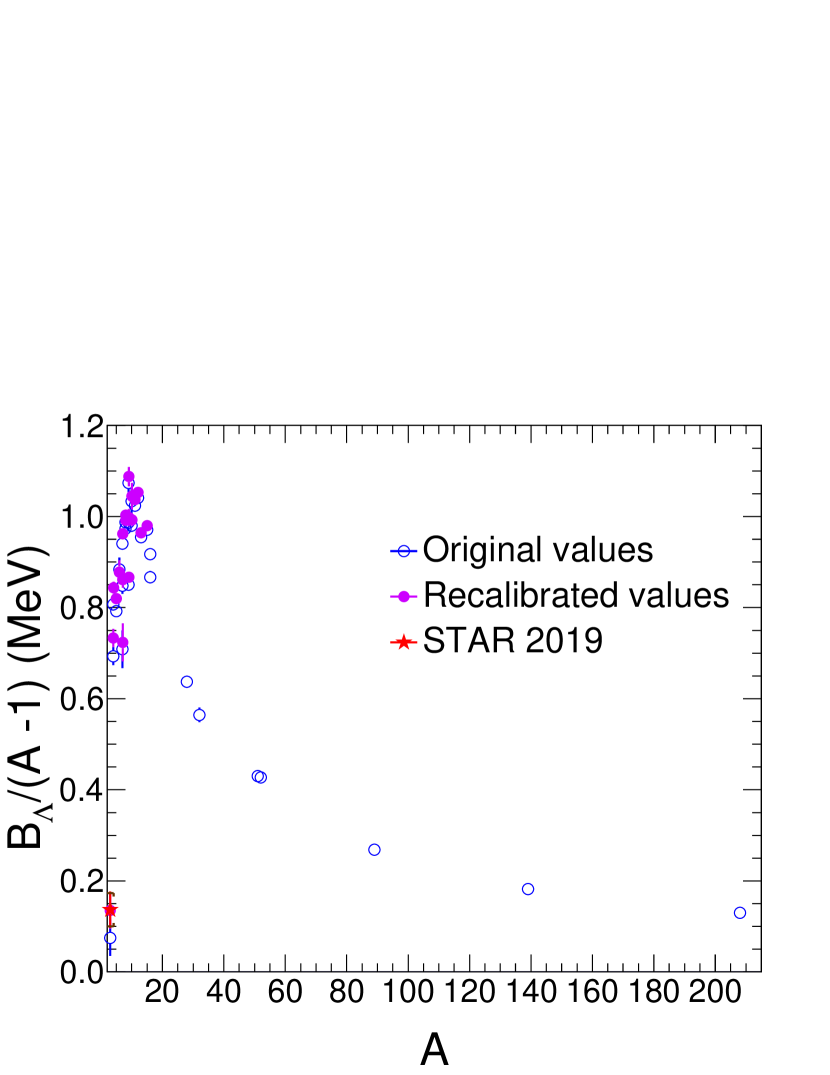
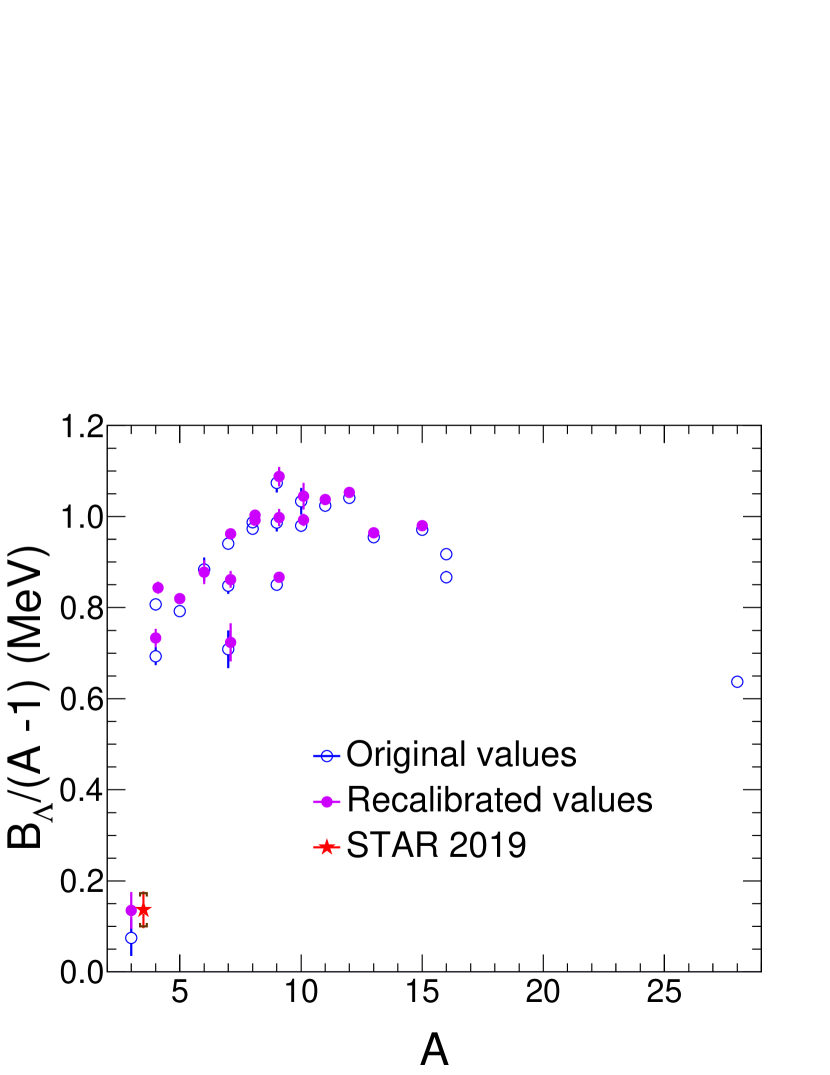
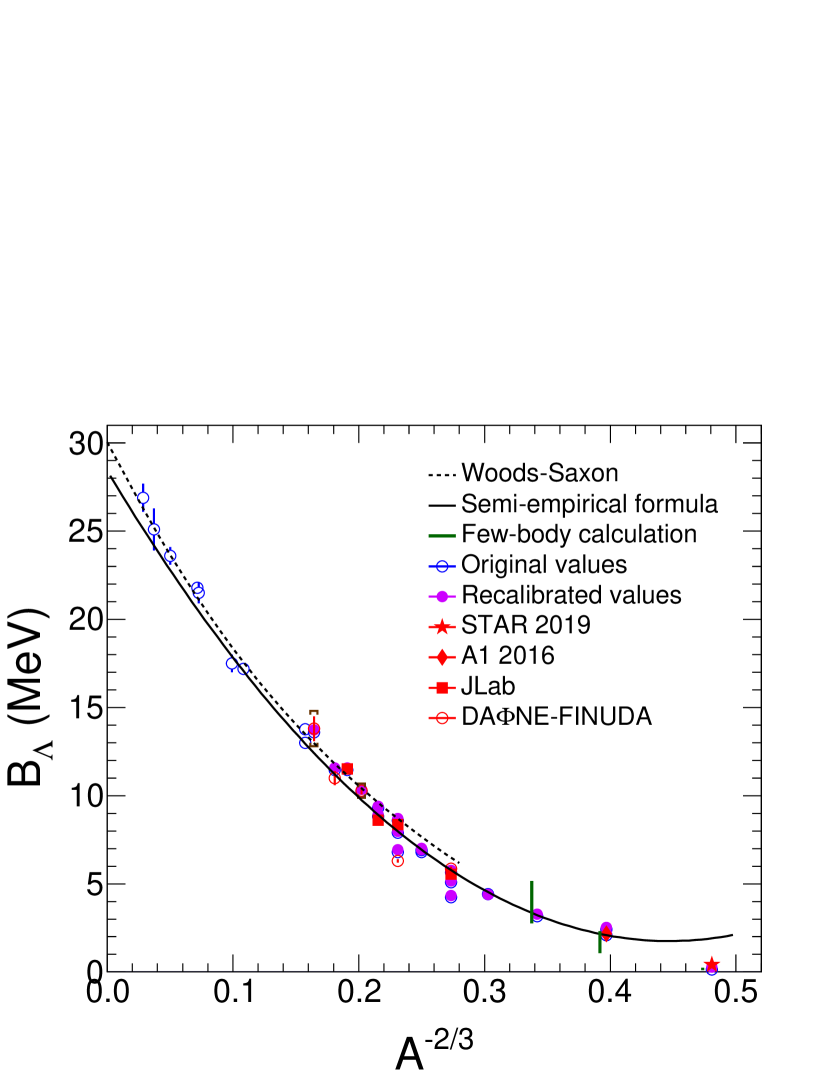
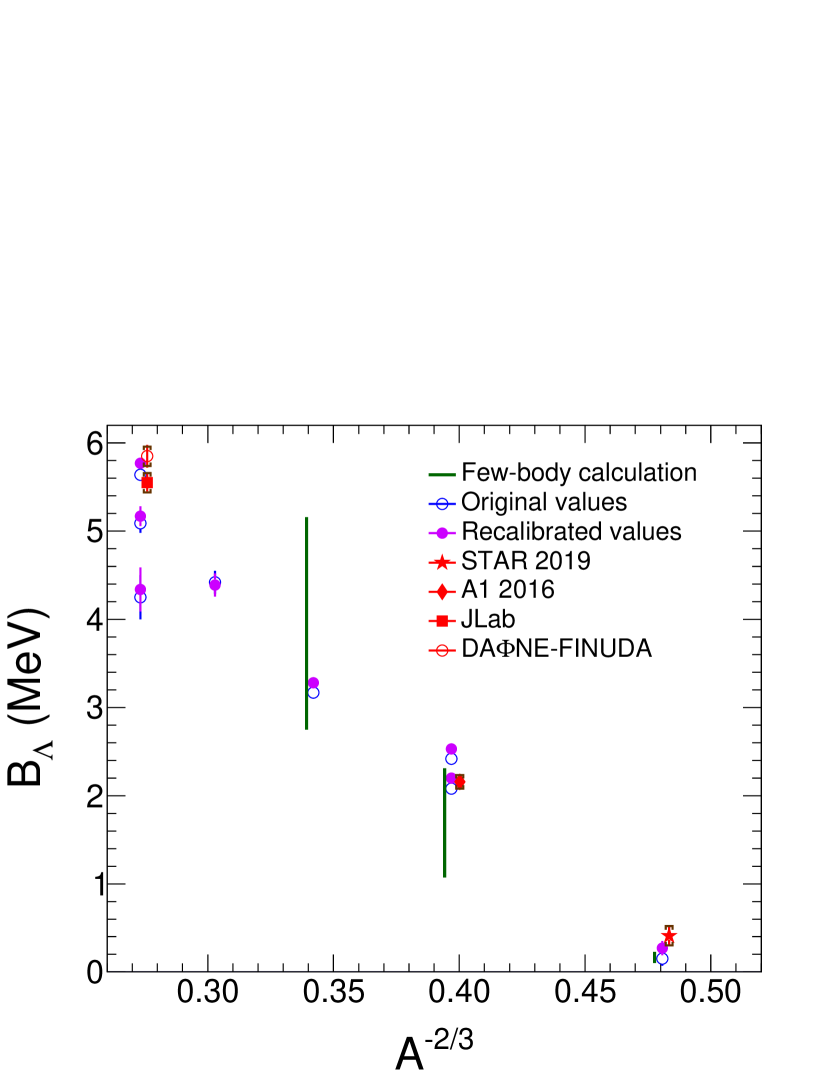
Figure 2 investigates the strength of the interaction between a nucleon in the core of a hypernucleus and the bound . From Fig. 2, it is evident that the strength of the interaction between a nucleon and the dramatically increases with and then decreases. At very large , it shows a tendency to flatten out. From the right panel of Fig. 2, it is evident that reaches a maximum between and . Fig. 3 presents versus . The dashed black curve is the solution of the Schrödinger equation with the standard Woods-Saxon potential[9], which describes the medium and heavy mass range. A semi-empirical formula based on Fermi gas model is also employed to find the of light, medium, and heavy hypernuclei[51] as shown in Fig. 3. Although this semi-empirical formula has a good performance at mid-mass range, it is not good at fitting the experiment data in light and heavy mass range. On the other hand, both Woods-Saxon potential and semi-empirical formula does not take into account the CSB effect. The right panel of Fig. 3 zooms-in on the region , where theoretical calculations span a wide range as shown in the right panel of Fig. 3 and consequently our recalibration becomes more important.
The recalibrated values are systematically larger (except in the case of He) than original values by about 100 keV which is mainly from the contribution of hyperon mass difference between the modern values and the early emulsion values. This effect of about 100 keV is more significant for light hypernuclei, especially for the H, since its is very small compared with heavy hypernuclei. These larger of light hypernuclei obtained through recalibrating the emulsion data and recent experimental measurements will help us understand the puzzle of shortened lifetime of H[52]. The latest compilation of measurements yields a H lifetime shorter than the free lifetime [13, 53]. A calculation in which the closure approximation was introduced to evaluate the wave functions by solving the three-body Faddeev equations, indicates that the H lifetime is smaller than that of the [54]. The shorter lifetime is consistent with a larger separation energy in H. The significant change in of H will also improve the understanding of other hypernuclei[55]. We also learn from Table 3 that for hypernuclei with the same mass number but different electric charge are significantly different, i.e., the Charge Symmetry Breaking[45] (CSB) effect. Theoretical studies are particularly needed to address the CSB effect.
| H (t) | He (4He) | He (5He) | He (6He) | He (7He) | Li (7Li) | Be (7Be) | |
| 0.27 0.08 | 2.53 0.04 | 3.28 0.02 | 4.39 0.13 | 4.34 0.25 | 5.77 0.04 | 5.17 0.11 | |
| 6.26 | 20.58 | -0.74 0.02 | 1.71 0.02 | -0.41 0.01 | 7.25 | 10.68 | |
| No data | 19.81 | 20.68 0.10 | 22.59 0.09 | 23.09 0.25 | 9.97 | 5.61 | |
| Li (8Li) | Be (8Be) | Li (9Li) | Be (9Be) | B (9B) | Be (10Be) | B (10B) | |
| 6.94 0.03 | 7.02 0.07 | 8.70 0.17 | 6.93 0.03 | 7.98 0.15 | 9.40 0.26 | 8.93 0.12 | |
| 2.03 | 18.90 | 4.06 | 1.66 | 18.58 | 6.81 | 8.44 | |
| 12.42 | 17.25 | 13.94 | 16.89 | -0.19 | 19.64 | 6.59 | |
| B (11B) | B (12B) | C (13C) | N (15N) | N (16N) | O (16O) | Si (28Si) | |
| 10.37 0.06 | 11.58 0.07 | 11.57 0.12 | 13.72 0.14 | 13.76 0.16 | 13.0 0.2 | 17.2 0.2 | |
| 11.45 | 3.37 | 4.95 | 10.83 | 2.49 | 15.66 | 17.18 | |
| 11.23 | 14.10 | 17.53 | 10.21 | 11.48 | 12.13 | 11.58 | |
| S (32S) | V (51V) | V (52V) | Y (89Y) | La (139La) | Pb (208Pb) | ||
| 17.5 0.5 | 21.5 0.6 | 21.8 0.3 | 23.6 0.5 | 25.1 1.2 | 26.9 0.8 | ||
| 15.04 | 11.05 | 7.31 | 11.48 | 8.78 | 7.37 | ||
| 8.86 | 8.06 | 9.00 | 7.08 | 6.25 | 8.00 |
We also investigate the difference between of hypernuclei and the corresponding binding energy of the last neutron and proton ( and ) of ordinary nuclei, as shown in Table 4. The increases with , but and feature a significantly different behavior. This difference means that a hyperon plays a role that is different from that of a nucleon in a nucleus. On the other hand, this difference may be related to the rich structure of the nuclear core. For example, the Gaussian expansion method provides an accurate structure calculation of light hypernuclei by treating them as three and/or four clusters[57].
4 Summary
In summary, early measurements of separation energy for hypernuclei published in 1967, 1968, and 1973 are recalibrated with the current most accurate mass values for particles and nuclei. The recalibrated are systematically larger (except in the case of He) than the original published values by about 100 keV. The effect of this level of recalibration is most significant for light hypernuclei, especially for the hypertriton. Our recalibrated place new constraints on theoretical studies of the strong force, of the structure of hypernuclei, and of neutron star interiors. Although this paper provides better estimates by recalibrating early measurements using the modern masses of particles and nuclei, the latter may also suffer from significant systematic uncertainties, such as from the energy-range relation in emulsion and emulsion density[28, 38, 45, 58]. To further improve constraints on theoretical research, more precise measurements of fundamental properties of hypernuclei, like mass and binding energy, are highly desirable. More precise measurements can be expected in the near future, as a result of the on-going phase-II of the Beam Energy Scan program at RHIC, the high resolution spectroscopic experiments at Jefferson Lab[59] in the US, and experiments at the Mainz Microton (MAMI) in Germany, while further progress will be made possible by measurements at the High Intensity Accelerator Facility (HIAF) under construction in China[60], at the Facility for Antiproton and Ion Research (FAIR) under construction in Germany, at the Japan Proton Accelerator Research Complex (J-PARC), and at the Nuclear Spectroscopic Telescope Array (NuSTAR) in the US.
5 Acknowledgements
We thank Prof. John Millener for insightful discussions and for sharing with us the private communication with Prof. Don Davis and the Woods-Saxon potential data.
References
- [1] M. Danysz and J. Pniewski, The London, Edinburgh, and Dublin Philosophical Magazine and Journal of Science, 44: 348-350 (1953)
- [2] R. Levi-Setti, W. E. Slater, and V. L. Telegdi, Il Nuovo Cimento Series 10, 10: 68-90 (1958)
- [3] E. M. Silverstein, Il Nuovo Cimento Series 10, 10: 41-67 (1958)
- [4] B. I. Abelev et al (STAR Collaboration), Science, 328: 58-62 (2010)
- [5] J. Adam et al (ALICE Collaboration), Phys. Lett. B, 754: 360-372 (2016)
- [6] E. Botta, T. Bressani, and G. Garbarino, Eur. Phys. J. A, 48: 41 (2012)
- [7] H. Müller and J. R. Shepard, J. Phys. G: Nucl. Part. Phys., 26: 1049-1064 (2000)
- [8] D. Chatterjee and I. Vidaña, Eur. Phys. J. A, 52: 29 (2016)
- [9] A. Gal, E. V. Hungerford, and D. J. Millener, Rev. Mod. Phys., 88: 035004 (2016)
- [10] D. Lonardoni, A. Lovato, S. Gandolfi et al, Phys. Rev. Lett., 114: 092301 (2015)
- [11] L. Contessi, N. Barnea, and A. Gal, Phys. Rev. Lett., 121: 102502 (2018)
- [12] S. R. Beane, E. Chang, S. D. Cohen et al, Phys. Rev. D, 87: 034506 (2013)
- [13] L. Adamczyk et al (STAR Collaboration), Phys. Rev. C, 97: 054909 (2018)
- [14] J. M. Lattimer and M. Prakash, Science, 304: 536-542 (2004)
- [15] M. Fortin, S. S. Avancini, C. Providência et al, Phys. Rev. C, 95: 065803 (2017)
- [16] Jinhui Chen, Declan Keane, Yu-Gang Ma et al, Phys. Rep., 760: 1-39 (2018)
- [17] C. Mayeur, J. Sacton, P. Vilain et al, Il Nuovo Cimento A (1971-1996), 43: 180-192 (1966)
- [18] W. Gajewski, C. Mayeur, J. Sacton et al, Nucl. Phys. B, 1: 105-113 (1967)
- [19] G. Bohm, J. Klabuhn, U. Krecker et al, Nucl. Phys. B, 4: 511-526 (1968)
- [20] M. Juric, G. Bohm, J. Klabuhn et al, Nucl. Phys. B, 52: 1-30 (1973)
- [21] M. Tanabashi et al (Particle Data Group), Phys. Rev. D, 98: 030001 (2018)
- [22] W. J. Huang, G. Audi, M. Wang et al, Chin. Phys. C, 41: 030002 (2017)
- [23] M. Wang, G. Audi, F. G. Kondev et al, Chin. Phys. C, 41: 030003 (2017)
- [24] J. Adam et al (STAR Collaboration), arXiv: 1904.10520
- [25] Peng Liu (for the STAR Collaboration), Nucl. Phys. A, 982: 811-814 (2019)
- [26] D. Lonardoni, F. Pederiva, and S. Gandolfi, Phys. Rev. C, 89: 014314 (2014)
- [27] D. Lonardoni and F. Pederiva, arXiv: 1711.07521
- [28] G. Bohm, U. Krecker, C. Mayeur et al, Nuovo Cimento A (1965-1970), 70: 384-390 (1970)
- [29] A. H. Wapstra, Physica, 21: 367-384 (1954)
- [30] F. Everling, L. A. König, J. H. E. Mattauch et al, Nucl. Phys., 15: 342-355 (1960)
- [31] F. Everling, L. A. König, J. H. E. Mattauch et al, Nucl. Phys., 18: 529-569 (1960)
- [32] L. A. König, J. H. E. Mattauch, and A. H. Wapstra, Nucl. Phys., 31: 18-42 (1962)
- [33] J. H. E. Mattauch, W. Thiele, and A. H. Wapstra, Nucl. Phys., 67: 1-31 (1965)
- [34] A. H. Wapstra and N. B. Gove, At. Data Nucl. Data Tables, 9: 267-301 (1971)
- [35] A. H. Wapstra and K. Bos, At. Data Nucl. Data Tables, 19: 177-214 (1977)
- [36] D. H. Davis, Contemp. Phys., 27: 91-116 (1986)
- [37] D. H. Davis, Nucl. Phys. A, 547: 369c-378c (1992)
- [38] D. H. Davis, Nucl. Phys. A, 754: 3-13 (2005)
- [39] P. Achenbach, S. Bleser, J. Pochodzalla et al, PoS, Hadron2017: 207 (2018)
- [40] C. Mayeur, J. Sacton, P. Vilain et al, Il Nuovo Cimento A, 43: 180-192 (1966)
- [41] A. H. Rosenfeld, A. Barbaro-Galtieri, W. J. Podolsky et al, Rev. Mod. Phys., 39: 1-51 (1967)
- [42] N. Barash-Schmidt et al (Particle Data Group), http://pdg.lbl.gov/rpp-archive/files/cm-p00040028.pdf, retrieved 5th August 2019
- [43] F. Schulz et al (A1 Collaboration), Nucl. Phys. A, 954: 149-160 (2016)
- [44] T. Gogami et al (HKS (JLab E05-115) Collaboration), Phys. Rev. C, 94: 021302(R) (2016)
- [45] E. Botta, T. Bressani, and A. Feliciello, Nucl. Phys. A, 960: 165-179 (2017)
- [46] M. Agnello et al (FINUDA Collaboration), Phys. Lett. B, 681: 139-146 (2009)
- [47] G. M. Urciuoli et al (Jefferson Lab Hall A Collaboration), Phys. Rev. C, 91: 034308 (2015)
- [48] T. Gogami et al (HKS (JLab E05-115) Collaboration), Phys. Rev. C, 93: 034314 (2016)
- [49] L. Tang et al (HKS (JLab E05-115 and E01-011) Collaborations), Phys. Rev. C, 90: 034320 (2014)
- [50] M. Agnello et al, Phys. Lett. B, 698: 219-225 (2011)
- [51] K. P. Santhosh and C. Nithya, Eur. Phys. J. Plus, 133: 343 (2018)
- [52] J.-M. Richard, Q. Wang, and Q. Zhao, arXiv: 1604.04208v1
- [53] S. Acharya et al (ALICE Collaboration), arXiv:1907.06906
- [54] A. Gal and H. Garcilazo, Phys. Lett. B, 791: 48-53 (2019)
- [55] L. Contessi, N. Barnea, and A. Gal, Phys. Rev. Lett., 121: 102502 (2018)
- [56] Nuclear Data Services of International Atomic Energy Agency (IAEA), https://www-nds.iaea.org/, retrieved 5th August 2019
- [57] E. Hiyama and T. Yamada, Prog. Part. Nucl. Phys., 63: 339-395 (2009)
- [58] Private communication with Prof. D. J. Millener and Prof. D. H. Davis.
- [59] S. N Nakamura, T. Gogami, and L. Tang (for the JLab hypernuclear Collaboration), JPS Conf. Proc., 17: 011002 (2017)
- [60] Peng Liu, Jin-Hui Chen, Yu-Gang Ma et al, Nucl. Sci. Tech., 28: 55 (2017)