Study of the ferromagnetic quantum phase transition in Ce3-xMgxCo9
Abstract
The Ce3-xMgxCo9 system evolves from a Pauli paramagnetic ground state for to a ferromagnetic ground state for in single phase, polycrystalline samples [Phys. Rev. Applied 9, 024023 (2018)]. In order to better understand this behavior, single crystalline samples of Ce3-xMgxCo9 for x = 0.01, 0.16, 0.24, 0.35, 0.43 and 0.50 were grown using the flux growth technique, and electrical transport and magnetic properties were studied. The TC-x phase diagram we infer shows that the system has a quantum phase transition near x = 0.35, transforming to a ferromagnetic ground state.
Tej N. Lamichhane1,2, Valentin Taufour1,3, Andriy Palasyuk1,2, Sergey L. Bud’ko1,2 and Paul C. Canfield1,2
1: Ames Laboratory, U.S. DOE, Ames, Iowa 50011, USA
2:Department of Physics and Astronomy, Iowa State University, Ames, Iowa 50011, USA
3: Department of Physics, University of California Davis, Davis, California 95616, USA
Keywords: Pauli maramagnet, quantum phase transition, Ferromagnet
1 Introduction
Fragile magnetic systems [1] tuned via chemical substitution can lead to quantum criticality, or more generally, a quantum phase transition at 0 K. Here we investigate a Pauli paramagnetic to ferromagnetic quantum phase transition in Ce3-xMgxCo9 [2, 3].
Despite being 75 % atomic Co, pure CeCo3 has a Pauli paramagnetic, low temperature ground state. In polycrystalline Ce3-xMgxCo9, transformation of a Pauli paramagnetic CeCo3 into a ferromagnetic phase was studied in our earlier work [2]. For single phase samples, ferromagnetism was observed for . In mixed phase samples, signs of magnetic order could be found for but in such samples, magnetism could be influenced by several factors such as defects [4], stress [5], impurities [6] etc. To elucidate the phase transformation in a much cleaner way, study of magnetism using single phase, single crystalline samples is always a better idea. We investigated the magnetic properties, electrical transport and specific heat capacity of selected compositions around x0.35 of single crystalline Ce3-xMgxCo9 samples.
We find a quantum phase transition as Ce3-xMgxCo9 changes from a Pauli paramagnetic state for 0 to a ferromagnetic state for . No additional magnetic phases were found in the vicinity of the quantum phase transition composition.
2 Experimental details
Single crystalline Ce3-xMgxCo9 samples for were synthesized in 3-cap Ta crucibles [7] similar to the previous report [2] by maintaining the CeMg to Co ratio as 30:70 i.e. (Ce1-xMgx)30Co70 with nominal x = 0.05, 0.10, 0.15, 0.20, 0.25 and 0.30 as listed in Table 1.
|
Loaded nominal
composition |
EDS composition | Rietveld refined composition |
|---|---|---|
| Ce30Co70 | — | CeCo3 |
| Ce28.5Mg1.5Co70 | Ce2.99Mg0.01(0.01)Co9 | Ce2.95Mg0.05Co9 |
| Ce27Mg3Co70 | Ce2.84Mg0.16(0.02)Co9 | Ce2.87Mg0.13Co9 |
| Ce25.5Mg4.5Co70 | Ce2.76Mg0.24(0.02)Co9 | Ce2.75Mg0.25Co9 |
| Ce24Mg6Co70 | Ce2.65Mg0.35(0.015)Co9 | Ce2.68Mg0.32Co9 |
| Ce22.5Mg7.5Co70 | Ce2.57Mg0.43(0.015)Co9 | Ce2.57Mg0.43Co9 |
| Ce21Mg9Co70 | Ce2.50Mg0.50(0.02)Co9 | Ce2.49Mg0.51Co9 |

The selected amount of Ce-Co-Mg elements were sealed under almost one atmospheric pressure of Ar at room temperature inside a 3-cap Ta crucible. The Ta crucibles were protected under a partial pressure of Ar inside an amorphous silica jacket with quartz wool buffers on the top and the bottom of the crucible to protect silica ampoule from the consequences of differential thermal expansion during temperature ramping and mechanical shock during the decanting process. The silica ampoule was heated to 900 ∘C over 3 h and held there for 3 h to allow the initial reaction of elements and potentially avoid the excessive boiling of Mg at higher temperature. Then the growth was heated to 1200 ∘C over 3 h and held there for 10 h to form a homogeneous liquid. Finally, the growth was slowly cooled down to 1040 ∘C over 100 h for nominal Mg content x = 0.05 - 0.15 and centrifuged to separate the crystals from the flux. Similarly, growths with x = 0.20 - 0.30 were cooled down to 1070 ∘C over 100 h and crystals were separated. The single crystalline samples had rhombohedral plate-like morphology with several millimeters in length and width and approximately 1 - 2 mm in thickness. The easy axis of magnetization is perpendicular to the plate ([001] direction) [2].
Crystals from all the batches were characterized using powder X-ray diffraction (XRD) and Scanning Electron Microscopy (SEM). For XRD, a finely ground powder was spread over the zero background silicon wafer and held in place with a thin film of Dow Corning high vacuum grease. Powder XRD data were collected using Rigaku Miniflex II diffractometer within 2 range of 5 - 100∘ using a step size of 0.01 degree and a dwell time of 3 seconds. For SEM, single crystalline samples were mounted in epoxy and finely polished perpendicular to the plane of the plate to determine the composition. The nominal composition, average Energy Dispersive Spectroscopy (EDS) composition, and Rietveld refined composition are presented in Table I. For nominal Mg x = 0.05, 0.10 and 0.15 samples, traces of CeCo2 impurities were visible in the cross sectional view of SEM images (not shown here). The EDS and Rietveld refined composition more or less agree each other except for nominal 5% Mg doped sample. Hereafter, all the compositions are EDS inferred in this paper.
Magnetic properties were measured in a Quantum Design (QD) Magnetic Property Measurement System (MPMS) in between 2 K and 300 K. A QD VersaLab Vibrating Sample Magnetometer (VSM) was used to measure the magnetic properties between 50 K and 400 K. All the magnetization data were measured with magnetic field parallel to [001] direction. The internal magnetization field () was determined as to determine the Curie temperature using Arrott plots [8]. Here, N is the demagnetization factor related to sample geometry and M is the magnetization. The details of the demagnetization factors determination can be found elsewhere [9, 10, 11]. Electrical transport property was measured using the four probe method with a Linear research Inc. meter bridge LR 700 (1mA; 17 Hz excitation). Thin platinum wires were attached to the resistance bar using DuPont 4929N silver paint to make electrical contacts. A MPMS was used as a temperature controller for the electrical transport measurements. The specific heat capacity was measured in a QD physical property measurement system using the relaxation technique.
3 Results and discussion
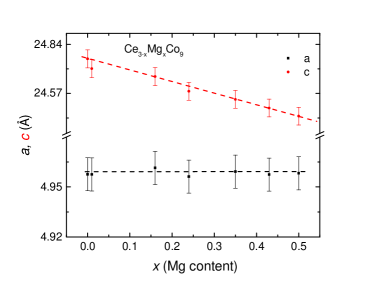
Ce3-xMgxCo9 forms in the rhombohedral structure for all x examined. Fig. 1 shows the variation of the lattice parameters a and c with Mg content. The c lattice parameter decreases monotonically whereas the a lattice parameter is more or less constant up to .
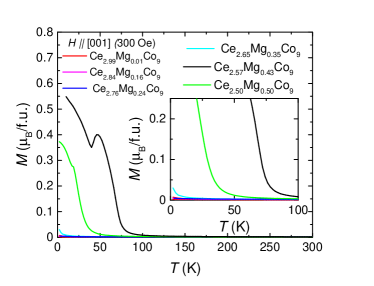
Figure 2 shows the zero field cooled (ZFC) temperature dependent magnetization M(T) for . Although CeCo3 was identified as a Pauli paramagnetic compound long ago [12], there has been some room for question because of the presence of a low temperature upturn in temperature dependent magnetization [2]. Moreover recent density functional calculation showed CeCo3 could order ferromagnetically at low temperature [3]. With of Mg addition, the low temperature magnetization remains temperature independent and manifests Pauli paramagnetism as shown in the inset of Fig. 2. These temperature independent magnetization data for x = 0.01, 0.16, and 0.24 confirm that for these x-values, Ce3-xMgxCo9 is Pauli paramagnetic system. Since x = 0.01 sample is Pauli paramagnetic down to 2 K, this suggests that pure CeCo3 may also be a Pauli paramagnetic. The low temperature upturn [2] is most likely associated with magnetism of impurity ions or traces of extrinsic magnetic impurity.
As we increase the value of x, a low temperature upturn starts to become visible for x = 0.35 suggesting it may be close to a critical concentration for achieving the quantum phase transition. For x = 0.43 and 0.50, the upturns in M(T) data upon cooling develop large enough magnetization to suggest that they are ferromagnetic samples. The kink only visible on the ZFC M(T) data for x = 0.43 and 0.50 could be related to reorientation of ferromagnetic domains near the transition temperature.
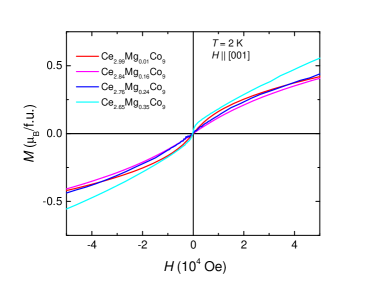
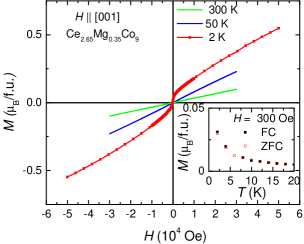
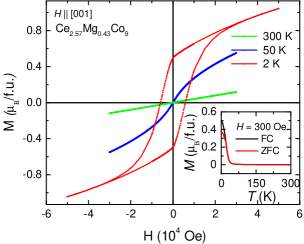
To better understand the evolution of ferromagnetism with Mg content x, a detailed analysis of easy axis M(H) data was performed for all samples. Figure 3 shows the 2 K M(H) data for the non-ferromagnetic samples with EDS inferred Mg concentrations x = 0.01, 0.16, 0.24 and 0.35. In Fig. 4, for the Ce2.65Mg0.35Co9 sample, we can see an increasing low-field induced magnetization upon cooling indicating that it may be getting close to a ferromagnetic transition. The lower right inset in Fig. 4 shows ZFC and field cooled (FC) M(T) data at 300 Oe applied field. This reversible nature of the M(T) data argues against ferromagnetic transition for K.
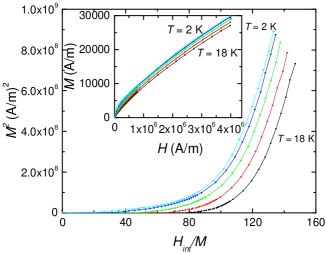
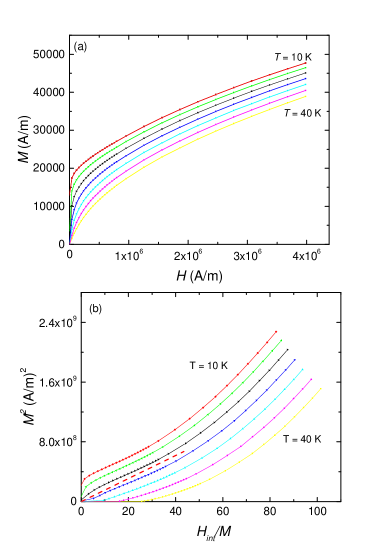
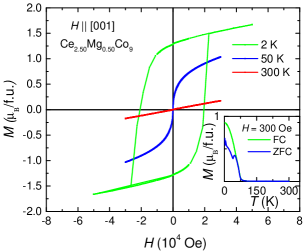
In order to study the x = 0.35, 0.43 and 0.50 samples in greater detail, M(H) loops were performed as shown in Figs. 4, 6, and 8 along with the determination of Curie temperature using Arrott plot method as shown in Figs. 5, 7 and 9. Within the framework of Arrott plot analysis, straight Arrott curves through the origin suggest a mean field interaction in the magnetic system and identify the Curie temperature. The Arrott plot of x = 0.35 sample does not manifest straight lines that go through origin (as shown in Fig. 5). This means that the Ce2.65Mg0.35Co9 is non-ferromagnetic down to 2 K despite the slight upturn in M(T) data. On the other hand, the Arrott plot data become straighter for Ce2.57Mg0.43Co9 (Fig. 7(b)) and almost an ideal mean-field-like for Ce2.50Mg0.50Co9 (Fig. 9). From these analyses we can infer 25 K, 70 K for x = 0.43 and 0.50 respectively.
The 2 K M(H) data for x = 0.43 and 0.50 samples do not saturate up to 7 T applied field in these experiments, as shown in Figs. 6 and 8. However, higher magnesium containing samples e.g. x= 1.34 were well saturated with 3 T applied field in our previous work [2]. This could be the evidence that the doping induced magnetism is more itinerant for lower Mg content and becomes more local moment-like with higher content of Mg.
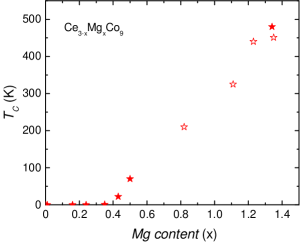
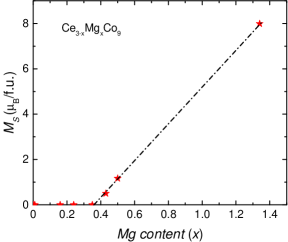
Figures 10 and 11 present the and phase diagrams for the Ce3-xMgxCo9 system. Both figures identify as the critical concentration region for the quantum phase transition from a Pauli paramagnet to ferromagnetic state.
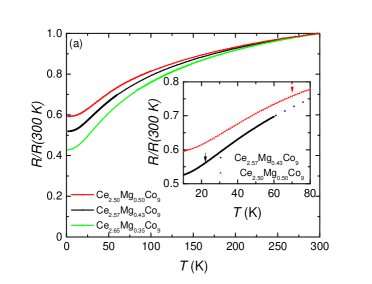
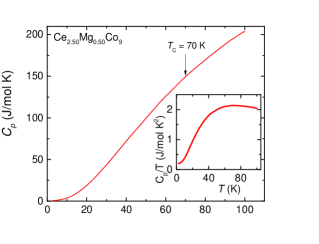
To further analyze the nature of the phase diagram and the quantum phase transition region, electrical transport properties of the samples around the critical composition and specific heat capacity of the ferromagnetic, x = 0.50 sample, were studied. Figure 12 shows the normalized resistance of Ce3-xMgxCo9 single crystalline samples for x = 0.35, 0.43 and 0.50. Figure 13 shows the temperature dependent specific heat data for x= 0.50. Neither resistance nor specific heat data manifest clear signatures of ferromagnetic transitions. In the Stoner model, would give a discontinuity around 2 Jmol-1K-1 at for , but if spin fluctuation exist above then discontinuity will be smaller [13]. For the resistance data the anticipated loss of spin disorder features may be obscured by the clearly large and increasing disorder scattering. Additionally, doping disorder could have broadened the ferromagnetic transition so that transition feature was undetectable in resistance and specific heat measurements. The lack of a clear feature in specific heat for x = 0.50 suggests that there may be relatively little entropy loss associated with the transition. This is consistent with the small spontaneous moment (Fig. 11) as well as with this system being a fragile, itinerant moment, ferromagnet.
4 Conclusions
The temperature dependent magnetic, electrical transport properties and specific heat capacity of the low Mg content doped Ce3-xMgxCo9 samples were studied using flux grown single crystalline samples. From the TC-x phase diagram, the critical concentration for quantum transition between Pauli paramagnetic and ferromagnetic ground states is determined to be .
5 Acknowledgements
Dr. Warren Straszheim is acknowledged for doing SEM on various samples. This research was supported by the Critical Materials Institute, an Energy Innovation Hub funded by the U.S. Department of Energy, Office of Energy Efficiency and Renewable Energy, Advanced Manufacturing Office. This work was performed at the Ames Laboratory, operated for DOE by Iowa State University under Contract No. DE-AC02-07CH11358.
References
- [1] Paul C Canfield and Sergey L Bud’ko. Preserved entropy and fragile magnetism. Reports on Progress in Physics, 79(8):084506, jul 2016.
- [2] Tej N. Lamichhane, Valentin Taufour, Andriy Palasyuk, Qisheng Lin, Sergey L. Bud’ko, and Paul C. Canfield. : Transformation of a Pauli Paramagnet into a Strong Permanent Magnet. Phys. Rev. Applied, 9:024023, Feb 2018.
- [3] Tribhuwan Pandey and David S. Parker. Borderline Magnetism: How Adding to Paramagnetic Makes a 450-K Ferromagnet with Large Magnetic Anisotropy. Phys. Rev. Applied, 10:034038, Sep 2018.
- [4] G. Z. Xing, Y. H. Lu, Y. F. Tian, J. B. Yi, C. C. Lim, Y. F. Li, G. P. Li, D. D. Wang, B. Yao, J. Ding, Y. P. Feng, and T. Wu. Defect-induced magnetism in undoped wide band gap oxides: Zinc vacancies in ZnO as an example. AIP Advances, 1(2):022152, 2011.
- [5] Yusei Shimizu, Bernard Salce, Tristan Combier, Dai Aoki, and Jacques Flouquet. Uniaxial-stress-induced ferromagnetism in the itinerant metamagnetic compound UCoAl probed by magnetostriction measurements. Journal of the Physical Society of Japan, 84(2):023704, 2015.
- [6] Yu-Jun Zhao, S. Picozzi, A. Continenza, W. T. Geng, and A. J. Freeman. Possible impurity-induced ferromagnetism in chalcopyrite semiconductors. Phys. Rev. B, 65:094415, Feb 2002.
- [7] Paul C. Canfield and Ian R. Fisher. High-temperature solution growth of intermetallic single crystals and quasicrystals. J. Cryst. Growth, 225(2–4):155 – 161, 2001.
- [8] Anthony Arrott and John E. Noakes. Approximate equation of state for nickel near its critical temperature. Phys. Rev. Lett., 19:786–789, Oct 1967.
- [9] Amikam Aharoni. Demagnetizing factors for rectangular ferromagnetic prisms. J. Appl. Phys., 83(6):3432–3434, 1998.
- [10] Tej N. Lamichhane, Valentin Taufour, Srinivasa Thimmaiah, David S. Parker, Sergey L. Bud’ko, and Paul C. Canfield. A study of the physical properties of single crystalline Fe5B2P. J. Magn. Magn. Mater., 401:525 – 531, 2016.
- [11] Tej N. Lamichhane, Valentin Taufour, Morgan W. Masters, David S. Parker, Udhara S. Kaluarachchi, Srinivasa Thimmaiah, Sergey L. Bud’ko, and Paul C. Canfield. Discovery of ferromagnetism with large magnetic anisotropy in ZrMnP and HfMnP. Appl. Phys. Lett., 109(9):092402, 2016.
- [12] K.H.J. Buschow. Magnetic properties of CeCo3, Ce2Co7 and CeNi3 and their ternary hydrides. Journal of the Less Common Metals, 72(2):257 – 263, 1980.
- [13] P. Mohn and G. Hilscher. Influence of spin fluctuations on the specific heat and entropy of weakly itinerant ferromagnets. Phys. Rev. B, 40:9126–9134, Nov 1989.