Variability Study of Extreme Blazars with VERITAS
Abstract:
The VERITAS array of imaging atmospheric Cherenkov telescopes has collected nearly 6000 hours of observations of active galactic nuclei (AGNs). It has detected 39 very-high-energy (VHE, ¿100 GeV ) AGNs at redshifts up to , of which 24 are classified as high-frequency-peaked BL Lacertae objects (HBLs). VERITAS has obtained an extensive dataset of HBL, including extreme HBL (xHBL), observations, with lightcurves spanning up to 11 years, allowing the characterization of their long-term and short-term variability. A study of various xHBLs/HBLs in the VERITAS dataset is presented, and the correlation with other energy bands tested. In particular, the short-term variability of xHBLs as a function of energy within the VHE band is examined, exploring the possibility that secondary gamma rays are produced in cosmic-ray interactions with background photons.
afterfloat \DeclareFloatVCodebeforefloat
1 introduction
The blazar population, a class of active galactic nuclei (AGNs), dominates the extragalactic gamma-ray sky. Of those, the most common are BL Lac type blazars [1]. Their spectral energy distribution (SED) typically features two main broad peaks; a low energy one commonly explained as synchrotron emission by highly relativistic electrons in the jet, and a higher energy one typically attributed to inverse-Compton emission of the same electrons off seed photons. The seed photons can be synchrotron photons themselves (synchrotron self-Compton, SSC) [2] or those originating from outside the jet (e.g., from the accretion disk) [3]. BL Lac type blazars are further classified according to the frequency of their synchrotron peak () into high-frequency-peaked (HBLs, ), intermediate-frequency-peaked (IBL, ) and low-frequency-peaked BL Lac objects (LBLs, ) [4]. HBLs currently account for the largest fraction of TeV detected blazars, with 51 HBLs detected so far.333http://tevcat.uchicago.edu/ The majority of the sources studied here belong to a subset of HBLs characterized by synchrotron peak frequencies Hz, and referred to as extreme HBLs (xHBLs) [5]. The observed SEDs of these xHBLs pose challenges to the conventional one-zone SSC model, which has been relatively successful in describing less extreme HBL spectra [6]. Several mechanisms within the SSC picture were suggested to model the SEDs of xHBLs and in particular to explain their observed TeV spectra [7]. An alternative solution for the latter was put forth in Ref. [8], proposing that the gamma ray flux from distant blazars is dominated by secondary gamma rays. Those are produced along the line of sight by the interactions of protons originating from the blazar with background photons. Studying the time variability of these xHBLs/HBLs and searching for correlations between different wavelengths and within the very-high-energy band (VHE, GeV ) could help constrain or reject some of these models. For this purpose, the lightcurves of 1ES 0033+595, 1ES 0502+675, 1ES 1011+496, 1ES 1218+304, 1ES 0229+200, RGB J0710+591 and PG 1553+113 are studied. The results for 1ES 1011+496, 1ES 1218+304 and PG 1553+113 are shown in this proceeding.
The Fermi large area telescope (LAT), on board the Fermi gamma-ray space telescope, is sensitive in the energy range 20 MeV to GeV with a field of view of approximately 2.4 sr [9]. Fermi-LAT data are analysed with Fermipy [10], using the P8R2_SOURCE_V6 instrument response function, and the preliminary LAT 8-year Point Source List (FL8Y).
The X-ray Telescope (Swift-XRT) on the Neil Gehrels Swift observatory is sensitive to photons with energies between 0.2 and 10 keV [11]. The X-ray lightcurves used in this analysis are obtained from the online Swift-XRT lightcurve repository [12].
VERITAS [13] is located at the Fred Lawrence Whipple Observatory in southern Arizona (31 40N, 110 57W, 1.3 km a.s.l.). It is sensitive to gamma rays in the energy range, 100 GeV to TeV . It can currently detect an object having 1% Crab Nebula flux within 25 hours. The typical systematic uncertainty on measured flux is 20%. The VERITAS AGN observing strategy consists of regular monitoring of known VHE targets in order to identify flaring episodes [14]. These observations are complemented by coordinated observations at lower energy, in order to obtain long-term contemporaneous multiwavelength datasets for a variety of AGNs. This strategy resulted in an extensive dataset of AGNs, containing lightcurves covering up to 11 years, opening up the possibility to study their long-term and short-term variability and correlations to other wavelengths.
2 Multiwavelength lightcurves
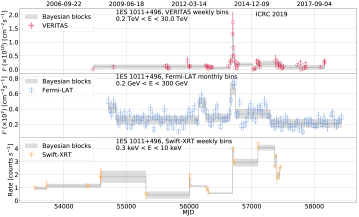
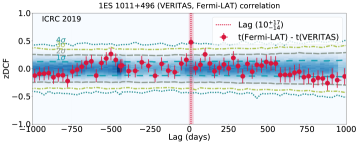
The weekly VERITAS lightcurve, monthly Fermi-LAT lightcurve and weekly Swift-XRT lightcurve of the 1ES 1011+496 blazar from June 2005 to December 2018 are shown in Figure 1. The results of a Bayesian block analysis [15], used to determine any significant () change points in the lightcurves, are shown as well. A flare during February 2014 is clearly visible in the VERITAS and Fermi-LAT lightcurves. Hints of a simultaneous high flux state are seen in the Swift-XRT lightcurve, which seems to extend long after the flare period in VERITAS and Fermi-LAT. In order to estimate the correlation between the VERITAS and Fermi-LAT lightcurves, the -transformed discrete cross-correlation function (DCF) [16] is calculated. The DCF method provides a conservative estimate for the cross-correlation function as a function of lag between sparsely sampled lightcurves. The results of the DCF algorithm are shown in Figure 2, where evidence for correlation between the VERITAS and Fermi-LAT lightcurves is observed with a significance of . The peak time lag is estimated to be days, which is consistent with no lag between VHE and high-energy (HE, GeV ). A positive time lag between band and band , , indicates that the emission in band lags behind band . The significance of DCF values is estimated using the Monte Carlo method. Simulated lightcurves are generated from the power spectral densities (PSD) [17] of each lightcurve, and the DCF is calculated between them. The distribution of 100,000 such pseudo-experiments is shown as the blue histogram in Figure 2. The quantiles of the distribution in each lag value, corresponding to significance levels, are shown as horizontal lines. The most likely lag value and the corresponding uncertainty are obtained through a maximum likelihood function [18]. No correlation is observed between the VERITAS and Swift-XRT lightcurves, probably due to the small amount of Swift-XRT data available, especially during the flare period. The observed correlation between VHE and HE is expected, as the emission in those energy ranges is typically considered to originate from the same particle population.
floatwidth=.6capbesidewidth=sidefil, capposition=beside,capbesideposition=left,center, postcode=afterfloat
captionskip=-10pt
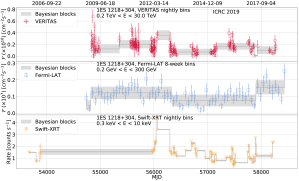
The nightly VERITAS and Swift-XRT lightcurves of 1ES 1218+304, and the corresponding Fermi-LAT lightcurve, divided to 8-week bins, are shown in Figure LABEL:sub@fig:1ES1218_nightly. Variability is observed in all energy bands, with short time-scale variability seen in X-ray; month-scale variability in VHE; and long-term variability in HE. The 2009 VHE flare, where VERITAS observed intra-night variability [19], is seen as well. Figure 4 shows the DCF results between the VERITAS lightcurve and the Fermi-LAT and Swift-XRT ones. No correlation is observed between any of the energy bands, including HE and X-ray (not shown). The lack of correlation between VHE and HE could be due to the sensitivity of Fermi-LAT being insufficient to detect the shorter-term variability observed with VERITAS. In the one-zone SSC model, correlation between X-ray and VHE is expected, but it is not observed. However, the data is not sufficient to rule it out.
captionskip=-10pt
captionskip=-10pt
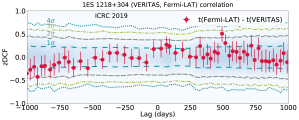
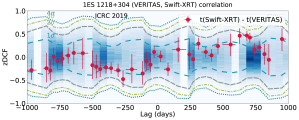
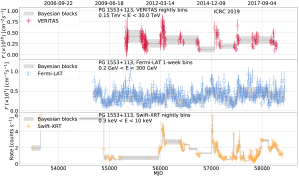
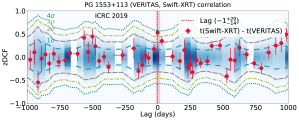
Figure LABEL:sub@fig:PG1553_nightly shows the nightly VERITAS and Swift-XRT lightcurves and the weekly Fermi-LAT lightcurve for the PG 1553+113 blazar. Variability is seen in all energy bands, with X-ray featuring the most rapid changes in flux. This is consistent with previous observations in VHE [20, 21] and studies of HE and X-ray lightcurves [22]. The April 2012 flare [21] is seen in VHE and X-ray, but not in HE. A stronger flare is seen in X-ray in December 2014, while no significant activity is observed in the Fermi-LAT lightcurve. Unfortunately, no simultaneous VERITAS data are available. Simultaneous VERITAS and Swift-XRT observations are available in the months following February 2015 however, where both energy bands feature a slowly decreasing flux. Applying the DCF, no correlation is detected between the VERITAS and Fermi-LAT lightcurves. Evidence for correlation is observed between the VERITAS and Swift-XRT lightcurves at a significance and with a lag of days. This result is consistent with a one-zone SSC model predicting a correlation between the synchrotron and the inverse-Compton emission as they relate to the same electron population. The absence of correlation between VHE and HE was interpreted in Ref. [21] as a hint that the injected high energy particles predominantly emit VHE gamma rays. The HE flux may remain relatively unchanged if the flow of particles is not strong enough for their radiation during the acceleration or cooling phases to have an observable effect.
captionskip=-10pt

3 Secondary gamma rays contribution
The gamma-ray flux from blazars is typically considered to originate from photons emitted at the source. At high energies, these primary gamma rays are attenuated by their interactions with the extragalactic background light (EBL) [23]. To overcome this attenuation, it was suggested that ultra-high-energy protons ( – eV ) produced at the source then proceed to interact with background photons and generate VHE secondary gamma rays along the line of sight [24, 25, 26]. Such models predict that the observed VHE gamma-ray flux from blazars at redshift and energy contains a significant contribution from secondary gamma rays. This contribution is expected to have distinct spectral and temporal features which should be visible in the observed gamma-ray flux. In particular, in the energy range dominated by secondary gamma rays, time variability on time scales shorter than 0.1 year should not be observed [27]. The detection of a contribution from secondary photons can help in setting upper limits on the magnetic fields along the line of sight, as the intergalactic magnetic fields must be G for their contribution to be observable.
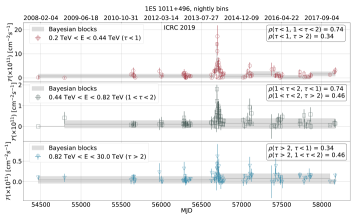
To test the contribution of secondary photons, the VERITAS lightcurves of the sources are divided into energy bins according to their opacity [28]. The EBL energy and redshift evolution in the Franceschini et al. 2008 model, , [29] is used to set the energy ranges of three opacity bins, , and . These correspond to attenuation of the primary photons of , and respectively. The lightcurves of 1ES 1011+496 in these opacity bins are shown in Figure 6. The February 2014 flare is visible and detected by the Bayesian block analysis in all three opacity bins. Correlation between the lightcurves is tested using the DCF method, as shown in Figure 7. A correlation is observed between the lightcurve and the other two lightcurves, indicating a dominant contribution from the flare even for the bin.
floatwidth=.6capbesidewidth=sidefil, capposition=beside,capbesideposition=left,center, postcode=afterfloat
captionskip=-10pt, precode=beforefloat
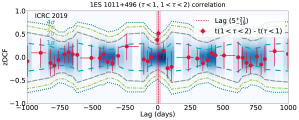
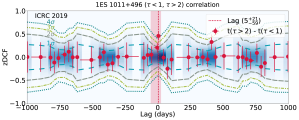
A toy study is performed to assess whether this level of correlation can be observed within the secondary gamma rays hypothesis. The latter predicts that primary photons emitted at the source contribute less than 13% of the observed flux in the bin. The rest of the flux is assumed to come from secondary gamma rays. Following this proposed composition, a simulated lightcurve is constructed to represent the opacity bin, . The first element, , is extracted from data corresponding to the lightcurve, which are predominantly made up of primary photons. The second component, is derived from . As the first step, the flare period is removed from . This is done in order to assure that no fast variability is introduced to the secondary gamma ray contribution. Next, the PSD of the resulting lightcurve is calculated, and used to simulate . Finally, the DCF between the lightcurve is calculated. Correlation at the level is observed. This suggests that a 13% contribution from primary photons during the flare is sufficient to produce the correlation observed between the and 1ES 1011+496 lightcurves. Therefore, based on the observed correlation, the hypothesis of ultra-high-energy protons producing secondary gamma rays along the line of sight cannot be ruled out.
4 Conclusions
The short- and long-term variability of xHBLs/HBLs was studied in the VHE, HE, and X-ray bands. Day-scale variability was observed in VHE during the 1ES 1011+496 flare, while a simultaneous increase in flux was seen in HE. Correlation at the level of and with no significant lag was observed between the two lightcurves, supporting the hypothesis that the same particle population emits gamma rays in those energy ranges. The VHE and X-ray lightcurves of 1ES 1218+304 present short time-scale variability with no apparent correlation between them. Typically, this indicates that two different zones and/or particle populations are responsible for the VHE and X-ray emissions. All three PG 1553+113 lightcurves feature variability, where correlation between VHE and X-ray is seen at level and no correlation is detected between those bands and the HE one. The former is compatible with a SSC scenario in which the VHE and X-ray emission originate from the same zone. The lack of correlation with the HE band joins the reported evidence for quasi-periodic modulation in the HE flux [22] in challenging the one-zone SSC model. This tension prompts the need for more sophisticated models (e.g., Refs. [30] and [31]).
The VHE lightcurves were divided in three energy ranges, corresponding to three opacity bins. A search for correlations between the resulting lightcurves was performed in order to assess the contribution from secondary gamma rays produced along the line of sight from ultra-high-energy protons. The three 1ES 1011+496 lightcurves were found to be correlated at a level, pointing to the existence of a significant contribution from primary gamma rays to all lightcurves. However, it was shown that such correlation could appear even in the case that primary photons contribute only 13% to the lightcurve. The current dataset cannot therefore be used to set constraints on this model. For that purpose, a similar short-term variability and correlation needs to be observed with the bin, in which the primary photons contribution is predicted to be and no correlation is expected.
Acknowledgments
This research is supported by grants from the U.S. Department of Energy Office of Science, the U.S. National Science Foundation and the Smithsonian Institution, and by NSERC in Canada. This research used resources provided by the Open Science Grid, which is supported by the National Science Foundation and the U.S. Department of Energy’s Office of Science, and resources of the National Energy Research Scientific Computing Center (NERSC), a U.S. Department of Energy Office of Science User Facility operated under Contract No. DE-AC02-05CH11231. We acknowledge the excellent work of the technical support staff at the Fred Lawrence Whipple Observatory and at the collaborating institutions in the construction and operation of the instrument. This work made use of data supplied by the UK Swift Science Data Centre at the University of Leicester.
References
- [1] Fermi-LAT collaboration, 1902.10045.
- [2] A. P. Marscher and W. K. Gear, The Astrophysical Journal 298 (1985) .
- [3] C. D. Dermer and R. Schlickeiser, The Astrophysical Journal 416 (1993) .
- [4] P. Padovani and P. Giommi, Astrophys. J. 444 (1995) [astro-ph/9412073].
- [5] G. D. Sentürk et al., Astrophys. J. 764 (2013) 119 [1301.3697].
- [6] G. Ghisellini et al., Mon. Not. Roy. Astron. Soc. 301 (1998) [astro-ph/9807317].
- [7] E. Lefa, F. M. Rieger and F. Aharonian, The Astrophysical Journal 740 (2011) .
- [8] W. Essey and A. Kusenko, Astropart. Phys. 33 (2010) [0905.1162].
- [9] W. B. Atwood et al., The Astrophysical Journal 697 (2009) [0902.1089].
- [10] M. Wood et al., PoS ICRC2017 (2017) [1707.09551].
- [11] D. N. Burrows et al., Space Science Reviews 120 (2005) .
- [12] P. A. Evans et al., Astron. Astrophys. 469 (2007) [0704.0128].
- [13] VERITAS collaboration, PoS ICRC2015 (2016) [1508.07070].
- [14] VERITAS collaboration, PoS ICRC2017 (2018) [1708.02374].
- [15] J. D. Scargle, J. P. Norris, B. Jackson and J. Chiang, The Astrophysical Journal 764 (2013) 167.
- [16] T. Alexander, vol. 218 of Astrophysics and Space Science Library, 1997, DOI.
- [17] J. Timmer and M. Koenig, Astronomy and Astrophysics 300 (1995) 707.
- [18] T. Alexander, arXiv e-prints (2013) [1302.1508].
- [19] V. A. Acciari et al., Astrophysical Journal Letters 709 (2010) [1001.2590].
- [20] MAGIC collaboration, Astrophys. J. 748 (2012) [1101.2764].
- [21] H.E.S.S. collaboration, Astrophys. J. 802 (2015) [1501.05087].
- [22] Fermi-LAT collaboration, Astrophys. J. 813 (2015) L41 [1509.02063].
- [23] M. H. Salamon and F. W. Stecker, Astrophys. J. 493 (1998) [astro-ph/9704166].
- [24] W. Essey, O. E. Kalashev, A. Kusenko and J. F. Beacom, Phys. Rev. Lett. 104 (2010) [0912.3976].
- [25] W. Essey, O. Kalashev, A. Kusenko and J. F. Beacom, Astrophys. J. 731 (2011) [1011.6340].
- [26] F. Aharonian, W. Essey, A. Kusenko and A. Prosekin, Phys. Rev. D87 (2013) 063002 [1206.6715].
- [27] A. Prosekin, W. Essey, A. Kusenko and F. Aharonian, Astrophys. J. 757 (2012) [1203.3787].
- [28] W. Essey and A. Kusenko, Astrophys. J. 751 (2012) [1111.0815].
- [29] A. Franceschini, G. Rodighiero and M. Vaccari, Astron. Astrophys. 487 (2008) 837 [0805.1841].
- [30] A. Caproni, Z. Abraham, J. C. Motter and H. Monteiro, Astrophys. J. 851 (2017) [1712.06881].
- [31] M. Tavani, A. Cavaliere, P. Munar-Adrover and A. Argan, Astrophys. J. 854 (2018) [1801.03335].