From Stellar Halos to Intracluster Light: the physics of the Intra-Halo Stellar Component in cosmological hydrodynamical simulations
Abstract
We study the Intra-Halo Stellar Component (IHSC) of Milky Way-mass systems up to galaxy clusters in the Horizon-AGN cosmological hydrodynamical simulation. We identify the IHSC using an improved phase-space galaxy finder algorithm which provides an adaptive, physically motivated and shape-independent definition of this stellar component, that can be applied to halos of arbitrary masses. We explore the IHSC mass fraction - total halo’s stellar mass, , relation and the physical drivers of its scatter. We find that on average the increases with total stellar mass, with the scatter decreasing strongly with mass from dex at to dex at group masses. At high masses, , increases with the number of substructures, and with the mass ratio between the central galaxy and largest satellite, at fixed . From mid-size groups and systems below , we find that the central galaxy’s stellar rotation-to-dispersion velocity ratio, , displays the strongest (anti)-correlation with at fixed of all the galaxy and halo properties explored, transitioning from % for high , to % for low galaxies. By studying the temporal evolution, we find that, in the former, mergers not always take place, but if they did, they happened early (), while the high population displays a much more active merger history. In the case of massive groups and galaxy clusters, , a fraction % is reached at and then they evolve across lines of constant modulo some small perturbations. Because of the limited simulation’s volume, the latter is only tentative and requires a larger sample of simulated galaxy clusters to confirm.
keywords:
methods: numerical – galaxies: evolution – galaxies: formation1 Introduction
In the hierarchical formation scenario, large galaxies are assembled via a sequence of interactions and mergers with smaller galaxies (White & Rees, 1978). During such events, tidal forces strip stars from these smaller, satellite galaxies, which become part of the more massive, central galaxy, or are deposited in its outskirts in the form of streams, shells, and a diffuse component (e.g. Zwicky, 1952; Toomre & Toomre, 1972; Barnes & Hernquist, 1991; Mihos & Hernquist, 1996). The properties of these stellar remnants should contain important information about the assembly history and dynamical age of Milky Way-like systems (e.g. Ibata et al., 2005; Martínez-Delgado et al., 2008; McConnachie et al., 2009; Watkins et al., 2015; Merritt et al., 2016; Monachesi et al., 2016), galaxy groups (e.g. Da Rocha & Mendes de Oliveira, 2005; Durbala et al., 2008), and galaxy clusters (e.g. Mihos et al., 2005; Montes & Trujillo, 2014; Mihos et al., 2017; Morishita et al., 2017). However, the study of such stellar remnants is a complicated task because of their diffuse nature, which leads them to have low surface brightnesses. This has led to the development of multiple techniques to study them in both observations and simulations.
From the observational perspective, this requires the use of telescopes and techniques to detect low surface-brightness (LSB) features, as well as careful treatment of noise, scattered light, masking of foreground and background objects, and instrument systematics that can affect measurements in this faint regime (see e.g. Ibata et al., 2005; Mihos et al., 2005; McConnachie et al., 2009; Barker et al., 2009; Martínez-Delgado et al., 2010; Abraham & van Dokkum, 2014; Monachesi et al., 2016). Moreover, the definition of the diffuse stellar component is likely to depend on characteristics of the telescope and observation, as well as the system of interest. For studies in which individual stars can be resolved, the diffuse stellar outskirts are often defined by their location. Specifically, studies of Milky Way-like galaxies measure stellar halos using Asymptotic Giant Branch (AGB) stars along the minor axis of the central galaxy (e.g. Mouhcine et al., 2005; Greggio et al., 2014; Monachesi et al., 2016), and along the major axis at sufficiently large distances from the galaxy (Monachesi et al., 2016). In contrast, studies that use integrated light either treat galaxies on an object by object basis (e.g. Mihos et al., 2005; Krick & Bernstein, 2007; Martínez-Delgado et al., 2010; Merritt et al., 2016), or stack samples of galaxies (e.g. Zibetti et al., 2005; D’Souza et al., 2014; Zhang et al., 2018). In the first approach, the light from a galaxy is separated from that of the diffuse component by fitting single or multiple Sérsic profiles (Sérsic, 1963), and the diffuse envelope is treated as either the outermost component (e.g. D’Souza et al., 2014; Zhang et al., 2018) or is defined by the excess light or mass from fits to the inner regions of the galaxies (e.g. Merritt et al., 2016; Morishita et al., 2017). In the second, a surface brightness threshold separates the light from galaxies and from the diffuse envelope (Feldmeier et al., 2004; Zibetti et al., 2005; Montes & Trujillo, 2014; Burke et al., 2015), which we note is a method also adopted by some numerical studies (e.g. Rudick et al., 2006).
From the theoretical perspective, reliable predictions of stellar halos and Intracluster Light (ICL) require simulations to realistically trace the accretion and subsequent disruption of the satellite galaxies that give rise to these structures, and to resolve the sparsely populated outskirts of galaxies. Early studies of stellar halos, such as Bullock & Johnston (2005) and Gauthier et al. (2006), used idealised non-cosmological -body simulations with satellite populations whose properties (e.g. orbital parameters and accretion histories) informed by cosmological simulations. Others, e.g. Rudick et al. (2006), used dark matter halos drawn from cosmological -body simulations, populated with galaxies using an occupation distribution formalism, to study the formation and evolution of the ICL. Cooper et al. (2010) studied stellar halo formation in a self-consistent cosmological context by coupling a semi-analytical model to a cosmological -body simulation, in which subhalos’ most bound dark matter particles are tagged and used as dynamical tracers of the stellar populations predicted, to predict the properties of stellar halos; here it was assumed that stellar halos are composed of stellar particles that were accreted from satellites and reside outside a spherical aperture of 3 kpc (see also Cooper et al., 2013; Cooper et al., 2015).
The current generation of cosmological hydrodynamical simulations (e.g. Dubois et al., 2014; Vogelsberger et al., 2014; Schaye et al., 2015) are now sufficient to model self-consistently the formation and hierarchical assembly of statistical samples of galaxies, and consequently track the formation of stellar streams, shells, and halos. This provides important new insights into formation processes (e.g. in-situ vs ex-situ halos; cf. Font et al., 2011), but it also complicates the separation of galaxies from their stellar components. In uniform resolution cosmological boxes, this has led the diffuse component to be defined as the stellar material outside spherical apertures, which can be either fixed (e.g. Font et al., 2011; Pillepich et al., 2018) or dependent upon the mass distribution of the system (e.g. Pillepich et al., 2014; Elias et al., 2018). In zoom cosmological simulations of late-type galaxies, a more ad hoc approach has been used. For example, Pillepich et al. (2015) used a cylindrical volume to separate galaxies from their stellar halos, while Monachesi et al. (2019) used rectangular windows, mirroring an observational 2D approach, to separate components. While such spatial definitions are simple and easy to compare between studies, they ignore the sometimes complex galaxy morphology, and, most importantly, they do not exploit the velocity information that is available in simulations.
However, this is not the case for all existing methods in the literature. For example, at galaxy clusters scales, velocity information has been used to separate the brightest galaxy cluster (BCG) from the ICL, either by comparing particles’ binding energy in which the ICL is the stellar material bound to the cluster but not to a particular galaxy (e.g. Murante et al., 2004; Murante et al., 2007; Rudick et al., 2011), or by using its kinematics and fitting Maxwellian distributions to the total velocity distribution being the diffuse component the one with the largest dispersion (e.g. Puchwein et al., 2010; Dolag et al., 2010; Cui et al., 2014; Remus et al., 2017). These are both physically motivated definitions; however, in applying the first method, it is not clear how to properly disentangle the contribution from individual cluster members to the global gravitational potential (Murante et al., 2004; Rudick et al., 2011), while in applying the second method, how particles are assigned to the distributions is not unique (Dolag et al., 2010; Cui et al., 2014) and the number of distributions needed to describe the system can vary between clusters (Remus et al., 2017).
Studies of the diffuse stellar component in the literature have focused on Milky Way-like galaxies, in which case the diffuse stellar component is equivalent to a stellar halo, or on galaxy groups and clusters, in which case it is the IGL and ICL, respectively. This, in addition to the variety of definitions of the diffuse stellar component and the techniques used to identify it, has limited our understanding of how it is built across the dynamic range of galaxy formation. This critical limitation has resulted in a disconnect between the study of the assembly of galaxies and the build up of the diffuse stellar component, despite hierarchical growth underpinning both. Some theoretical studies have addressed this issue either by applying the same technique or definition to systems of a wide mass range (e.g. Cooper et al., 2010, 2013; Cooper et al., 2015; Pillepich et al., 2018), or using an adaptive definition of what the diffuse component is (e.g. Pillepich et al., 2014; Elias et al., 2018). However, there is still not yet a physically motivated adaptive definition that can be reliably applied to the whole dynamic range of systems resolved by cosmological hydrodynamical simulations.
In this work we present the first results of a new method to identify the diffuse stellar component in simulations based on the galaxy finding algorithm described in Cañas et al. (2019) developed within the phase-space structure finder code velociraptor (Elahi et al., 2011, 2019a). In this method, the diffuse stellar component is defined as kinematically hot stellar particles that are distinct from the stellar components of phase-space overdense galaxies. The algorithm is adaptive and capable of separating the diffuse component in fairly isolated systems as well as in complex ones such as galaxy groups and clusters. We have decided to refer to the diffuse stellar component as the Intra-Halo Stellar Component (IHSC).
This study aims to characterize the mass content of the IHSC across different mass ranges and epochs by exploring to detail the IHSC mass fraction - stellar mass relation, . In particular, we want to understand the origin of the large scatter observed in the IHSC mass fraction of Milky Way-mass like galaxies (over 2 dex difference from peak-to-peak), which has been measured recently by Merritt et al. (2016) using integrated light observations of the Dragonfly Telephoto Array (Abraham & van Dokkum, 2014), and later confirmed by Harmsen et al. (2017) with stellar counts observations of the GHOSTS Survey (Radburn-Smith et al., 2011). We also want to understand whether the ICL fraction111Referring either to light or mass, which can be interchangeable if a constant mass-to-light ratio, , is assumed. correlates with cluster mass (Murante et al., 2007; Rudick et al., 2011) or not (Krick & Bernstein, 2007; Contini et al., 2014; Cui et al., 2014), as well as, if its evolution is strong (Burke et al., 2015), or rather weak or nonexistent (Krick & Bernstein, 2007; Rudick et al., 2011; Montes & Trujillo, 2018); this is an unresolved problem, from both observational and theoretical perspectives. In this first study we use the Horizon-AGN simulation (Dubois et al., 2014), to address this problem. This state-of-the art simulation has a volume big enough to contain galaxy groups and low-mass galaxy clusters ( halos with ), as well as, enough resolution to explore Milky Way-like systems.
This paper is organised as follows. We first describe in Section 2 the Horizon-AGN simulation and the algorithm used to identify galaxies and the IHSC, as well as a description of how properties used throughout the paper are calculated. In Section 3 we show visually the IHSC for systems ranging in mass from the Milky Way up to galaxy clusters. We also describe the relation and show how the mass content in galaxies and the IHSC is affected by parameters of our identification method, as well as how our method compares to spherical aperture definitions of the IHSC. In Section 4, we explore the origin of the scatter observed in the relation and correlations with galaxy properties. In Section 5 we investigate the evolution of the IHSC for individual systems, as well as entire galaxy populations. Finally in Section 6 we present a summary and conclusions of this work. In Appendix A we present a comparison between our method to separate the IHSC and widely used definitions in the literature, and also show the mass fraction in the IHSC as a function of halo mass.
2 Methodology
2.1 Horizon-AGN Simulation
Horizon-AGN, first described in Dubois et al. (2014), is a state-of-the-art hydrodynamical simulation of a statistically representative volume of the universe in a periodic box of Mpc on each side, with a cold dark matter (CDM) cosmology. It adopts values of a total matter density , dark energy density , amplitude of the linear power spectrum , baryon density , Hubble constant km s-1 Mpc -1, and spectral index , in concordance to results from the Wilkinson Microwave Anisotropy Probe 7 (WMAP7, Komatsu et al., 2011).
The simulation follows the formation and evolution of galaxies using the adaptive mesh refinement (AMR) code ramses (Teyssier, 2002), with a total of 10243 dark matter particles with mass . It has an initial number of 10243 gas cells, which are refined up to seven times reaching a maximum physical resolution of 1 kpc. It includes gas cooling, heating from a uniform redshift-dependent UV background, star formation, stellar feedback driven by supernovae (SNe) Type Ia and II, and stellar winds. Black holes (BHs) grow according to a Bondi-Hoyle-Lyttleton accretion scheme capped at the Eddington accretion rate, and a two-mode AGN feedback is explicitly implemented as an isotropic thermal energy injection at accretion rates greater than 1% the Eddington accretion, and as a bipolar outflow otherwise (see Dubois et al., 2010, 2012; Dubois et al., 2014, for further details); these implementations produce BH populations that reproduce the observed evolution of the BH mass density and mass functions (Volonteri et al., 2016).
Horizon-AGN produces galaxy populations whose luminosity and stellar mass functions, as well as star formation main sequence, are in good agreement with the observed ones (Kaviraj et al., 2017). It has also been used to demonstrate that AGN feedback is crucial to produce the observed morphology diversity and kinematic properties of massive galaxies (Dubois et al., 2016), and to show how AGN feedback affects the total density profile of galaxies and dark matter halos (Peirani et al., 2017, 2019). In addition, the simulation has been used to investigate the alignment between cosmic web filaments and the spins of galaxies, and how mergers change the spin orientation of galaxies (Dubois et al., 2014; Welker et al., 2014).
2.2 Identification of structures
Structure is identified using the code velociraptor, first introduced in Elahi et al. (2011) and subsequently upgraded in Cañas et al. (2019) and Elahi et al. (2019a). Here we describe the identification process for dark matter halos, galaxies and the IHSC.
2.2.1 Galaxies
Galaxies are identified using a phase-space (6D) Friends-of-Friends (Davis et al., 1985, FOF) search to identify phase-space dense structures. The algorithm is described in detail in Cañas et al. (2019), but here we summarise key features. The first step consists of obtaining a configuration space (3D) FOF, which is done using the commonly adopted dark matter inter-particle spacing as linking length, . Subsequently a 6DFOF search is done, where is shrunk as galaxies are expected to be more concentrated than dark matter halos; the velocity space linking length is chosen to be equal to the 3DFOF object velocity dispersion, . Substructures are identified by performing an iterative 6DFOF search, as is used for core-finding in dark matter halos. A key feature of this process for galaxies is the selection of the initial and iterative parameters used for this search, and properly assigning particles to each of these cores. The most massive galaxy in each 3DFOF object is considered to be the central, and the remaining objects to be substructures/satellites.
2.2.2 Dark matter halos
Dark matter halos and their substructure can also be identified with velociraptor. However, because we focus on the stellar mass content in galaxies and the IHSC, dark matter halos will only be used to refer to the total matter content (stars + BH + gas + dark matter) in the region of interest. Halos are therefore defined as spherical regions centred at the centre-of-mass of the most massive galaxy of a FOF object, in which the total mass average overdensity is 200 times the critical density of the universe. Throughout the paper we use the subscript to refer to properties of these objects, e.g .
2.2.3 Defining the IHSC
The IHSC is composed of all the background particles that were not assigned to galaxies in the field 6DFOF search. The parameters that define the IHSC are therefore the linking lengths used for the field 3DFOF and 6DFOF search. Because galaxies and tidal features are identified using a phase space FOF algorithm, the IHSC is composed of particles that are too far in phase space to be linked to any structure. Physically, this means that the component is diffuse and kinematically hot. This definition allows us to estimate robustly the IHSC for systems of different masses in a cosmological simulation. velociraptor has the ability to recover streams and other tidal features, but we do not include these as part of the IHSC; if desired it is straightforward to include those structures into the IHSC. The mass in these structures is typically less than a few per cent the IHSC mass.
Moreover, the outer extent of the background particles that compose the IHSC can be defined either by the region delimited by the 3DFOF field search, or by the virial radius . While the second approach provides a theoretical point of comparison with simulations and observations, in the case of merging groups and clusters, some of the diffuse material between such systems might be left out. Throughout this paper we use the former definition, although we note that both definitions give equivalent results. See Appendix A for a comparison of the total and IHSC stellar mass content using both of these definitions.
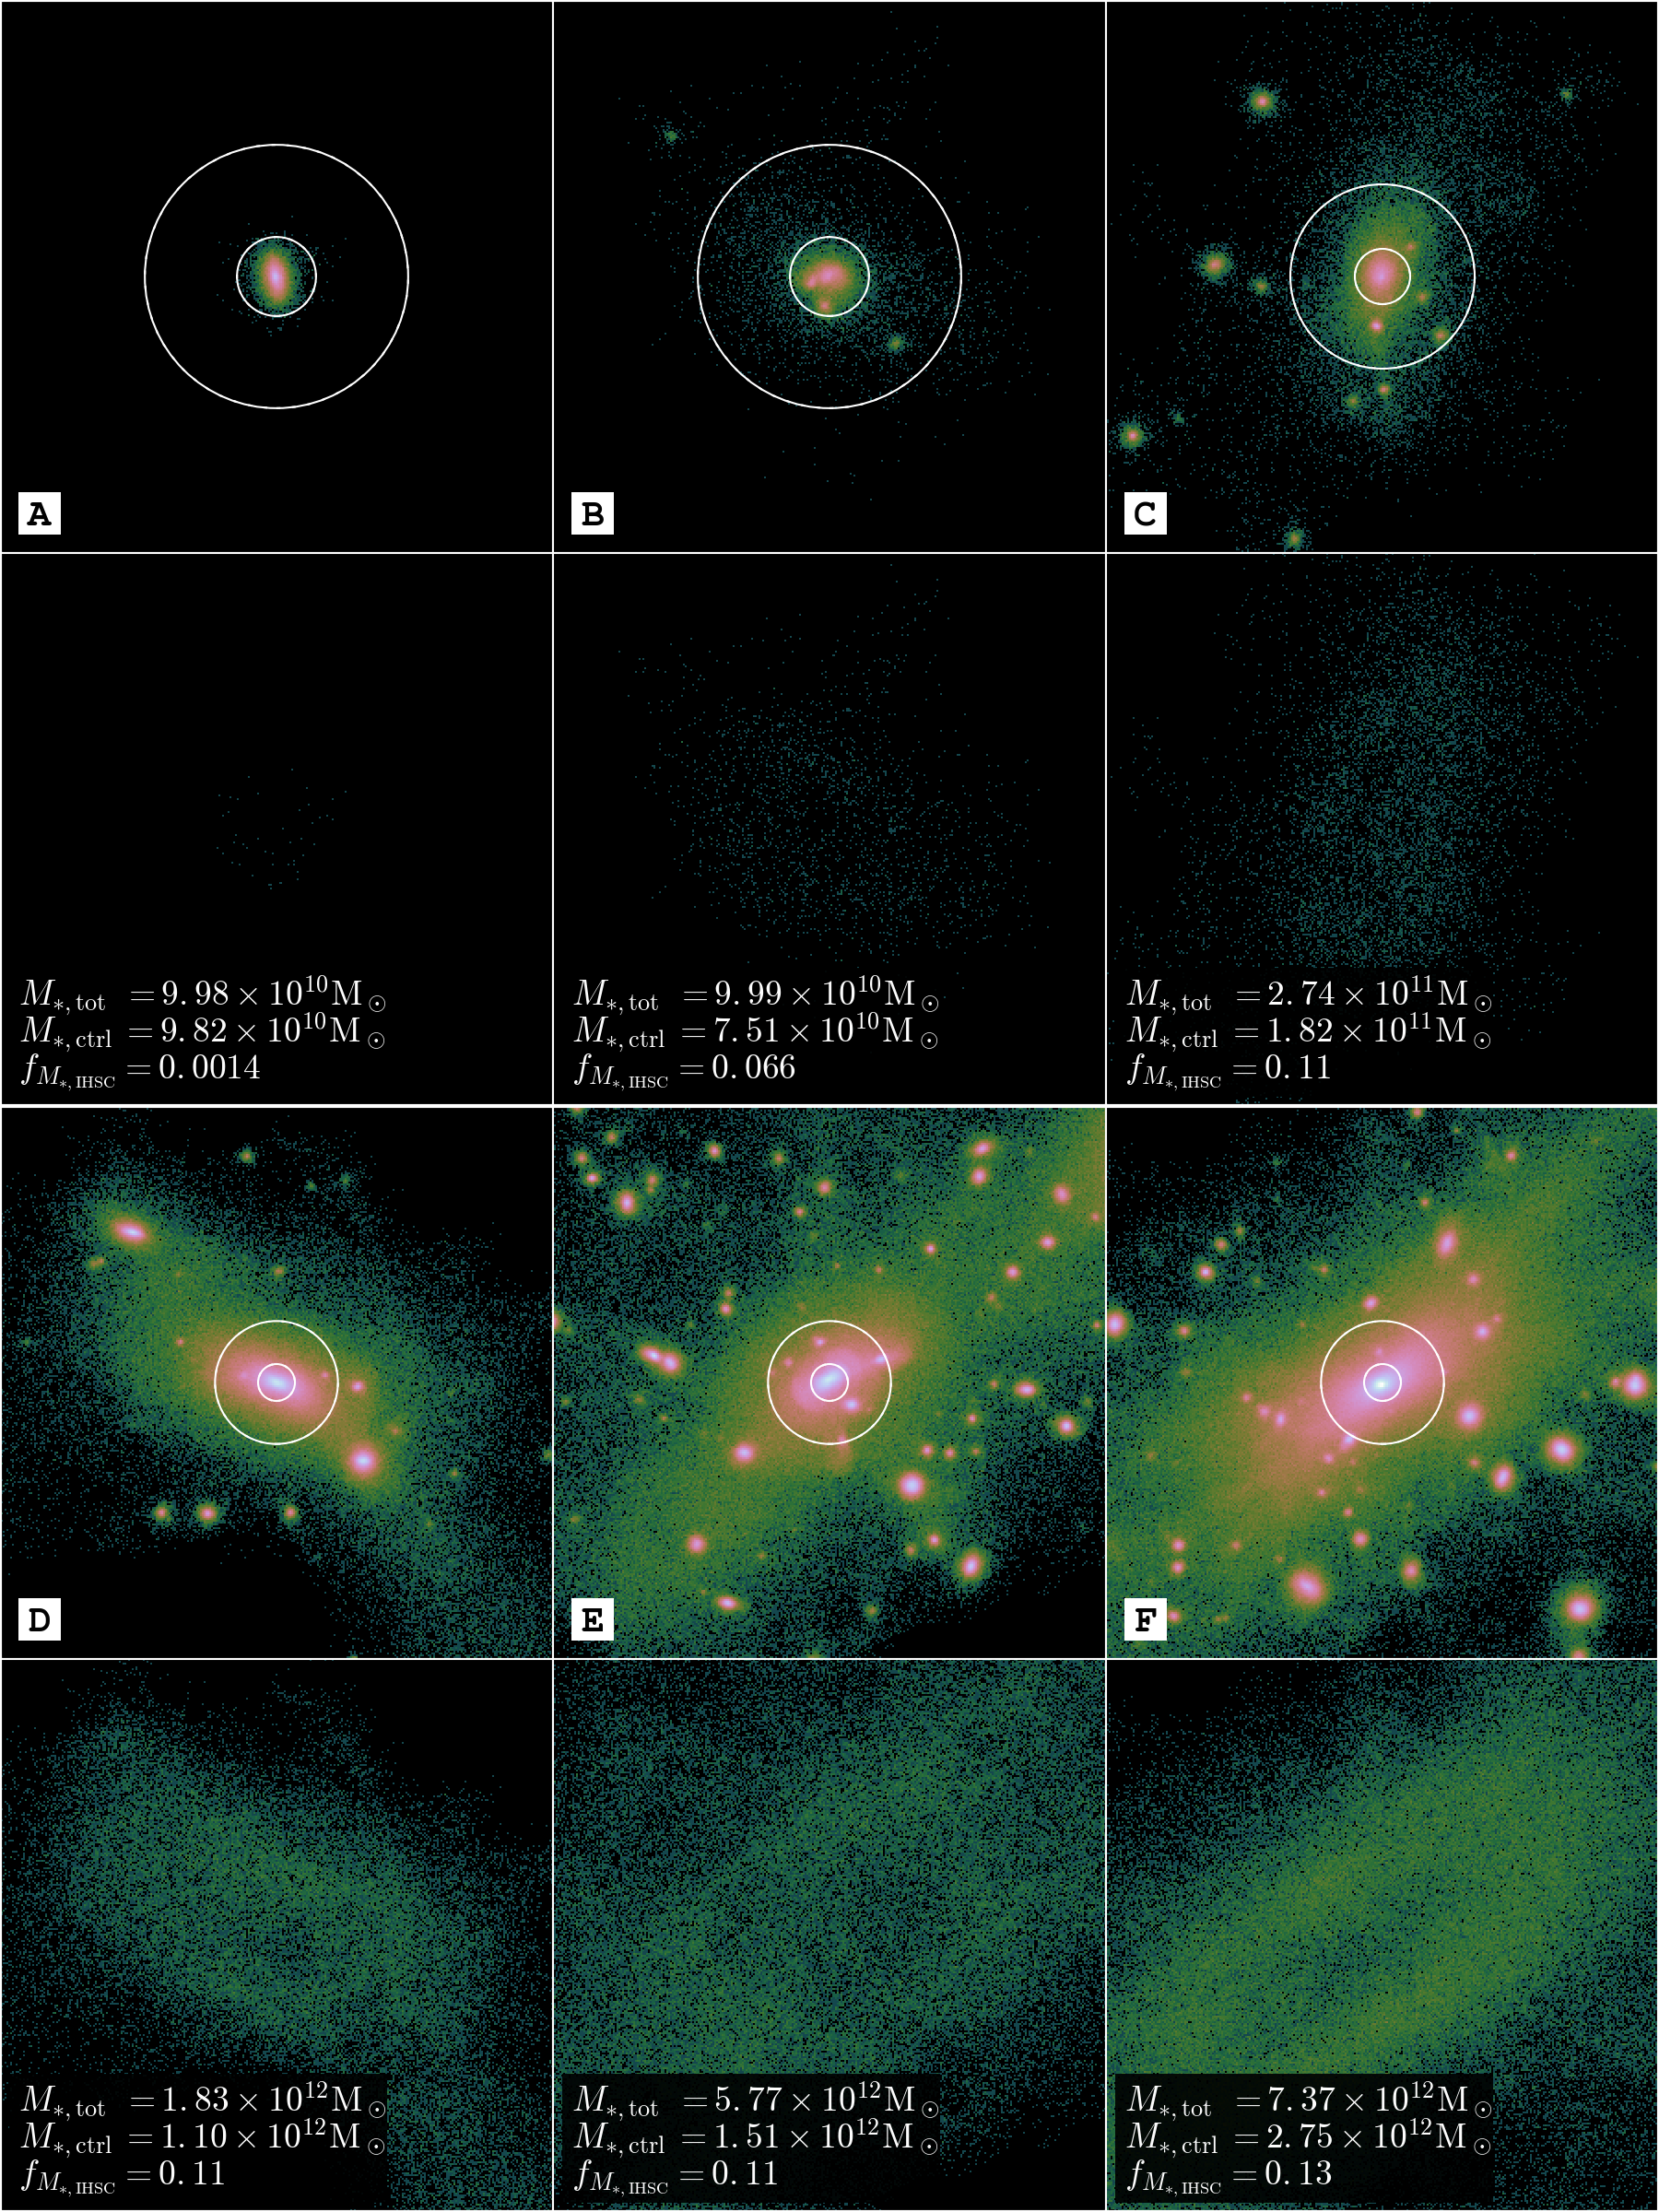
In Fig. 1, we give a visual impression of the projected stellar density of all stellar particles (first and third row) and the IHSC (second and fourth row) of Milky Way-like mass systems, as well as galaxy groups and clusters. For reference, we show the extent of fixed spherical apertures of radius kpc commonly used to separate the central galaxy from the IHSC (e.g. Pillepich et al., 2018). While fixed spherical apertures are a simple way of separating the mass content in the central galaxy and the IHSC, they do not necessarily provide a robust definition that works for systems displaying a variety of mass distributions that depart from a spherical symmetry, as well as systems of a wide range of masses. For example, a spherical aperture of 30 kpc might be reasonable for Milky Way-like mass systems to separate the stellar content of the central galaxy from that of the IHSC (e.g. systems A and B in Fig. 1). However, for galaxies at the centre of groups and clusters this aperture can in fact truncate the outer parts of the galaxy (e.g. D, E and F). In contrast, a larger aperture, e.g. 100 kpc, could work for massive systems, but will be too large for smaller galaxies encompassing most of the stellar material within the aperture; this can lead to measurements of IHSC mass fraction that are too low as a result of the measurement method. See also Appendix A for a comparison between these different definitions.
To solve these issues, previous studies have implemented adaptive spherical apertures based on the central galaxy + IHSC (CG+IHSC) mass distribution; for example a sphere with radius proportional to the CG+IHSC half-mass radius, , (e.g. Pillepich et al., 2018; Elias et al., 2018). However, it is not straightforward to know which value of should be used to give consistent answers across the mass range covered by hydrodynamical simulations. Moreover, for this particular choice of , the amount of mass that is assigned to the IHSC is likely to depend on the specific distribution of the central galaxy rather than on the properties of the IHSC. For example, the of a system with a spiral central galaxy will be larger than that of an elliptical galaxy with same stellar mass only because of their intrinsic mass distribution (e.g. van der Wel et al., 2014); in this case, a lower mass fraction in the IHSC would be expected for spirals compared to ellipticals because of the method rather than the properties of the IHSC.
By defining the IHSC as the kinematically hot component, we are able to address all the issues that spherical aperture definitions have, as is seen in the IHSC projections of Fig. 1. Moreover, by having the capability to consistently define the IHSC for systems with a wide range of masses, we can perform statistical studies of the IHSC in entire cosmological simulations, as well as systematically following the evolution of the IHSC for both individual systems and complete entire populations.
For simplicity, throughout this paper we refer to 3DFOF objects as “systems”, which would typically be composed by a central galaxy, its satellite galaxies, and the IHSC.
2.3 Calculated properties
In this Section we describe how we calculate the properties of systems and galaxies used in upcoming sections.
2.3.1 Number of satellites
The number of satellites of a given system (3DFOF) is the count of substructures found by velociraptor composed of more than 50 stellar particles.
2.3.2 Mass content
The stellar mass of objects will be denoted by the subscript ‘’ and a label. This quantity refers to the sum of the mass of all stellar particles in that object/component as identified by velociraptor. For the total mass content inside , i.e. stars + gas + BH + dark matter, we will simply refer to as , and for the stellar mass only within .
2.3.3
For the kinematic morphology parameter of the central galaxies, we first calculate the spherical radius that encloses 50% of the stellar mass of the central galaxy222Note that we consider the central galaxy and the IHSC as separate components, therefore no IHSC particles are included in the computation of the half-mass radius., . Then, we calculate the specific angular momentum, , for all the particles within , i.e.
| (1) |
where and are the position and velocity vectors of stellar particle , with mass , measured with respect to the galaxy’s centre-of-mass; and is the mass inside , or equivalently . The rotational velocity is calculated as
| (2) |
The velocity dispersion is calculated as the average 3D velocity dispersion of all stellar particles within ,
| (3) | |||
| (4) |
where is the velocity of particle along the Cartesian axis , and , , and are the velocity dispersions along the , , and axes, respectively. Finally, the kinematic morphology parameter is simply the ratio between these quantities.
2.3.4 Star formation rate
The star formation rate (SFR) of a galaxy is calculated by summing the mass of all its stellar particles with age, , smaller than a given window from the time of the snapshot analysed,
| (5) |
Throughout this paper we adopt a Myrs to calculate this quantity. SFRs calculated using windows of Myrs, are consistent with that of Myrs. Mass loss due to stellar evolution is neglected, however; if included, it would represent a systematic shift of the estimated SFRs, and would not change our conclusions.
3 Present day relation
The IHSC mass fraction, , is calculated as
| (6) |
where is the stellar mass of the IHSC, and is the total stellar mass of the system that includes all the stellar mass in the galaxies (central and satellites) and the IHSC. As shown in Cañas et al. (2019), velociraptor’s galaxy finding algorithm is also capable of identifying tidal structures, such as stellar streams and shells, as separate objects that are distinct in phase-space from the galaxies and are kinematically colder than the IHSC envelope. These structures are often incorporated into the IHSC because of their diffuse and accreted nature, in the sense that their stars do not form in the main galaxy/dark matter halo branch, similar to the outskirts of galaxies and clusters (in-situ vs. ex-situ, e.g. Pillepich et al., 2015; Dubois et al., 2016). We argue, however, that it is important to separate such structures from the IHSC as some of that material may be accreted onto the galaxy at later times. Although these tidal structures can be found with ease by velociraptor, for the purposes of this study we consider all kinematically distinct stellar structures as satellite galaxies, while the IHSC is only the diffuse stellar background.
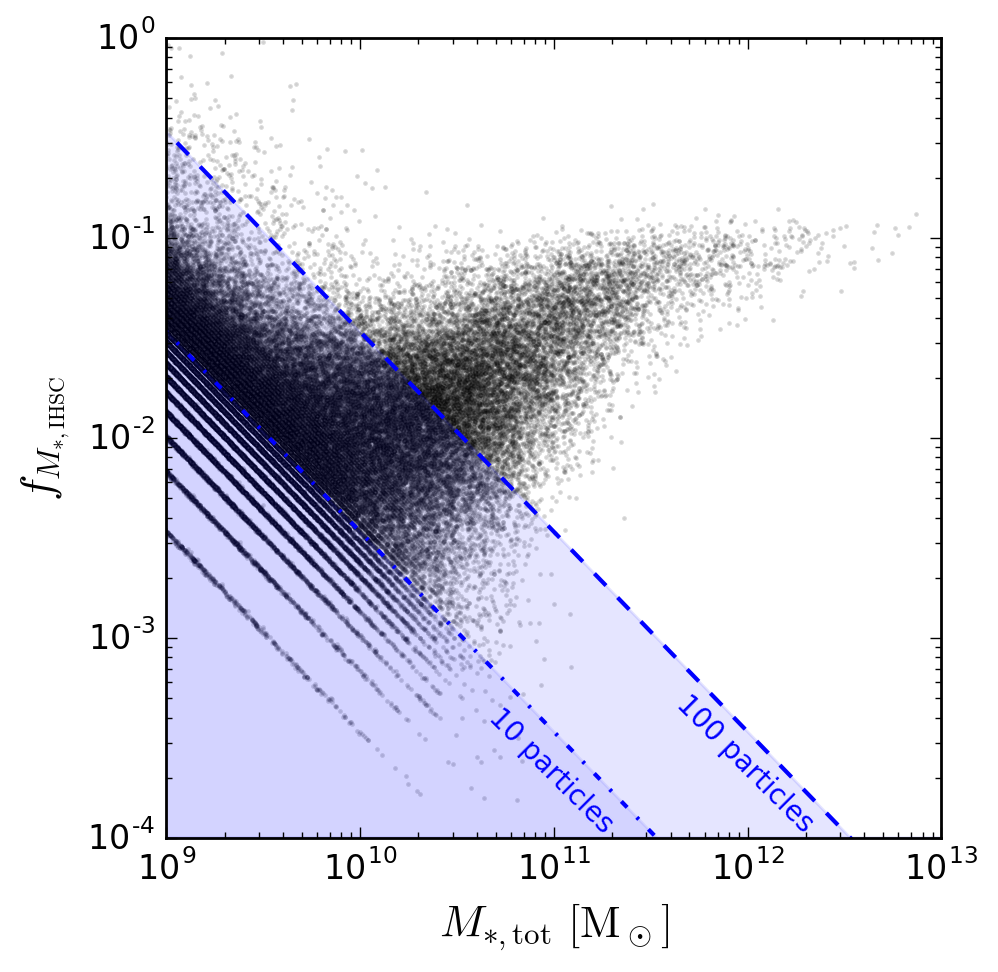
In Fig. 2 we show the relation in Horizon-AGN at . The measurements for individual systems (i.e. entire 3DFOF objects) are shown as black dots. Dashed and dotted-dashed blue lines delimit regions where, at fixed total stellar mass, the IHSC is composed of and particles, respectively. At increases with increasing , with the scatter decreasing as increases. At , the relation flattens while the scatter keeps decreasing out to the most massive system resolved in Horizon-AGN, .
The variation in at fixed is dex at (), and gradually decreases towards higher . This is caused by changes in the principle mode of growth of a system. At () systems grow either via continuous infall of gas and star formation; accretion of multiple satellite galaxies; or a combination of these two. The large dispersion observed at these masses is therefore a consequence of the various growth mechanisms these systems can undergo (this is demonstrated in Section 5). In contrast, mass growth at is expected to be dominated by interactions and galaxy mergers (Oser et al., 2010; Rodriguez-Gomez et al., 2016; Dubois et al., 2013, 2016). Because this is the dominant growth mechanism, we expect that these systems will display a tighter distribution in the relation. It is important to note, however, that the limited volume of Horizon-AGN means that it contains only a handful of systems with , and so the tight distribution observed at these masses may be due to poor statistics.
At there is an apparent anti-correlation between and . This is a consequence of the resolution limit of the simulation. In Horizon-AGN, stellar particles have a mass resolution of , which means that in a galaxy composed by 300 particles (i.e. ), a will be composed by only 3 particles. Such features are visible as diagonal patterns at and , which extends to the upturn observed in the relation and is delimited by the 100 particle limit (blue dashed line). This upturn towards lower is also an effect caused by the method used: at spatial scales close to the resolution limit of the simulation, 3DFOF objects can often be decomposed into sparse particle distributions with inter-particle distances comparable to the 3DFOF linking length; by construction such particles are not linked to galaxies by the 6DFOF search, and are therefore assigned to the IHSC, giving high for 3DFOF objects close to the resolution limit.
The overall shape of the relation is similar to the accreted stellar mass fraction total stellar mass relation (e.g. Cooper et al., 2013; Rodriguez-Gomez et al., 2016), but it is important to note that these two quantities are not the same. We expect this similarity because the mass budget in the outskirts of galaxies and clusters, included in the IHSC, is dominated by stars that originated in satellite galaxies, i.e. were accreted into the host galaxy/dark matter halo. However, accreted mass estimates also take into account the stellar mass bound to satellites, as well as stars in the central galaxy that were not formed along the main galaxy branch, and is the reason why the amplitude of accreted stellar mass fractions is larger than at similar .
3.1 Parameter dependence of the IHSC
We mentioned in Section 2.2 that the IHSC is determined by the choice of linking lengths used for the 6DFOF field search. As the velocity linking length in the 6DFOF search is chosen to be proportional to the velocity dispersion of each system, the only user-defined parameter is the configuration space linking length, . This parameter sets a phase-space density cut on the particles that are linked to galaxies, excising them from the IHSC. Therefore, larger values of will assign more mass to the galaxies and less to the IHSC and vice-versa, as was qualitatively explored in appendix A of Cañas et al. (2019). Here, we study in detail the effects different choices of have on the estimated IHSC mass, . Recalling step 2 of the galaxy identification method used in Cañas et al. (2019, section 3.1.2), the configuration space linking lengths are defined as
| (7) | ||||
where is the mean inter-particle spacing of dark matter particles in the simulation, and and are constants ; we adopt the commonly used value of .
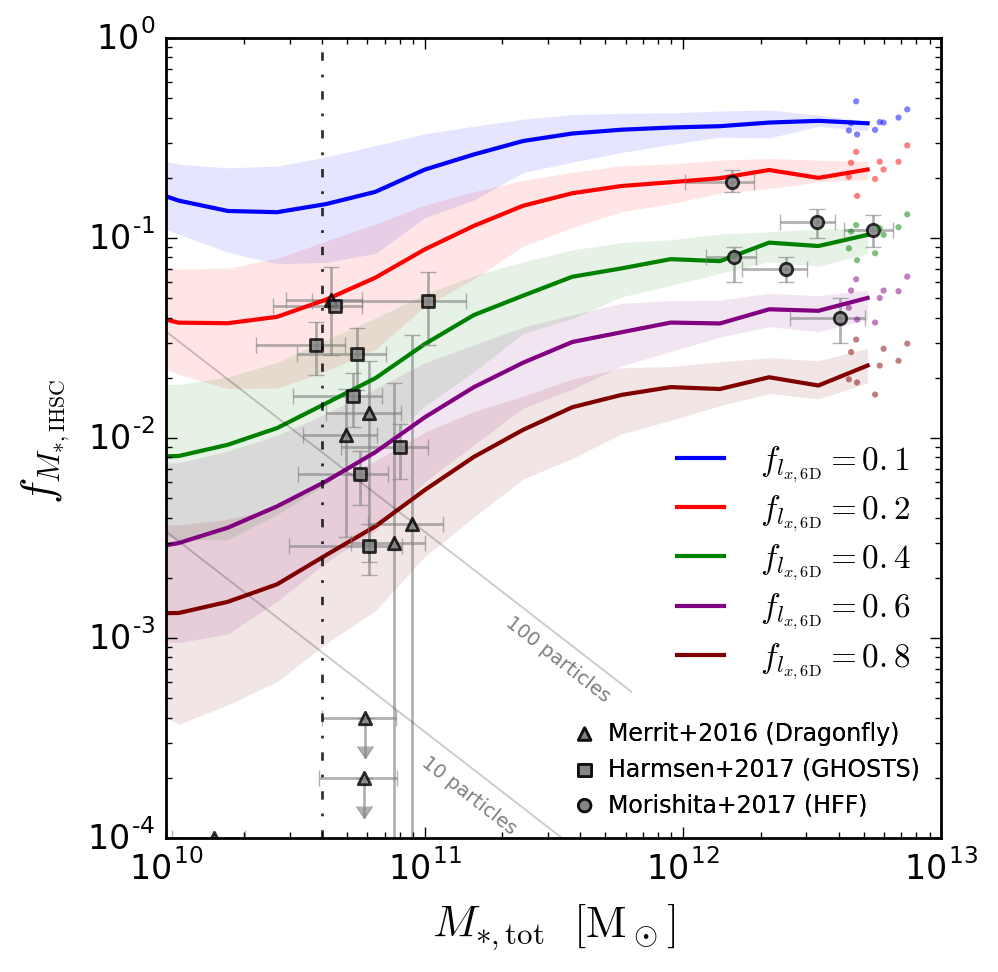
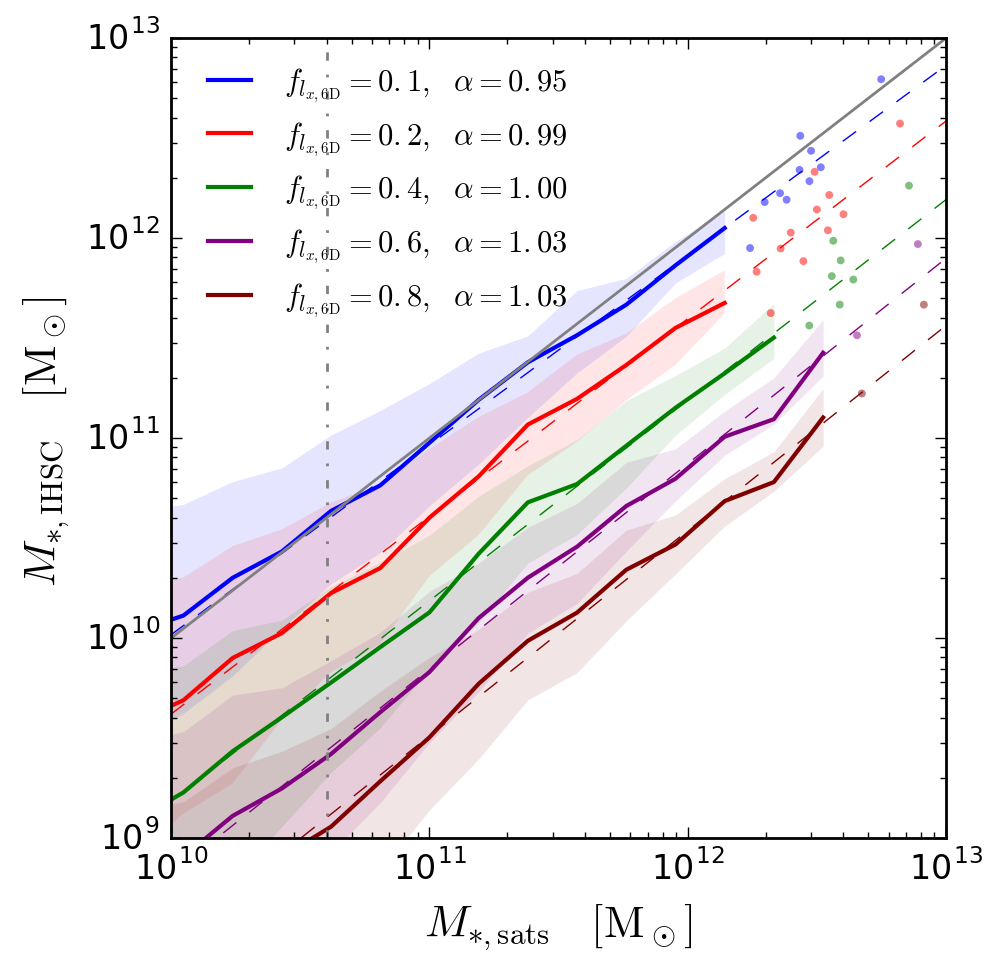
In Fig. 3 we show the effect that changing has on the relation, as estimated using different values of ; solid lines show medians in equal log-spaced mass bins, and shaded regions delimit the 16th and 84th percentiles of the distribution in each mass bin. Increasing has the effect of changing the overall normalization of the relation, in a way that increasing leads to a lower . In addition, the scatter of the relation below also depends on , with higher values leading to larger scatter. Despite these differences, the overall behaviour of the relation is qualitatively the same: increases with up to , followed by a flattening at higher masses. The scatter also decreases monotonically with increasing , which is in part caused by the limited volume of Horizon-AGN. The increasing at fixed mass with decreasing linking length is expected as higher values result in assigning more particles to galaxies, reducing the mass in the IHSC. It should be noted that for small values, resolution effects (i.e. upturn in the relation) become important at smaller (vertical dot-dashed line). Observations at this stage are shown for reference.
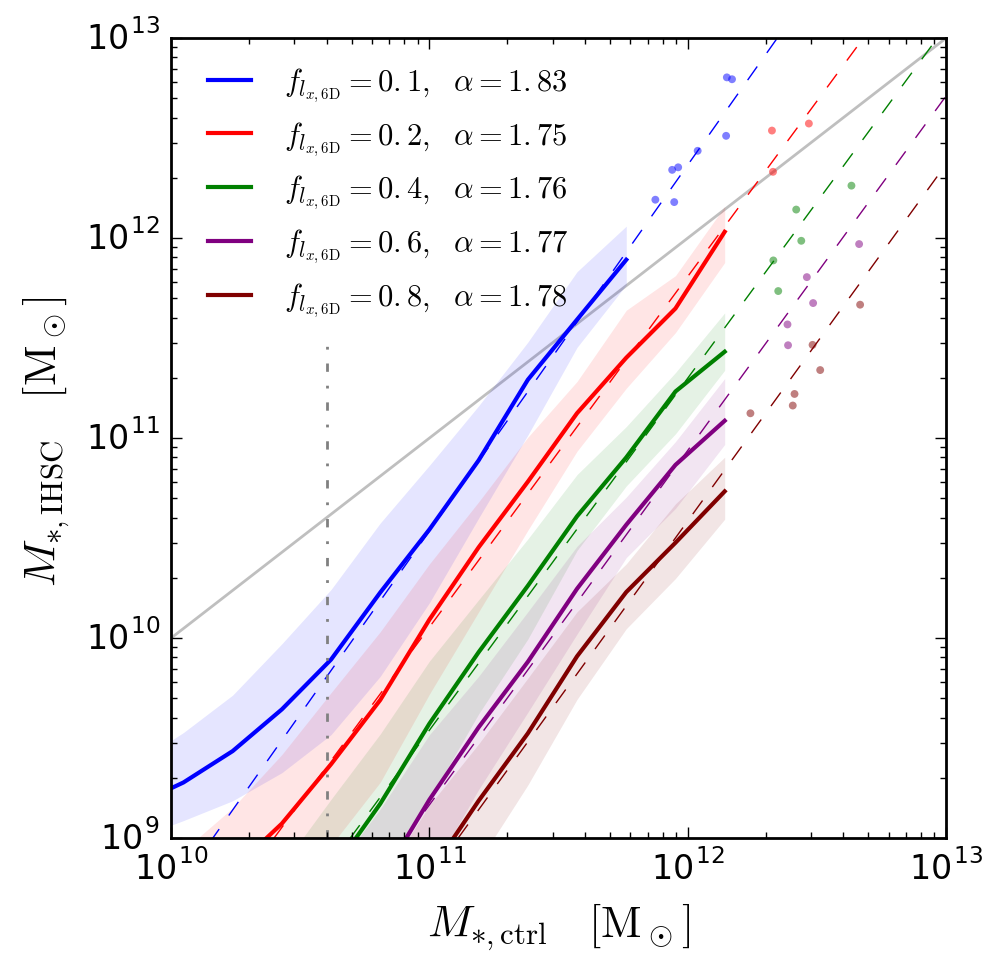
In Fig. 4 we compare the estimated mass in the IHSC to that in the central galaxy, , and to the total stellar mass in satellites, ; For each , we fit a power-law as , to the mean per bin, shown as dashed coloured lines, with power-law index as labelled; bins are required to have at least 5 systems and a to avoid consideration of systems affected by resolution; points show individual measurements of resolved systems in bins with less than 5 systems. The mass relations between these components are strikingly similar for different values of , with power-law index variations smaller than 5%. This agreement is remarkable due to the large range of and stellar masses explored. Moreover, the extrapolation of the fit to each distribution does seem to be in agreement as well with mass estimations of high mass systems where statistics are low.
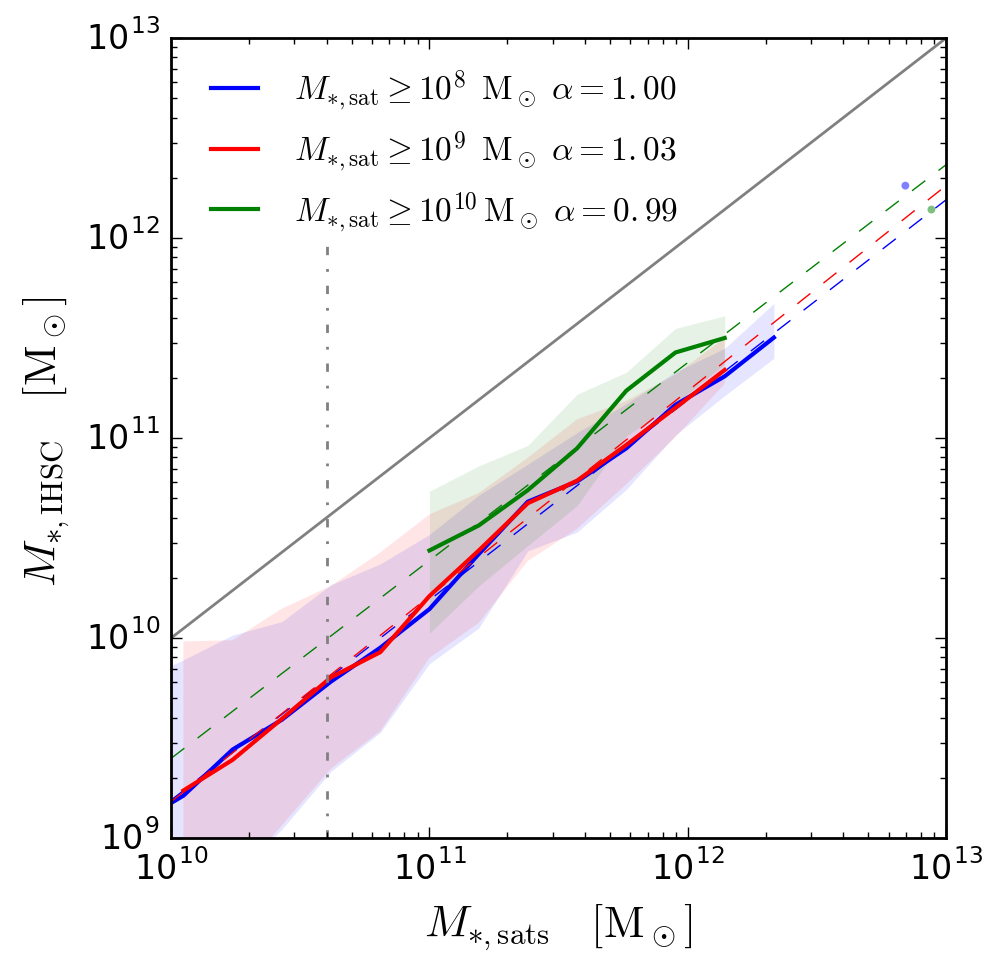
The agreement between the mass relations shows that the robustness of our results rely on the methodology and not on a specific choice of 333We must remember that as with any other method, poorly chosen parameters affect properties of individual galaxies, e.g. extremely short values of are likely to identify only the cores of galaxies. See appendix A of Cañas et al. (2019) for a visual example.. This consistency can also be used to make predictions that can easily be tested by observations. For example, the fact that for the relation tells us that on average the IHSC mass is a constant fraction of the total mass in satellites. In fact, although in Fig. 4 includes all substructures found by velociraptor composed of at least 50 particles (i.e. ), the power-law index is also consistent if mass thresholds of and are used, as shown in Fig. 5. These results highlight the advantage of using phase-space iso-density cuts over fixed spherical aperture definitions of the IHSC, where the choice of parameter does affect the slope measured (e.g. Pillepich et al., 2018). The latter can be understood because the stellar mass distributions of systems of different mass (e.g. MW-like and cluster) are not self-similar, nor necessarily spherically symmetric; therefore, the mass enclosed within spherical shells assigned to the central (IHSC) for an increasing (a decreasing) correspond to a varying fraction across , and consequently they will not preserve the mass relation between these components. See Appendix A for complementary comparisons to spherical apertures.
The observed behaviour of our method is quite a useful finding for both simulations and observations because definition of the IHSC (i.e. stellar halo, IGL, ICL) often relies on defining or delimiting the extent of galaxies, which is not a straightforward task because there is no ‘true’ definition of where galaxies end. In this study we adopt , because it predicts a relation that is in better agreement with the estimated stellar halo mass fractions for Milky Way-like galaxies from Merritt et al. (2016) and Harmsen et al. (2017), and recent ICL mass estimations of Morishita et al. (2017). Although the exact method to measure the stellar halo and ICL mass fraction differs between studies, these measurements give a rough idea of the expected mass fraction in different mass ranges; this provides us with an equivalent phase-space density threshold, which in our method is equivalent to a fixed .
3.2 Comparison to IHSC definitions in literature
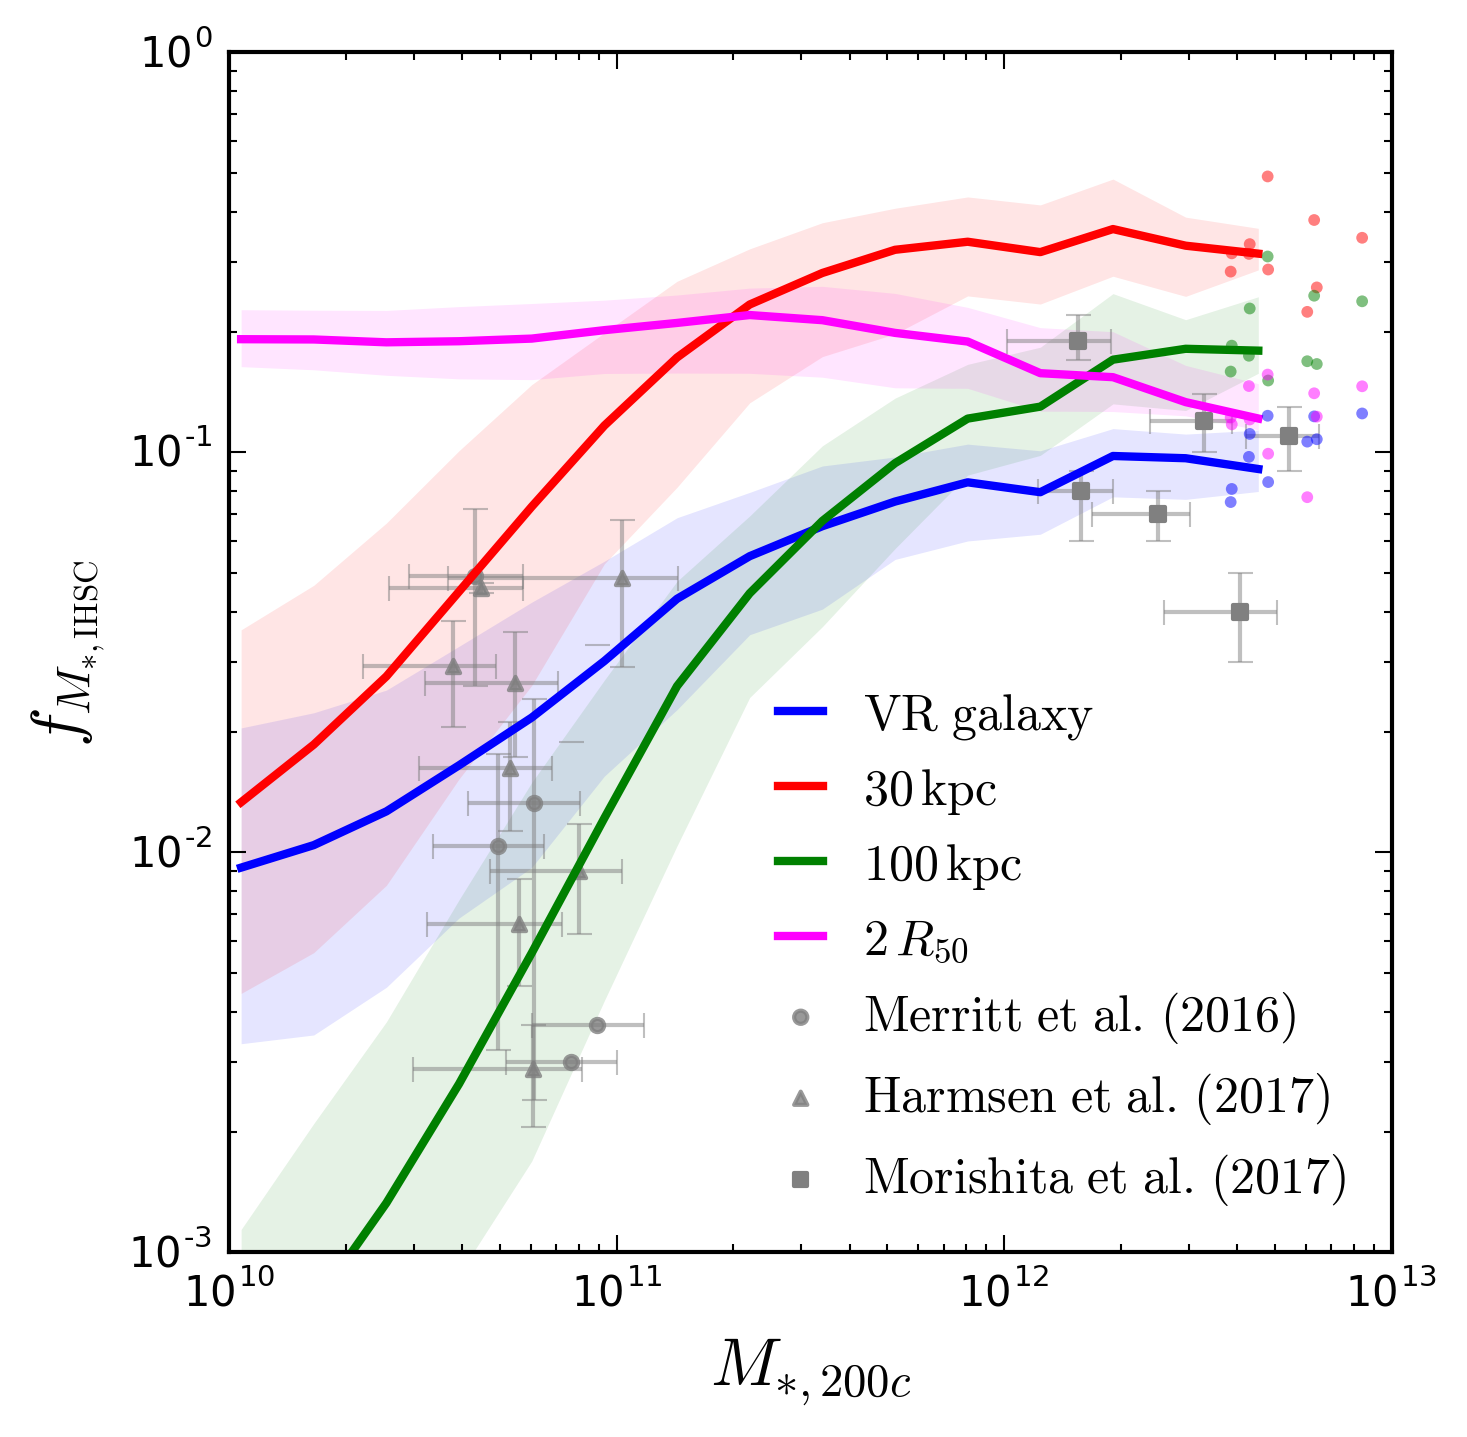
As mentioned above, for simplicity and ease of comparison, studies in the literature have used geometrical definitions of the IHSC. In Fig. 6, we compare the obtained with our method to that of spherical apertures with . To properly compare the methods we show the as a function of the total stellar mass within , i.e. . A visual representation and a comparison of the mass content with these definitions is shown in Appendix A. Observations are shown for reference. At Milky Way scales, i.e. , overestimates the , as the median of their distribution goes through the galaxies with the highest of the observed sample; the 30 kpc aperture median is in slight better agreement, while the 100 kpc aperture underestimates the at these masses. At the high mass both fixed apertures overestimate the compared to the estimated from the Frontier Field clusters, while is in better agreement with these measurements. Only our method is capable of predicting IHSC mass fractions that are in agreement with observations in a wide range of masses because it offers an adaptive, physically motivated, shape-independent and consistent definition of the IHSC throughout the mass range, representing a considerable advantage over previous studies.
4 Unveiling the nature of the relation
One of the aims of this study is to understand the origin of the scatter observed in the relation (e.g. Merritt et al., 2016; Harmsen et al., 2017). In this section, we explore how the mass fraction in the IHSC, , correlates with observables, specifically with those that relate directly to environment and accretion history. We remind the reader that throughout this paper we refer to a ‘system’ as the ensemble of components in a 3DFOF object, composed of a central galaxy, satellites, and its IHSC. Here, we focus on static properties of systems, i.e. properties that can be measured at a fixed time-step, to provide guidance on possible third parameters that could be explored in observations that would help to interpret the observed scatter. All the measurements presented in this Section are done at ; in subsequent sections we will focus on their temporal evolution.
4.1 Number of satellites
As the IHSC is built from the tidal debris of orbiting satellites and mergers, we expect that the mass in the IHSC should correlate with the accretion history of a halo, as well as with the availability of material that can be deposited into the IHSC. In Fig. 7 we show the relation for sub-samples according to the current number of satellites, , as identified by velociraptor.
Overall, more massive systems tend to have a higher number of satellites, as expected from hierarchical growth. However, in the range in which there is overlap between the samples with different number of satellites, we see that a system with a larger total number of satellites display a higher at fixed . Although the scatter around the relation in each sub-sample is large, the correlation between and is noticeable at , in which the distribution of three subsamples of different overlap. However, the regions are typically large enough that they overlap, and hence a point in the plane cannot be robustly associated with a single value of .
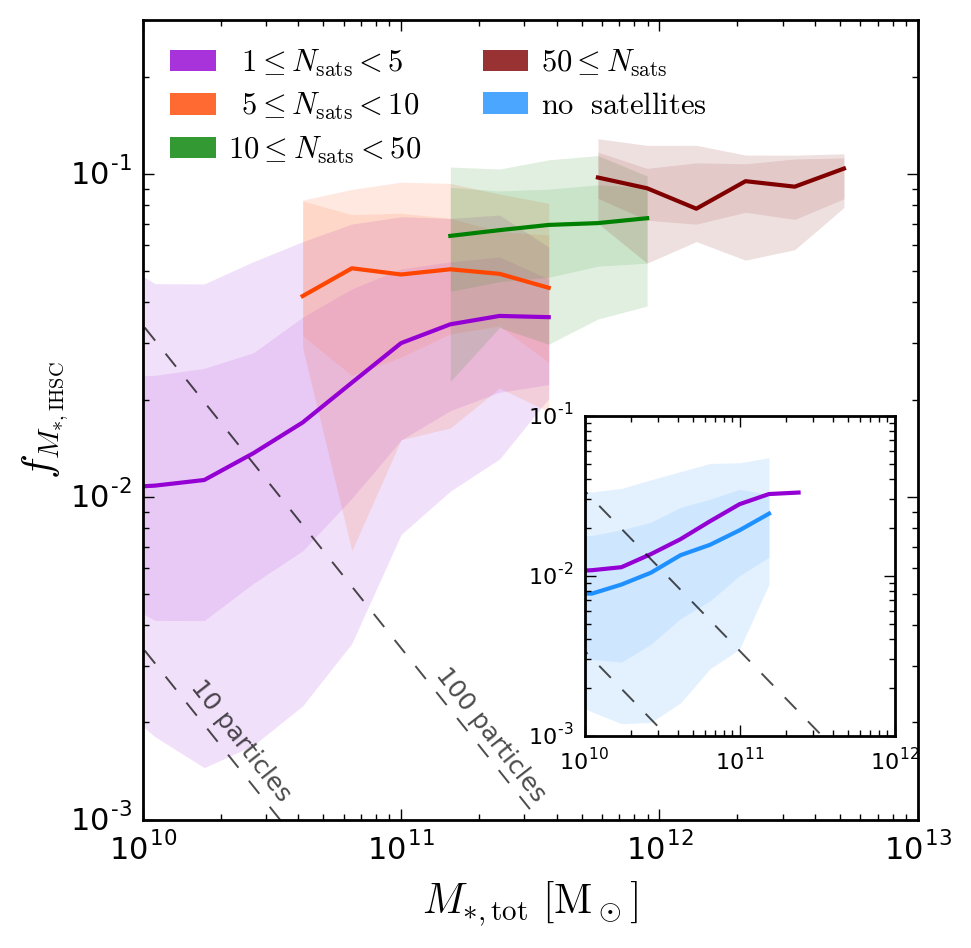
It is important to note that for lower masses and less populated systems, the scatter is quite large, dex ( dex) for (). This can be caused by a variety of factors. For example, at fixed a system with only one satellite that has just accreted is likely to have a very different than another one-satellite system in which the satellite has had enough time to interact with the central galaxy, and therefore deposit material into the IHSC. In fact, after only one orbit, an average subhalo is expected to lose % of its infall mass after its first peri-centric passage, and up to % after its second (Poulton et al. in prep). For this reason, we expect to be within a given sub-sample’s scatter in the relation. Moreover, a system without satellites could have a quiescent accretion history, or its satellites may have already merged with the central galaxy. This possibility can be seen in the inset where the distribution of systems without satellites is shown; although the overall amplitude of is lower than we see in the sample, both the medians and the size of scatter are comparable, almost overlapping.
If we repeat the exercise of Fig. 7 but limit it to satellites above (which is a typical value adopted to avoid resolution effects; see e.g. Dubois et al., 2016), we find that the relation between and prevails, but becomes weaker. If we limit ourselves to only the massive satellites, , we find no dependence of the scatter of the on . This is not necessarily surprising because the dynamical friction timescale of massive galaxies is much shorter than low mass ones, and hence the current number of massive satellites is not necessarily a good indication of the overall assembly history of a system.
4.2 Dynamical State
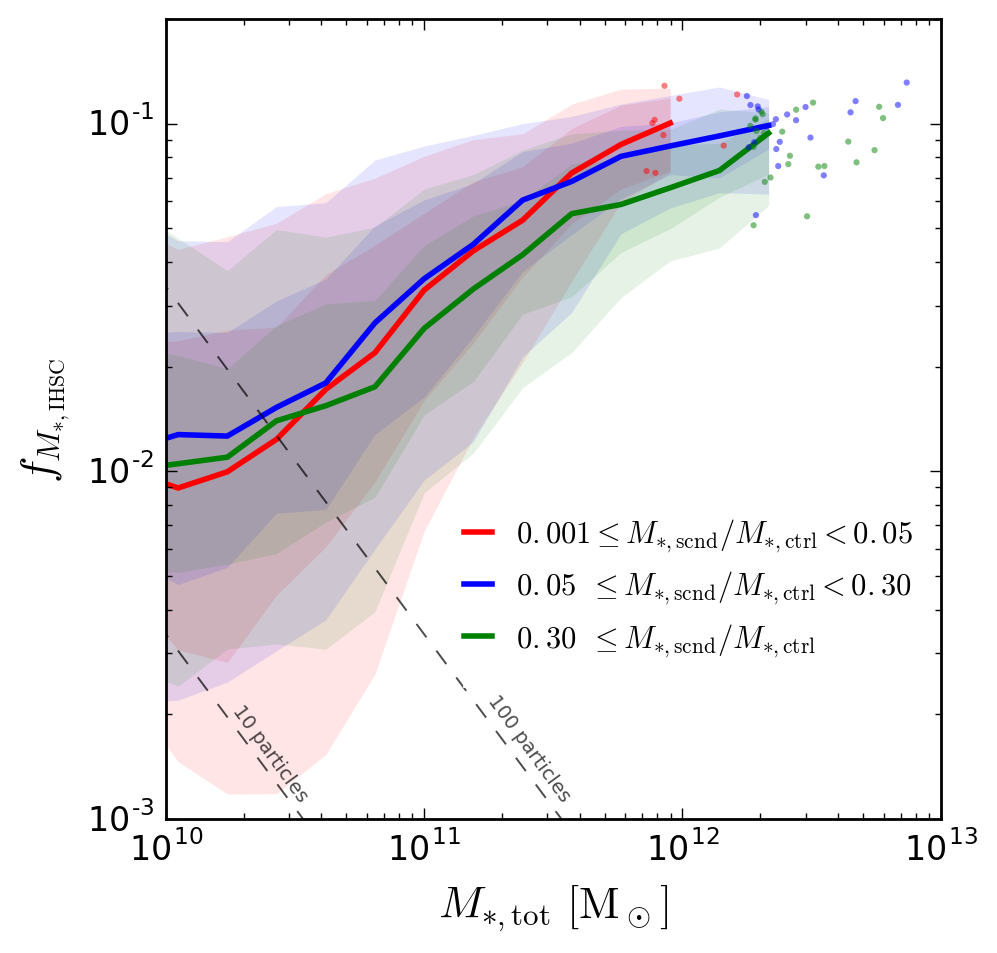
While the abundance of substructures give information about the environment of a system, there is no evolutionary information that can be obtained by a satellite count. Because the IHSC is built from disrupted material from ongoing and past interactions between galaxies, as mentioned above, the expected of a system is likely to be different at the time a satellite has just been accreted compared to a later epoch when interactions have already taken place and mass has been deposited into the IHSC. We explore this idea by using the ratio between the masses of the largest satellite (or second most massive galaxy), , and the central galaxy, , as a proxy for the dynamical age of a system. This definition is widely used in observations because it is readily accessible (e.g. Davies et al., 2019). As dynamical friction is more efficient on massive satellites, their orbits are expected to decay more quickly than those of less massive satellites, and they will have more signficant interactions with the central galaxy more quickly than less massive substructures; this suggests that a higher should indicate that the system is young, and debris from interactions are yet to be deposited into the IHSC. On the other hand, smaller are typically associated with dynamically old systems, indicating that interactions with larger satellites might have already occurred, and mass has been deposited onto the IHSC.
In Fig. 8 we show the relation for sub-samples of different ; using mass ratios of , and , which mimic commonly adopted thresholds to classify mergers as mini, minor and major, respectively. At we find that the three samples of have similar medians as well as 1 and 2 contours. It is only at that we start to see the expected dependence of a higher as decreases at fixed . The fact that disentangles the distributions only at larger is because mergers are the principal mechanisms through which these systems grow (see for example Oser et al. 2010,Dubois et al. 2016 and Rodriguez-Gomez et al. 2016 for simulations, and Robotham et al. 2014 for observational evidence). While these results are indicative, stronger conclusions cannot be made because of the small number of systems with that can be resolved by the Horizon-AGN simulation box ( Mpc).
4.3 Kinematic Morphology
The internal properties of the central galaxy provide additional information about the accretion history of a system. Previous studies have found that galaxies with low are mostly formed by mergers (Dubois et al., 2013, 2016), particularly dry mergers (Lagos et al., 2018b). Although several routes can lead the formation of the so-called slow rotators (Naab et al., 2014), large cosmological hydrodynamical simulations have allowed the statistical inference of the dominant mechanism behind their formation (Penoyre et al., 2017; Lagos et al., 2018b). Therefore, we expect that kinematic morphology gives us an indication of the merger history of the galaxy. Here, we use the kinematic morphology of the central galaxy as an indicator of the accretion history experienced by a system. We note that for Horizon-AGN galaxies does indeed reflect the properties expected for a galaxy given its visual morphology; see for instance figure 2 of Dubois et al. (2016)444Note that although the exact way of calculating for this study differs from that of Dubois et al. (2016), low (high) values correspond to spheroidal (disc) dominated galaxies for both methods..
In Fig. 9 we show the relation, separating systems into sub-samples according to the of their central galaxy, as labelled. At all masses, systems with high host a highly dispersion-supported galaxy, while a lower corresponds to systems hosting a rotationally-supported galaxy. There is a clear distinction between different sub-samples as their medians do not overlap or cross each other; moreover, there is a gradual transition between sub-samples from low and high , to high and low . These results are consistent with the notion that rotationally supported galaxies should have had quiescent accretion histories, and consequently lower . Lagos et al. (2018b) found that the highest galaxies can only be obtained in the absence of mergers. On the other hand, a dispersion-supported galaxy is expected to have experienced multiple mergers and interactions, which in turn should deposit higher amounts of mass into the IHSC, increasing its .
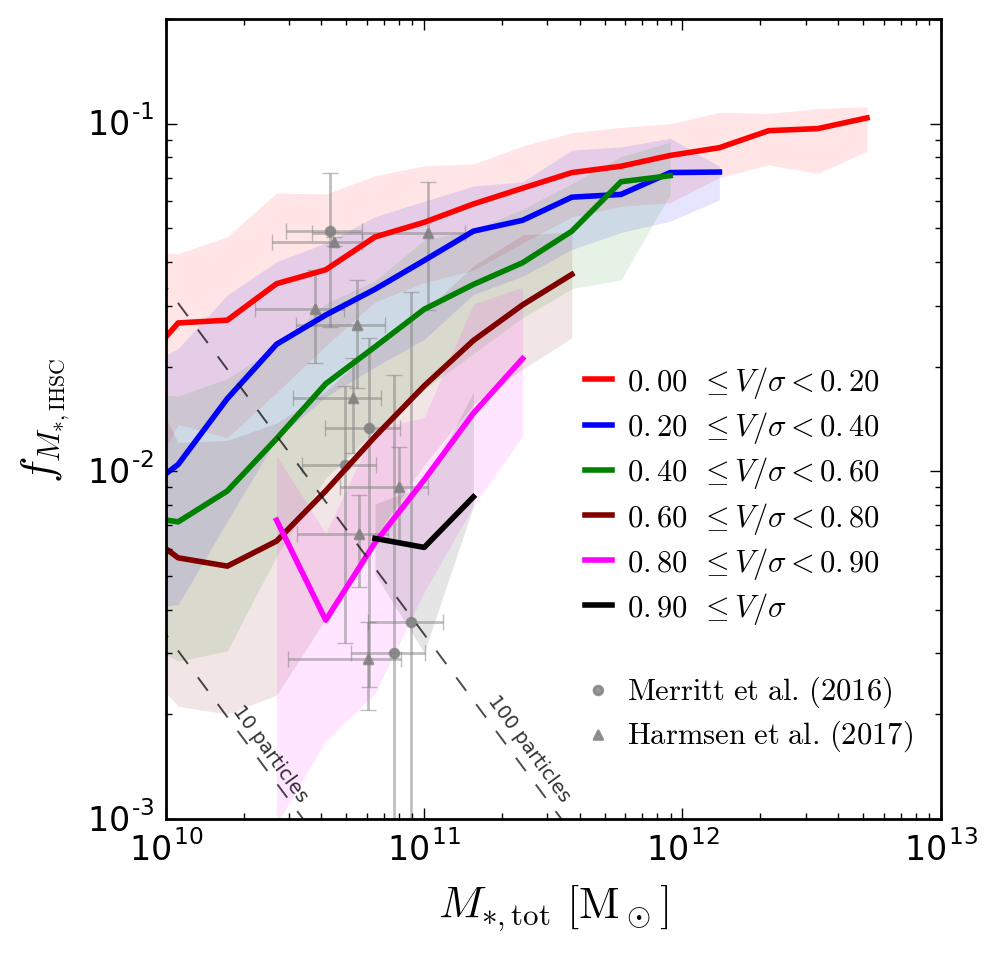
We find that the strongest correlation displayed by the kinematic morphology of the central galaxy is with the scatter of the relation at . This may be surprising because other parameters studied here are typically used in observations to separate dynamically young and old systems. This means that, in Horizon-AGN, kinematic morphology is the best indicator of how the IHSC was built up. Previous simulation results suggest that the IHSC could be easily built up by dry mergers, because the mass of satellites is preferentially deposited in the outskirts (see e.g. Lagos et al., 2018a). This, combined with the fact that simulations predict dry mergers to be the most effective way of producing slow rotators, may be the reason behind our findings. For higher masses, the dynamical state of the system gives us a handle on the scatter in a way that morphology cannot, because at all the centrals are mainly supported by dispersion. Note that there is a difference between the calculated (which uses the 3D velocity information of galaxies) with what is recovered from a 2D projection of that information. This is partly due to inclination and partly due to limitations in resolution in observations that affect the inferred velocity dispersion in observations (see van de Sande et al. 2019 for a detailed analysis of how hydrodynamical simulations compare to IFU surveys).
In recent work Elias et al. (2018) found an anti-correlation between the mass fraction in the stellar halo and the morphology parameter in the Illustris simulation. While in principle this is consistent with the anti-correlation observed in Fig. 9, we argue that these are not completely equivalent because of the spherical aperture of (magenta line in Fig. 6) used to separate the stellar halo. This definition not only overestimates the IHSC/stellar halo at Milky Way masses, but also fails to reproduce the observed scatter. Consequently the scatter at fixed is comparable to that of the entire population.
We can, in principle, connect this result with those found in recent observations by Merritt et al. (2016) and Harmsen et al. (2017) (shown as symbols in Fig. 9), who, using different observational techniques, found that the estimated for Milky Way-like galaxies can vary up to 2 dex in a similar mass range. Because of their disc morphology, we would expect all the galaxies in these studies to have a high , and consequently a low according to the behaviour observed in our results. However, their location in the relation overlaps with the entire simulated population, even for simulated galaxies mainly supported by dispersion. While this can be in conflict with the trend observed in our measurements, we have to take into account that the observational data do not include ellipsoidal galaxies which are needed to test if the correlation is displayed by observations. The ‘tension’ can be alleviated by shifting the relation measured from the simulation towards higher values, which can be achieved by using a different choice of , as shown in Section 3.1; however, this would then introduce a conflict with estimated mass fraction in the ICL, and would also reduce the extent and mass of the galaxies (see Section 3.1, and appendix A of Cañas et al. 2019). Another factor that comes into play is the uncertainty in the measurements as well as the scatter that individual sub-samples have; of contours of consecutive sub-samples overlap and contours as large as dex, indicating that, although unlikely, a galaxy with high can high as well, and vice-versa.
4.4 Specific star formation rate
We have shown that can be used to estimate the mass fraction in the IHSC. However, observational estimates of this parameter require expensive spectroscopic observations, and while surveys such as MaNGA (Drory et al., 2015), CALIFA (Sánchez et al., 2011), and SAMI (Croom et al., 2012) have been capable of estimating kinematic properties of thousands of galaxies, there are no estimates of the IHSC of these galaxies to date. Here we explore a possible correlation between specific star formation rate (sSFR) of the central galaxy and the . Star formation rate and of a galaxy are strongly correlated, and it is easier to estimate sSFR from observations that will be readily accessible via SED fitting to a survey such as LSST (Robertson et al., 2017).
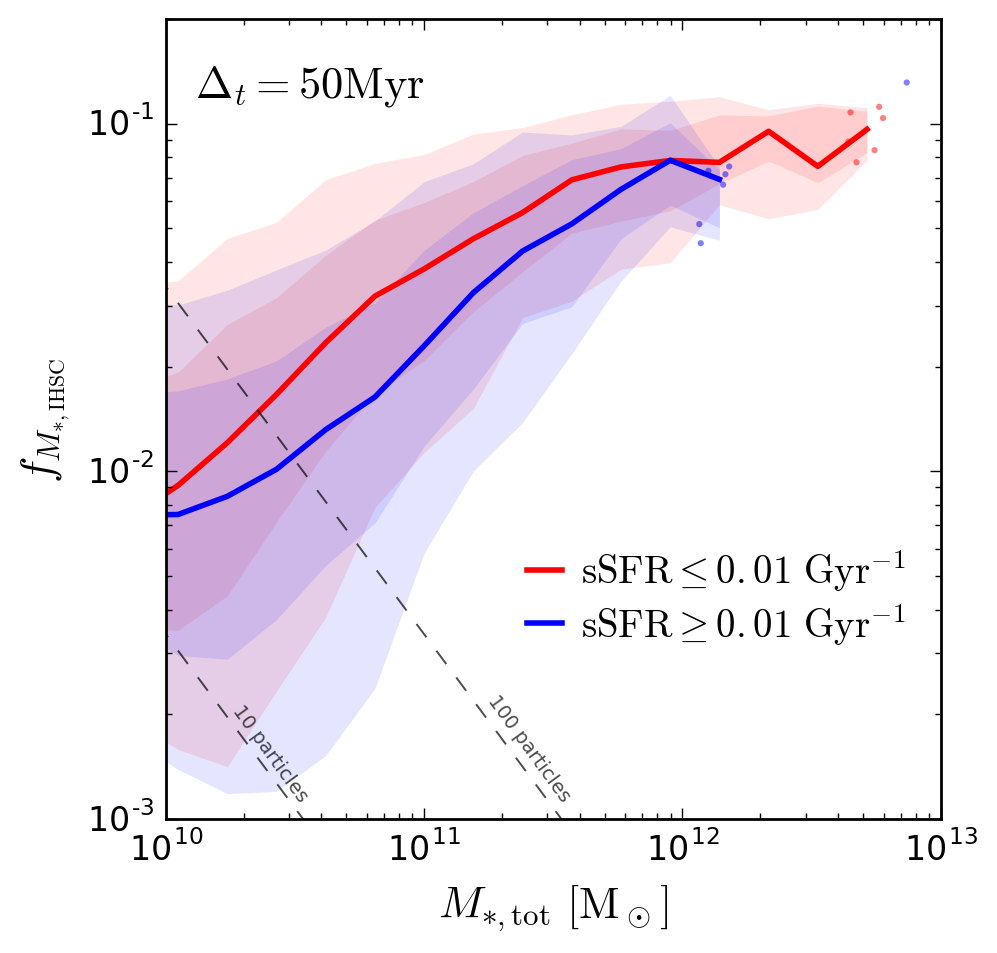
In Fig. 10 we show the relation for sub-samples of sSFR. Although the median of each sub-sample indicates that there is anti-correlation between the sSFR and , the scatter observed is quite large. A larger number of sub-samples shows a similar behaviour; because of highly overlapping distributions, we only show two sub-samples that are most distinct for clarity. We repeated this calculation using bins in SFR instead of sSFR, and found similar results. The observed behaviour is a consequence of several factors. One is the way in which we estimate the SFR; by using only stellar particles to determine the SFR, it is likely that our estimate is affected by particle discreteness and mass resolution, because we cannot measure SFR below one stellar particle formed in the used. Another is that spheroidal and disk galaxies of similar masses can have similar SFRs; this can arise if star formation quenching occurs because of feedback or because the available reservoir of gas has been exhausted. We note that while the exact values of and sSFR change from simulation to simulation, all simulations tend to predict qualitatively similar relations between sSFR- (Somerville & Davé, 2015) and vs. (van de Sande et al., 2019).
4.5 Two distinct regimes for the IHSC and observational prospects in the local Universe.
Our results suggest that there are two broad, distinct, populations of halos, with a transition at . At , properties of central galaxies are highly correlated with , with more dispersion dominated galaxies being a strong indicator for high . Weaker correlations are seen with star formation activity, likely rising from the more fundamental correlation with . Halo properties at these masses do not seem to be good indicators of the overall . At a very different picture emerges. All centrals at these masses are similar: they have little star formation activity and are dispersion dominated, and so they offer little insight into the IHSC. Instead, the dynamical state of the correlations studied are readily available in the observations and hence offer a great opportunity to test our predictions. Moreover, observations have so far sampled only a handful of galaxies, which is insufficient to unveil a correlation like the one reported here. Surveys such as those possible with Hyper-Suprime Cam (Miyazaki et al., 2012) and LSST (Robertson et al., 2017) are likely to change this, because their deep photometry over half the sky will provide the required statistics and data quality.
5 Temporal evolution of the IHSC
So far we have studied the mass content in the IHSC and how it correlates with observable properties of its system at . We have, however, not yet explored the temporal information available from the simulation. In this section, we explore the evolution of the of the entire Horizon-AGN population with the aim of understanding how different regions of the plane are populated as a function of time. Additionally, we study the evolution of systems of interest, specifically galaxy clusters and Milky Way-mass systems, using their individual evolutionary paths.
5.1 Individual paths
In this section we follow the evolution of individual systems through cosmic time by tracking their location in the plane. We focus on three sets of objects of interest: Milky Way-mass systems with low and high and galaxy clusters.
We follow the evolution of each system by tracking its central galaxy across snapshots using treefrog (Poulton et al., 2018; Elahi et al., 2019b), a code that constructs merger trees for simulations. The progenitor of each galaxy is defined as the structure that shares most of its particles in the previous snapshot. This is found by comparing IDs of the stellar particles, and computing a merit function
| (8) |
where and are the total number of particles in galaxies and respectively, and is the number of particles that exist in both structures. The main progenitor is chosen to be the one with the highest . Systems are traced by following the main progenitors of the system’s most massive galaxy at , i.e. the one with the highest merit.
To understand the evolutionary paths, we first note that horizontal displacements in the plane tend to be towards higher increments, which can either be caused by the accretion of systems or by the creation of new stars from gas accreted on an already existing Interstellar Medium (ISM); negative horizontal displacements are infrequent, and are caused by other galaxies or systems ‘flying by’. Vertical positive displacements correspond to mass being deposited from galaxies in the system (either central or satellites) into the IHSC. Negative vertical displacements result from either increments in for a fixed , or the ‘re-capture’ of particles from the IHSC to galaxies at fixed .
5.1.1 Milky Way-mass - Low
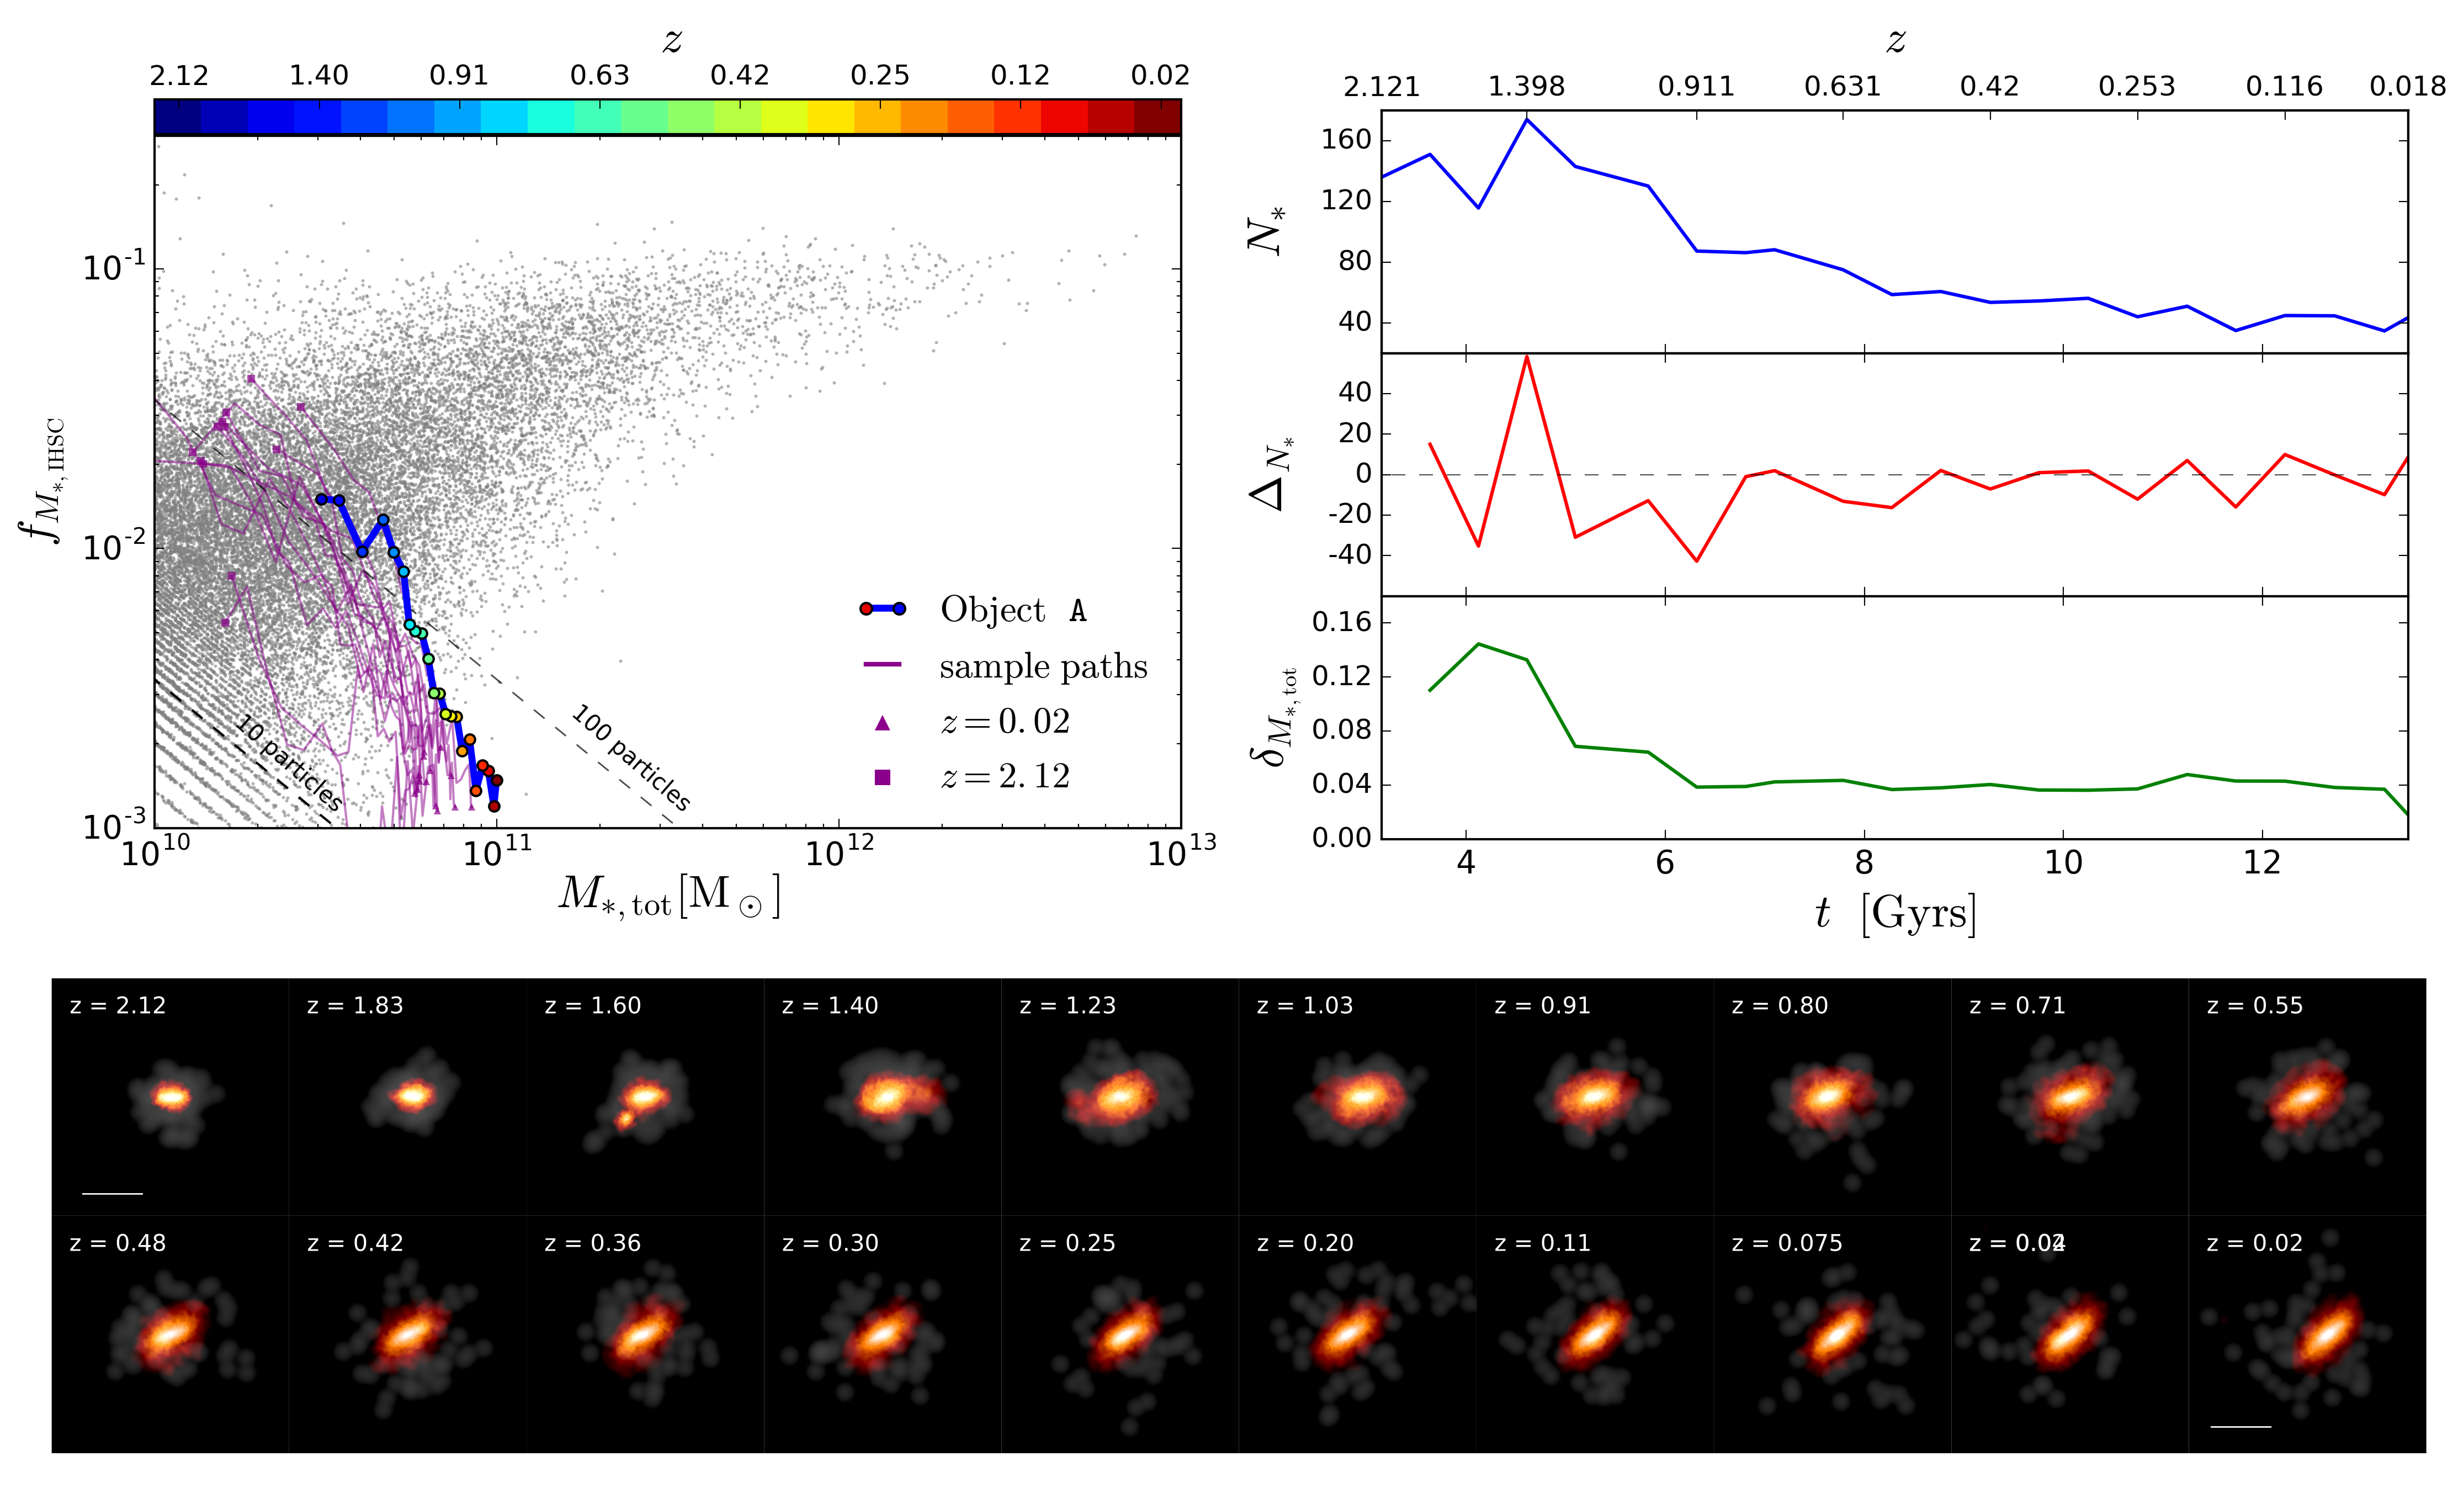
In Fig. 11 we show the evolutionary paths in the plane for a sample of systems with and at . At (magenta squares) these systems have total stellar masses between and , and a . Their evolution is mainly characterised by displacements towards higher and lower . We highlight the evolution of object A (see Section 2.2.3) shown as a thick blue line, coloured symbols indicate its location in the plane at different redshifts, as labelled; in the bottom panels we show the projected stellar density of the IHSC in grey, and the stellar mass in galaxies particles in red555Note that the colour intensity differs for the IHSC and for galaxies. This is done to better highlight the IHSC, which tends to have a low number of particles. For comparison, the visualization of Fig. 1 has the same colour and intensity palette for both components..
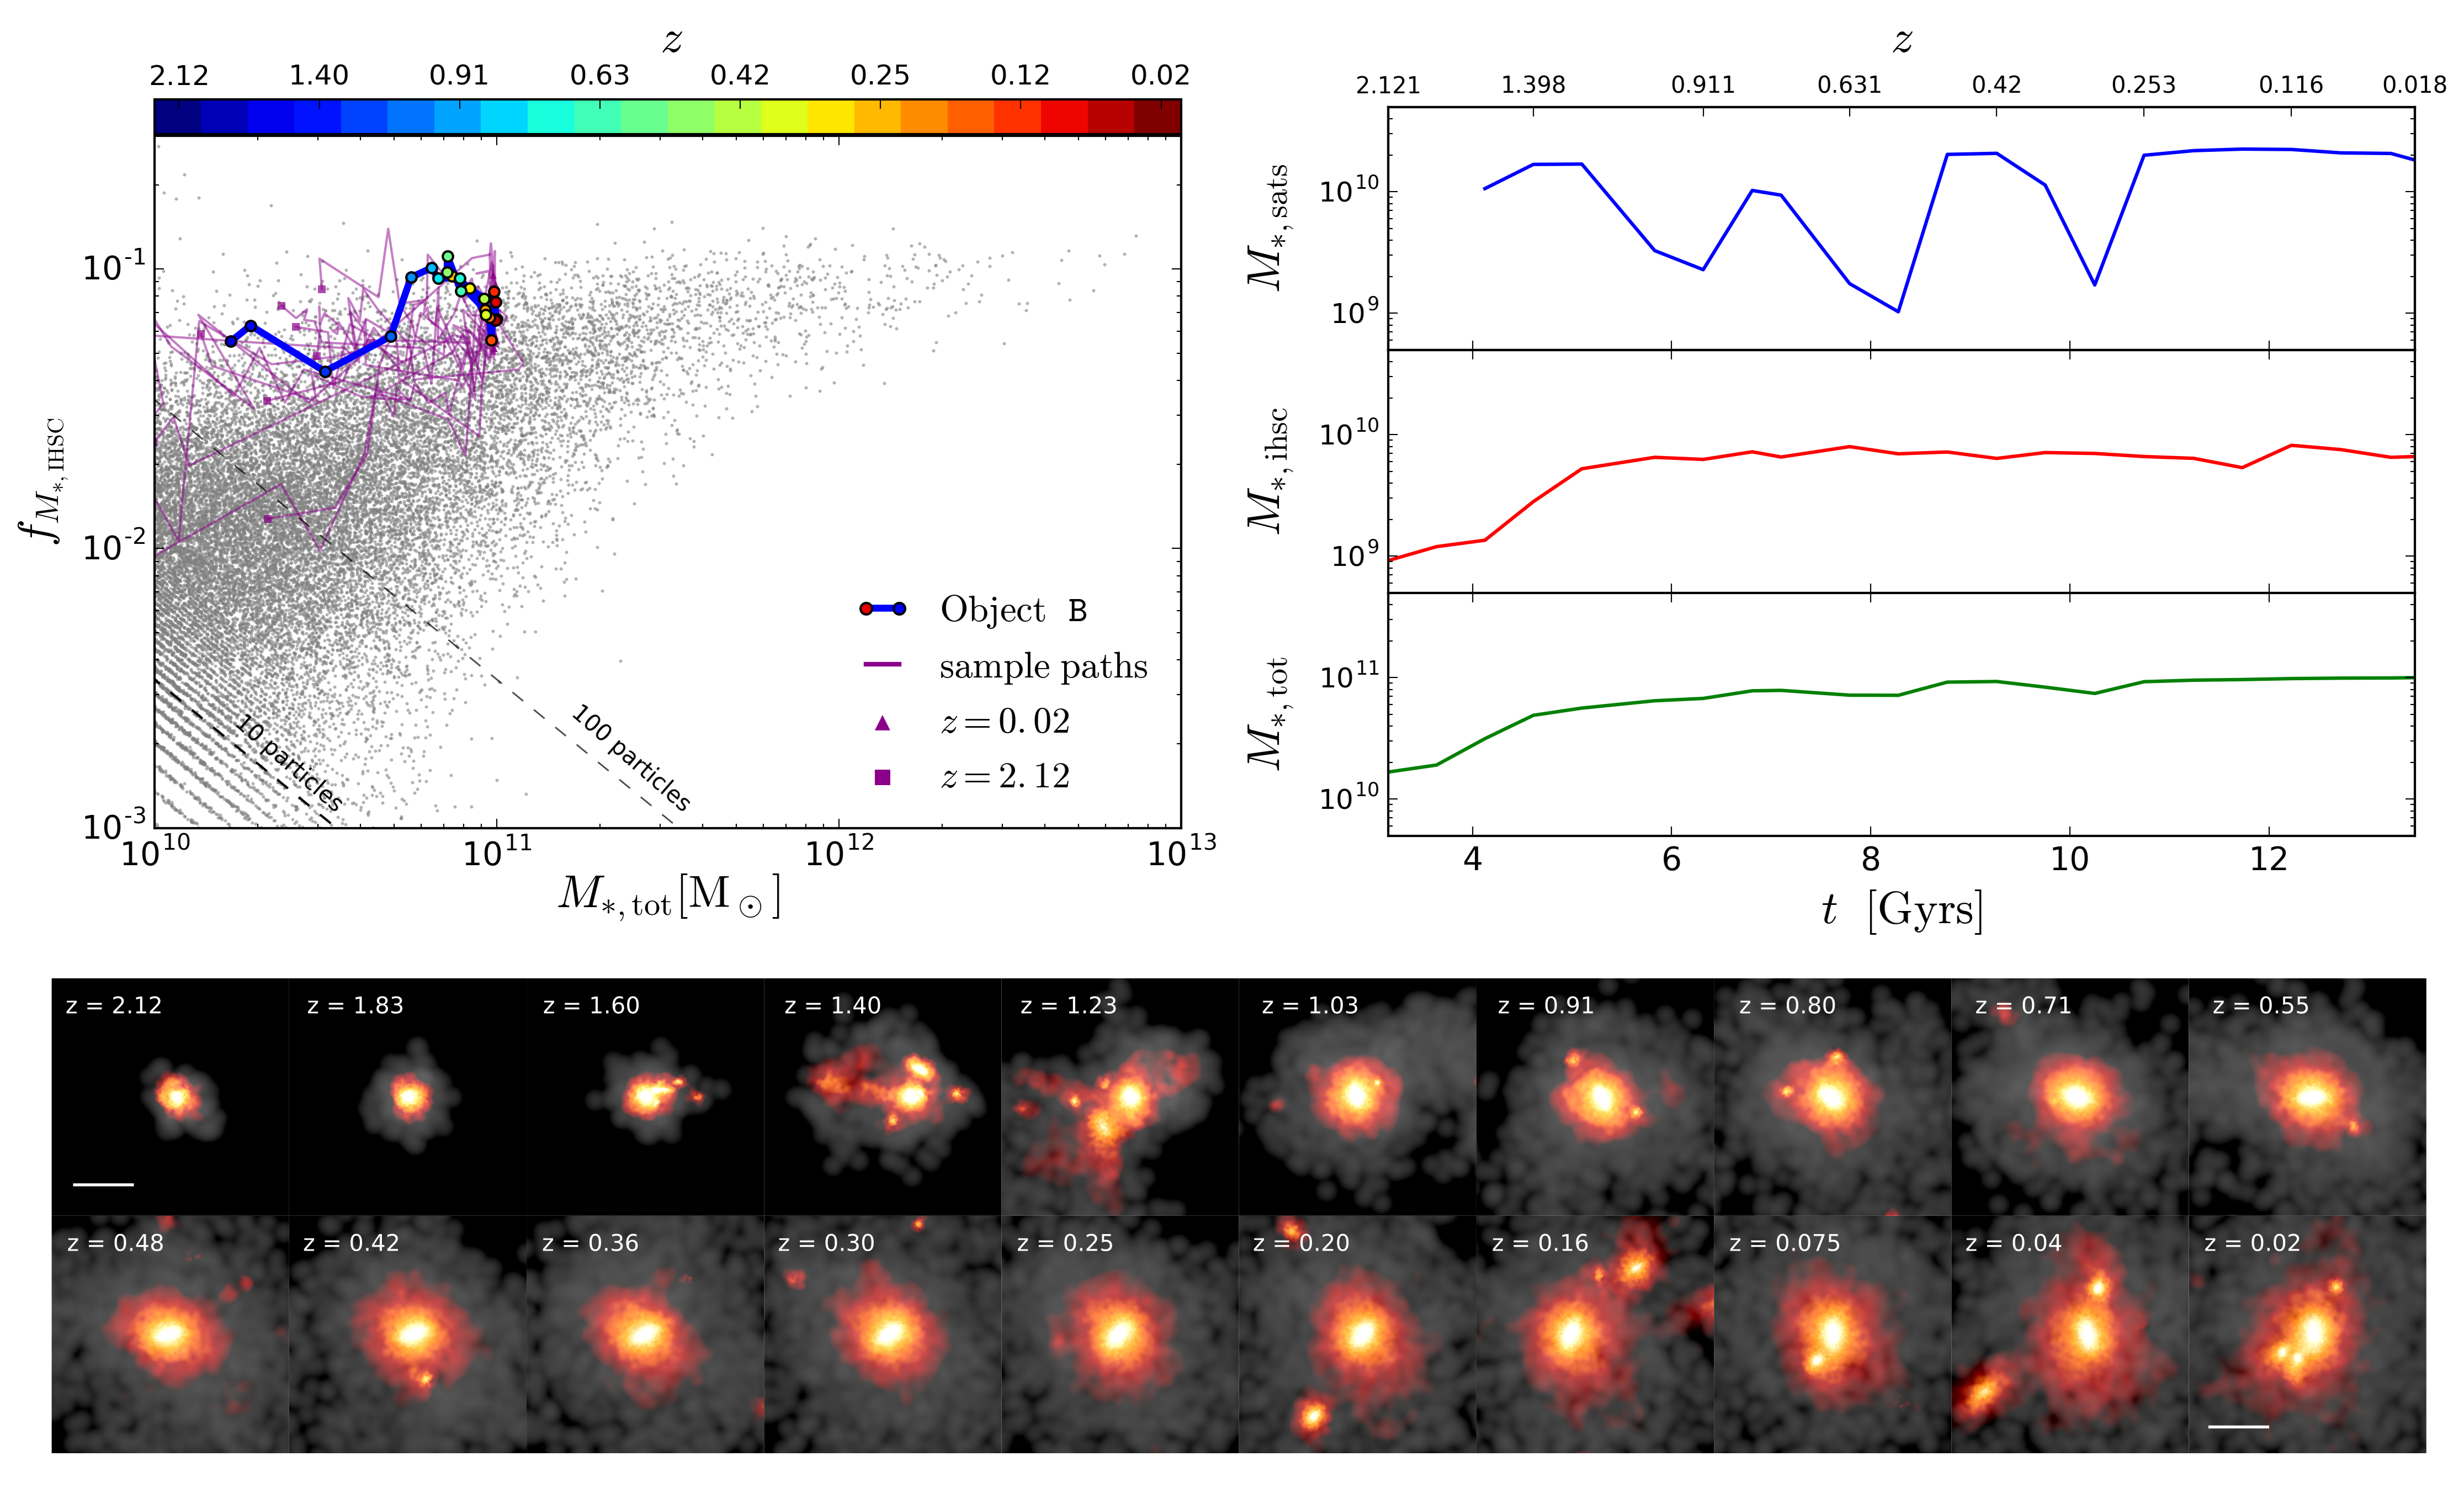
This system starts with , decreasing for a couple of snapshots before showing a sudden growth, followed by a monotonic decrease reaching . This behaviour is a consequence of the interaction between an infalling satellite with the central galaxy. At the dip in the track is caused by the accretion of the satellite which increases , as seen in (top right panels), without yet depositing material onto the IHSC. At a subsequent snapshot, the number of particles in the IHSC increases, as seen in and , due to the disruption of stellar material from the interaction, causing the bump in the track. At subsequent times, keeps decreasing up until , which is due to the decreasing number of particles in the IHSC, and an ongoing increment of , i.e. positive values of , due to continuing star formation in the galaxy. The decreasing number of particles in the IHSC is also explained by mass being ‘re-accreted’ onto the galaxy from the IHSC as the system relaxes due to the particular orbit that the infalling satellite had. This is in agreement with Peñarrubia et al. (2006) and more recently Karademir et al. (2019), who have shown that stellar debris from the disruption of galaxies on orbits close to the plane of the disk are expected to relax into an extended rotating disk; this extended disk would therefore occupy a similar region in phase-space and therefore be assigned to the galaxy in our method. Finally, we note that the bumps displayed by all systems at later times are caused by the low number of particles that compose the IHSC, as is shown by . All of the other highlighted galaxies in magenta show a similar behaviour, interacting with a single satellite and continuous star formation activity in the central.
5.1.2 Milky Way-mass - High
In Fig. 12 we show evolutionary paths of systems with and high at . The paths that these galaxies display in the plane are characterised by large displacements and variations in the , a consequence of the interactions that these systems experience. Contrary to the low cases, these systems show a large variety of paths across cosmic time, due to the diversity of accretion histories. This is seen in the visualization of the highlighted path (bottom panels), as well as the evolution of the mass in satellites, (top right panels), where bumps across time represent the infall (peaks) and disruption (valleys) of satellites. These multiple interactions experienced by the central galaxy at different times result in a higher mass fraction in the IHSC. For comparison, the spatial scale and colour schemes of the projections is the same as for the low case in Fig. 11. These results are consistent with the relation observed between the of a system and of its central galaxy. Moreover, these results demonstrate the robustness of our method, and highlight the advantage of defining the IHSC as the kinematically hot component in each system.
5.1.3 Galaxy Clusters
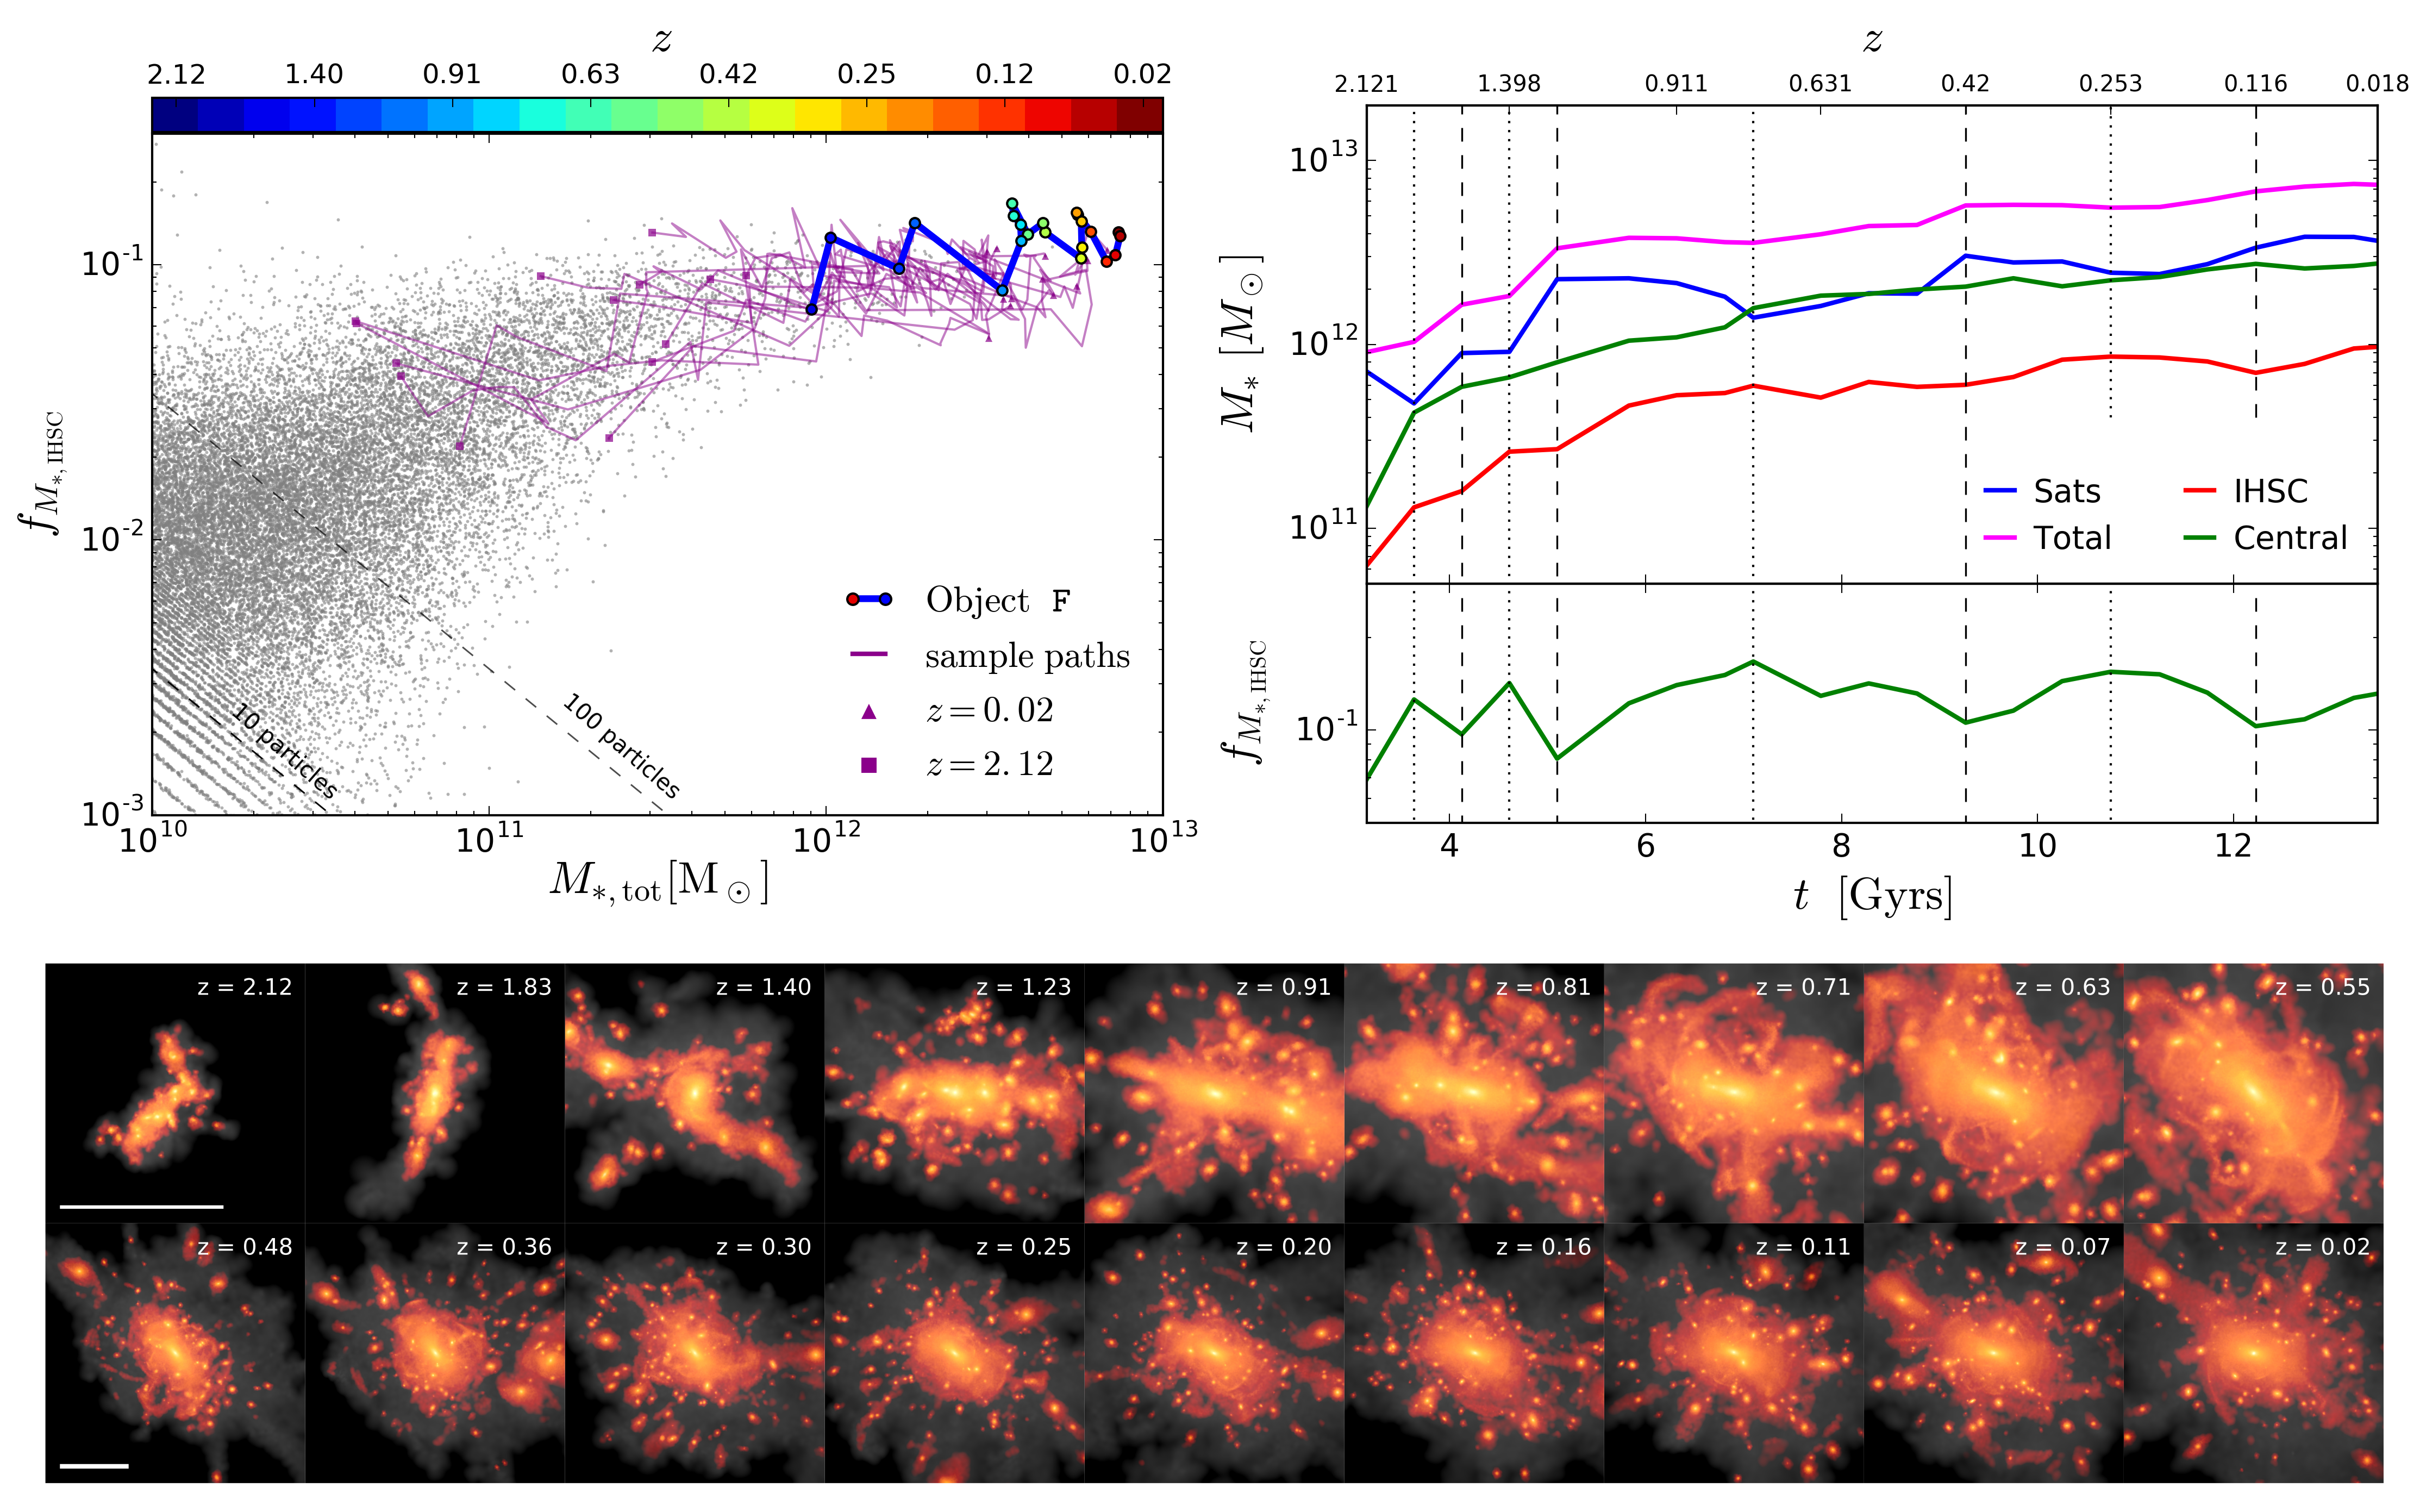
In the top panel of Fig. 13, we show evolutionary paths in the plane of systems with at , all of which have (magenta triangles). These objects display a variety of locations in the plane at (magenta squares), differing by dex in both and for this particular sample. Regardless of their initial location, all systems move towards higher with time and display a series of peaks and valleys in the plane throughout their evolution, a consequence of the multiple interactions that drive the growth of these systems. For systems that at have a high , the displacements are on average horizontal through cosmic time, as shown by the highlighted case. Systems that start with low and show a tendency to move towards increasing and , until reaching where the displacements become on average horizontal.
While for Milky Way-mass systems this evolution can be described by the accretion of satellites onto a dominant central galaxy, for groups and clusters this evolution is more complex, because they grow mainly by accretion of entire smaller groups and clusters. These infalling systems carry with them their own IHSC, which after accretion is added to the IHSC of the larger system. During these events the total is not expected to increase, simply because of how mass fractions add; for example, a cluster with an initial IHSC mass fraction of 10% that accretes a group whose is 10%, will have, post-accretion, the same mass fraction in the IHSC. Displacements towards higher can therefore only arise because mass is disrupted from galaxies and transferred to the IHSC. On average, systems describe horizontal paths because of the interplay between the disruption timescales of the galaxies already in the cluster and the accretion timescale of other clusters.
Overall these results indicate that, for systems with , there is no apparent correlation between and , and there should be no strong evolution of with time. The lack of evolution of with time is consistent with observational results of Krick & Bernstein (2007), who found no trend between ICL fraction and cluster mass for a sample of Abell clusters, and a weak or nonexistent evolution across redshifts. This has also been noted more recently by Montes & Trujillo (2018), using data from the Hubble Frontier Fields. In previous theoretical studies, Cui et al. (2014) found no correlation between cluster mass and the mass fraction in the ICL, using simulations that did not include AGN feedback and only when the ICL was defined using surface density thresholds. This was not observed however when AGN feedback was included, as well as when a dynamical definition of the ICL was used. This contradicts our results, and warrants further research at cluster masses. In a future paper we focus specifically on this regime using the Cluster-EAGLE (Bahé et al., 2017; Barnes et al., 2017) suite (Cañas et al. in prep.).
5.2 Galaxy population
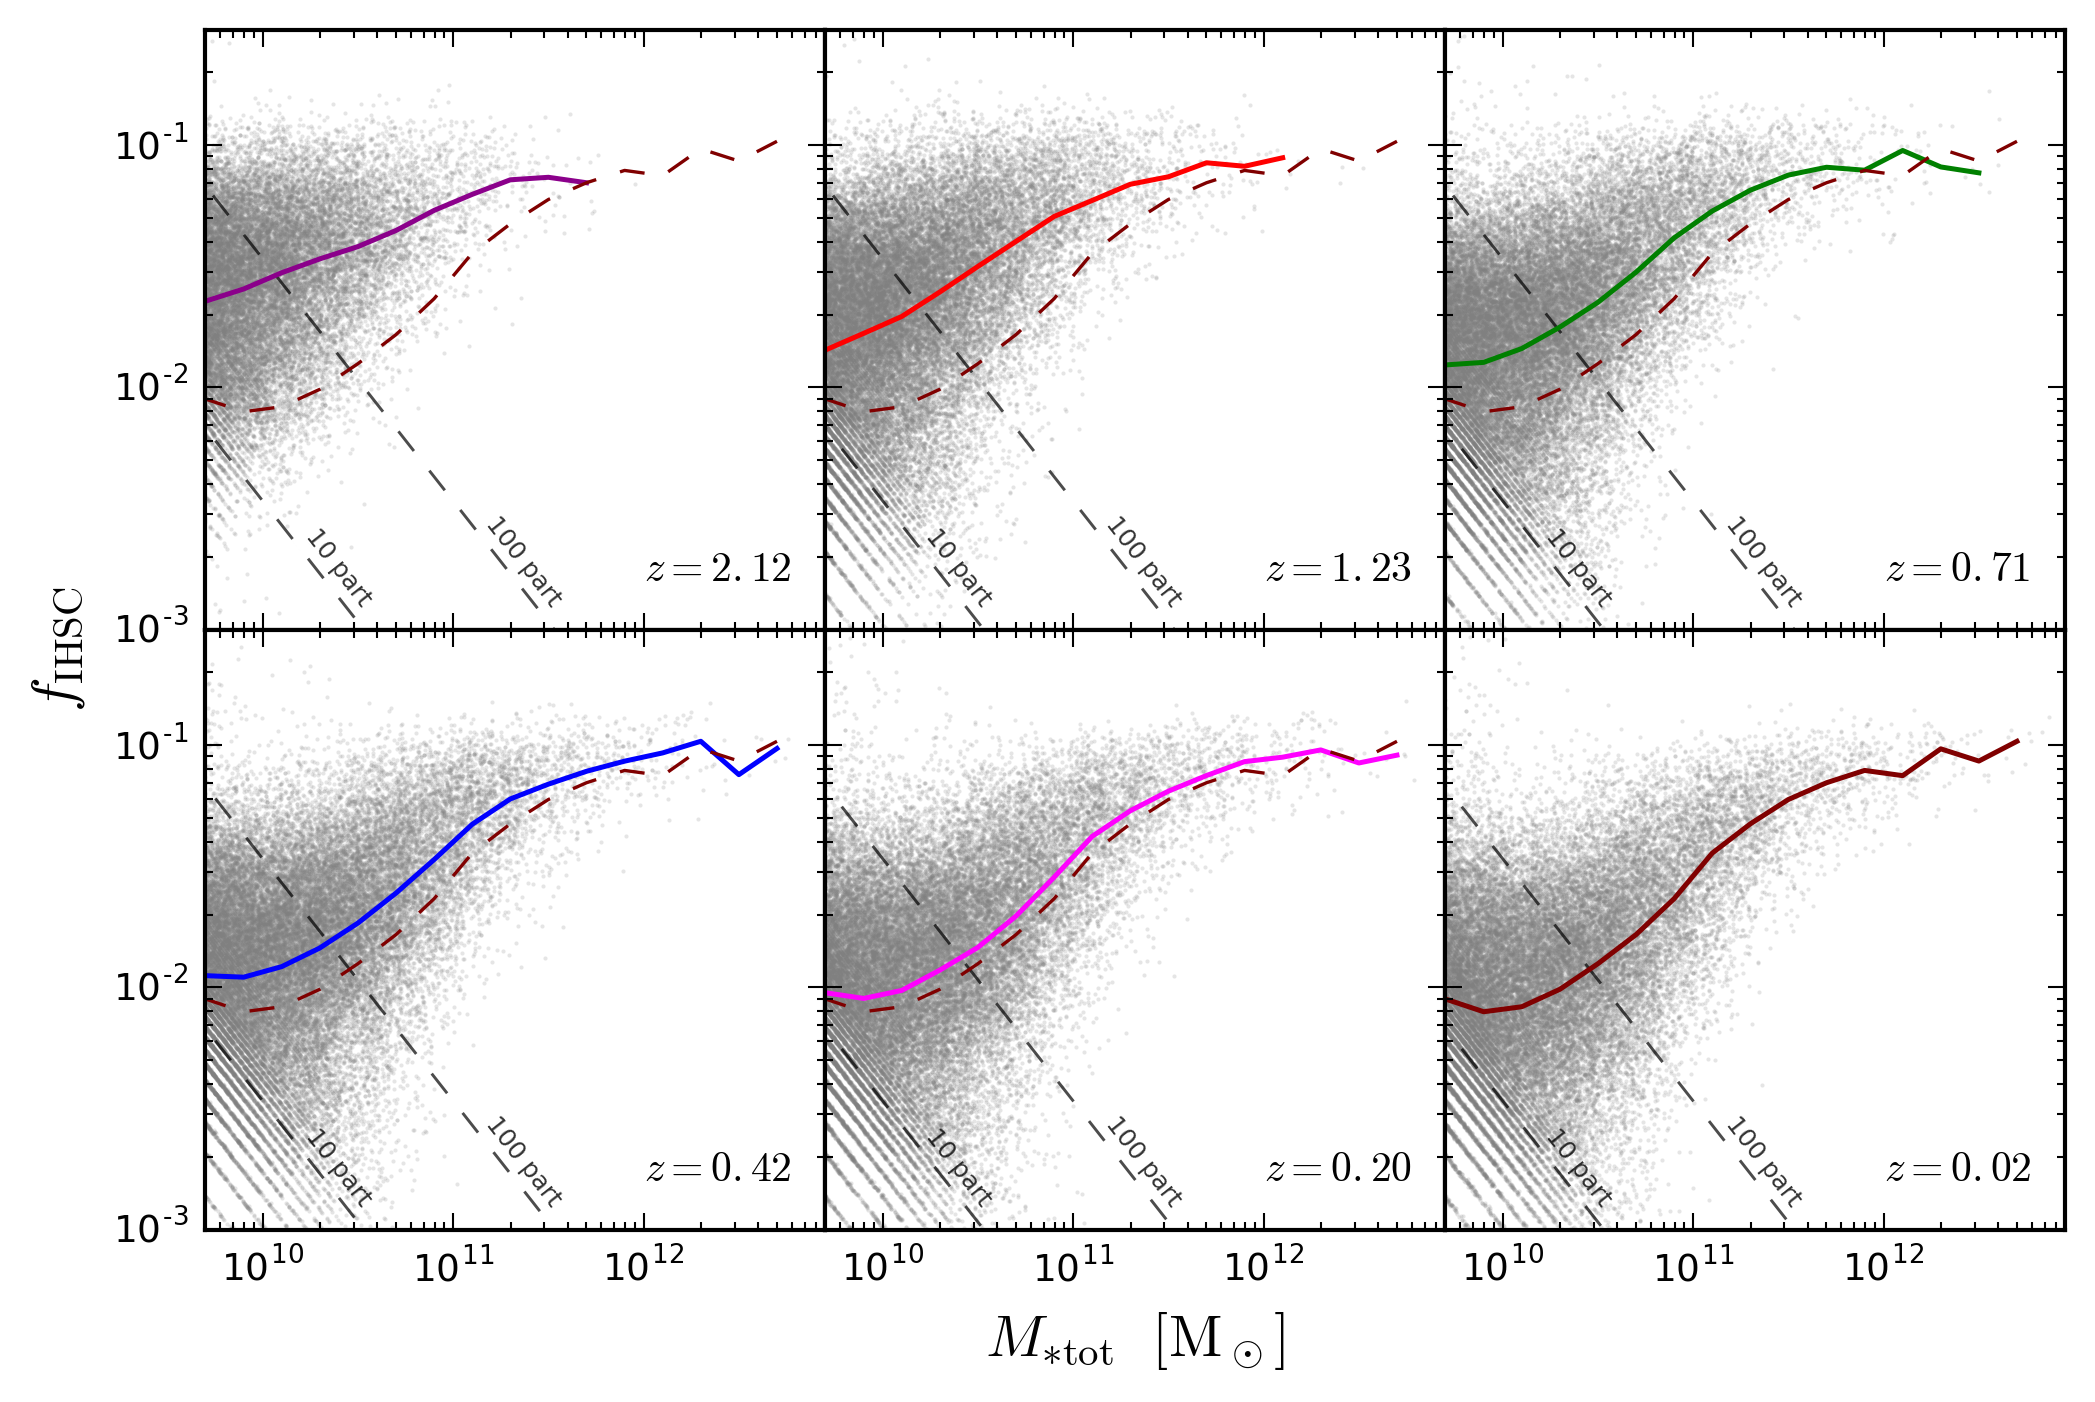
In Fig. 14 we show the temporal evolution of the relation from to . At the relation shows a mass dependence of the with up to , where the relation appears to flatten. At the scatter in the can be greater than 1 dex, and decreases with increasing . At subsequent redshifts the evolution is characterised by a shift of the relation towards higher , and is accompanied by a steepening of the mean for , as well as a stronger distinction between a mass dependence of the and a weaker or non-existent one at the high mass end. This steepening of the relation is partially caused by systems populating low regions at ever high , which, as seen in Section 5.1, correspond to systems that had a quiescent accretion history and whose IHSC ceased to grow. The other factor that causes this steepening is the horizontal displacement of systems with initially high , which also contribute to the flattening of the relation at
6 Summary and conclusions
We presented the first results of a new method to define the Intra-Halo Stellar Component (IHSC) in cosmological hydrodynamical simulations. This method relies on robust identification of galaxies using an adaptive phase space structure finder velociraptor (Cañas et al., 2019; Elahi et al., 2019a). The IHSC is then defined to be all the stellar material that is sufficiently distinct from galaxies in phase-space to be considered separate from them, i.e. a diffuse, kinematically hot stellar component. A critical feature of this method is the use of local properties of each system to separate the IHSC from the rest of the galaxies. This allows us to robustly define the IHSC from Milky Way mass systems up to galaxy groups and clusters, and consequently to consistently follow the assembly of the IHSC through cosmic time.
A novelty of this method is that it is capable of producing consistent relations between the stellar mass of the central galaxy, ; the IHSC, ; and satellites, , independently of the phase-space density thresholds used, determined by the search parameter . Modifying this parameter does not affect the shape of the relations, but only changes their zero-point. We argue that this feature allows the user to choose the value that better matches observations of given characteristics, e.g. surface-brightness limit, to make appropriate theoretical predictions.
We find that the increases with the system’s mass, on average, with the scatter being a strong function of the latter: low mass systems display variations of up to 2 orders of magnitude in their , while the scatter gets systematically smaller, being 0.3 dex at group masses.
We explored the nature of the scatter observed in the relation at Milky Way masses by looking for possible correlations between properties of systems that are easily accessible in observations and their :
- Number of satellites.
-
At , systems with higher are expected to have a higher at fixed , but at lower masses there is no evident correlation between with .
- Dynamical age.
-
In the case of , it is only at that this quantity is indicative of the in a system. At a fixed , dynamically younger systems with higher have lower than older, more dynamically relaxed ones.
- Kinematic morphology.
-
We found that is the parameter that most strongly (anti)correlates with at fixed mass in systems with . At Milky Way masses, we see a clear transition from low in systems with more rotationally supported galaxies, i.e. higher , to high for those with a central galaxy mainly supported by dispersion, low . This is consistent with the picture that dispersion-supported galaxies have a more active accretion history and therefore a larger amount of mass deposited into the IHSC; this is in comparison with disk galaxies, which have on average a more quiescent accretion history.
- Star formation rate.
-
At fixed , the SFR of the central galaxy can be indicative of the expected of the system, with lower in systems with more star forming central galaxies. However, there is not a continuous transition from low and high SFRs to high and low SFRs, as strong as we obtained for
Our method also allows us to follow the evolution and assembly of the IHSC through cosmic time for individual objects as well as for the entire galaxy population. We explored individual paths in the plane for cases of interest:
- Milky Way mass - low .
-
The evolution of these systems is characterised by smooth displacements towards higher and lower which are the result of the absence of accretion of satellites, the continuous formation of new stars from gas, and the relaxation of IHSC stars into the outskirts of the growing central galaxy.
- Milky Way mass - high
-
These galaxies display a variety of evolutionary paths in the plane. Contrary to low cases, these systems have different locations in the plane at , but finish with similar and at . Their paths are characterised by increments in the , which are a consequence of episodes of satellite accretion and interactions, that occur at different epochs for each system.
- Galaxy groups and clusters
-
The evolutionary paths of high-mass systems are characterised by a series of increments and decrements in the . While for Milky Way mass systems the evolution of these features are attributed to the accretion and disruption of individual satellites, for groups and clusters such features are caused by the accretion of smaller groups/clusters and the disruption of all the members within those structures. Overall these systems display increasing with time until they reach a and %, from where the evolution indicates to be weak or nonexistent due to the interplay between group accretion episodes, which decreases , and disruptions of individual galaxies that increase it.
The evolution of the galaxy population is characterised by a steepening of the median at , which is caused by galaxies with at high redshifts that subsequently have a quiescent accretion history, populating the low region in increasing numbers as time goes by. For , the population evolution shows a mild to neglible increment in the . For our preferred 6D finder parameters, the appears to peak around %, however such value changes depend on the phase space density cut used.
Overall, the scatter displayed by the relation is driven by the large diversity in accretion histories that galaxies can experience. The difference in the scatter observed at Milky Way-masses and at groups and cluster scales is mainly due to the various factors that play a role in the growth and evolution of a Milky Way-mass system, compared to that of clusters, which are dominated by hierarchical growth. While some properties of the system can be used as indicators of the stellar content in the IHSC, the specific location in the plane ultimately depends on the specific assembly history a system has, because specific locations in the plane can be reached by a variety of paths, explaining why there is a non-negligible scatter even when studying sub-samples of the population with more similar accretion histories.
The method and results presented in this paper give insight into open questions about the IHSC, and provide a consistent picture of the properties of the IHSC across a wide range of masses and its evolution throughout cosmic time. There is, however, still work to be done, more specifically exploring in detail Milky Way mass system using higher resolution simulations, as well simulations that can resolve multiple massive galaxy clusters. Finally, a detailed and careful comparison between observations and different theoretical models is crucial to help us understand better the physics of galaxy formation.
Acknowledgements
The authors thank Aaron Robotham, Bob Abraham, Aaron Ludlow, Mireia Montes, Rhea-Silvia Remus, Rhys Poulton and the theory and computing group at ICRAR for helpful discussions. RC is supported by the MERAC foundation postdoctoral grant awarded to CL and by the Consejo Nacional de Ciencia y Tecnología CONACYT CVU 520137 Scholar 290609 Overseas Scholarship 438594. CL is funded by a Discovery Early Career Researcher Award (DE150100618). Parts of this research were conducted by the Australian Research Council Centre of Excellence for All Sky Astrophysics in 3 Dimensions (ASTRO 3D), through project number CE170100013. This research is part of Spin(e) (ANR-13- BS05-0005, http://cosmicorigin.org). This work has made use of the Horizon Cluster hosted by Institut d’Astrophysique de Paris. We thank Stephane Rouberol for running smoothly this cluster for us.
References
- Abraham & van Dokkum (2014) Abraham R. G., van Dokkum P. G., 2014, PASP, 126, 55
- Bahé et al. (2017) Bahé Y. M., et al., 2017, MNRAS, 470, 4186
- Barker et al. (2009) Barker M. K., Ferguson A. M. N., Irwin M., Arimoto N., Jablonka P., 2009, AJ, 138, 1469
- Barnes & Hernquist (1991) Barnes J. E., Hernquist L. E., 1991, ApJ, 370, L65
- Barnes et al. (2017) Barnes D. J., et al., 2017, MNRAS, 471, 1088
- Bullock & Johnston (2005) Bullock J. S., Johnston K. V., 2005, ApJ, 635, 931
- Burke et al. (2015) Burke C., Hilton M., Collins C., 2015, MNRAS, 449, 2353
- Cañas et al. (2019) Cañas R., Elahi P. J., Welker C., del P Lagos C., Power C., Dubois Y., Pichon C., 2019, MNRAS, 482, 2039
- Contini et al. (2014) Contini E., De Lucia G., Villalobos Á., Borgani S., 2014, MNRAS, 437, 3787
- Cooper et al. (2010) Cooper A. P., et al., 2010, MNRAS, 406, 744
- Cooper et al. (2013) Cooper A. P., D’Souza R., Kauffmann G., Wang J., Boylan-Kolchin M., Guo Q., Frenk C. S., White S. D. M., 2013, MNRAS, 434, 3348
- Cooper et al. (2015) Cooper A. P., Gao L., Guo Q., Frenk C. S., Jenkins A., Springel V., White S. D. M., 2015, MNRAS, 451, 2703
- Croom et al. (2012) Croom S. M., et al., 2012, MNRAS, 421, 872
- Cui et al. (2014) Cui W., et al., 2014, MNRAS, 437, 816
- D’Souza et al. (2014) D’Souza R., Kauffman G., Wang J., Vegetti S., 2014, MNRAS, 443, 1433
- Da Rocha & Mendes de Oliveira (2005) Da Rocha C., Mendes de Oliveira C., 2005, MNRAS, 364, 1069
- Davies et al. (2019) Davies L. J. M., et al., 2019, MNRAS, 483, 5444
- Davis et al. (1985) Davis M., Efstathiou G., Frenk C. S., White S. D. M., 1985, ApJ, 292, 371
- Dolag et al. (2010) Dolag K., Murante G., Borgani S., 2010, MNRAS, 405, 1544
- Drory et al. (2015) Drory N., et al., 2015, AJ, 149, 77
- Dubois et al. (2010) Dubois Y., Devriendt J., Slyz A., Teyssier R., 2010, MNRAS, 409, 985
- Dubois et al. (2012) Dubois Y., Devriendt J., Slyz A., Teyssier R., 2012, MNRAS, 420, 2662
- Dubois et al. (2013) Dubois Y., Gavazzi R., Peirani S., Silk J., 2013, MNRAS, 433, 3297
- Dubois et al. (2014) Dubois Y., et al., 2014, MNRAS, 444, 1453
- Dubois et al. (2016) Dubois Y., Peirani S., Pichon C., Devriendt J., Gavazzi R., Welker C., Volonteri M., 2016, MNRAS, 463, 3948
- Durbala et al. (2008) Durbala A., et al., 2008, AJ, 135, 130
- Elahi et al. (2011) Elahi P. J., Thacker R. J., Widrow L. M., 2011, MNRAS, 418, 320
- Elahi et al. (2019a) Elahi P. J., Cañas R., Poulton R. J. J., Tobar R. J., Willis J. S., Lagos C. d. P., Power C., Robotham A. S. G., 2019a, arXiv e-prints,
- Elahi et al. (2019b) Elahi P. J., Poulton R. J. J., Tobar R. J., Canas R., Lagos C. d. P., Power C., Robotham A. S. G., 2019b, arXiv e-prints, p. arXiv:1902.01527
- Elias et al. (2018) Elias L. M., Sales L. V., Creasey P., Cooper M. C., Bullock J. S., Rich R. M., Hernquist L., 2018, MNRAS, 479, 4004
- Feldmeier et al. (2004) Feldmeier J. J., Mihos J. C., Morrison H. L., Harding P., Kaib N., Dubinski J., 2004, ApJ, 609, 617
- Font et al. (2011) Font A. S., McCarthy I. G., Crain R. A., Theuns T., Schaye J., Wiersma R. P. C., Dalla Vecchia C., 2011, MNRAS, 416, 2802
- Gauthier et al. (2006) Gauthier J.-R., Dubinski J., Widrow L. M., 2006, ApJ, 653, 1180
- Greggio et al. (2014) Greggio L., Rejkuba M., Gonzalez O. A., Arnaboldi M., Iodice E., Irwin M., Neeser M. J., Emerson J., 2014, A&A, 562, A73
- Harmsen et al. (2017) Harmsen B., Monachesi A., Bell E. F., de Jong R. S., Bailin J., Radburn-Smith D. J., Holwerda B. W., 2017, MNRAS, 466, 1491
- Ibata et al. (2005) Ibata R., Chapman S., Ferguson A. M. N., Lewis G., Irwin M., Tanvir N., 2005, ApJ, 634, 287
- Karademir et al. (2019) Karademir G. S., Remus R.-S., Burkert A., Dolag K., Hoffmann T. L., Moster B. P., Steinwandel U. P., Zhang J., 2019, MNRAS, 487, 318
- Kaviraj et al. (2017) Kaviraj S., et al., 2017, MNRAS, 467, 4739
- Komatsu et al. (2011) Komatsu E., et al., 2011, ApJS, 192, 18
- Krick & Bernstein (2007) Krick J. E., Bernstein R. A., 2007, AJ, 134, 466
- Lagos et al. (2018a) Lagos C. d. P., et al., 2018a, MNRAS, 473, 4956
- Lagos et al. (2018b) Lagos C. d. P., Schaye J., Bahé Y., Van de Sande J., Kay S. T., Barnes D., Davis T. A., Dalla Vecchia C., 2018b, MNRAS, 476, 4327
- Martínez-Delgado et al. (2008) Martínez-Delgado D., Peñarrubia J., Gabany R. J., Trujillo I., Majewski S. R., Pohlen M., 2008, ApJ, 689, 184
- Martínez-Delgado et al. (2010) Martínez-Delgado D., et al., 2010, AJ, 140, 962
- McConnachie et al. (2009) McConnachie A. W., et al., 2009, Nature, 461, 66
- Merritt et al. (2016) Merritt A., van Dokkum P., Abraham R., Zhang J., 2016, ApJ, 830, 62
- Mihos & Hernquist (1996) Mihos J. C., Hernquist L., 1996, ApJ, 464, 641
- Mihos et al. (2005) Mihos J. C., Harding P., Feldmeier J., Morrison H., 2005, ApJ, 631, L41
- Mihos et al. (2017) Mihos J. C., Harding P., Feldmeier J. J., Rudick C., Janowiecki S., Morrison H., Slater C., Watkins A., 2017, ApJ, 834, 16
- Miyazaki et al. (2012) Miyazaki S., et al., 2012, in Ground-based and Airborne Instrumentation for Astronomy IV. p. 84460Z, doi:10.1117/12.926844
- Monachesi et al. (2016) Monachesi A., Bell E. F., Radburn-Smith D. J., Bailin J., de Jong R. S., Holwerda B., Streich D., Silverstein G., 2016, MNRAS, 457, 1419
- Monachesi et al. (2019) Monachesi A., et al., 2019, MNRAS, 485, 2589
- Montes & Trujillo (2014) Montes M., Trujillo I., 2014, ApJ, 794, 137
- Montes & Trujillo (2018) Montes M., Trujillo I., 2018, MNRAS, 474, 917
- Morishita et al. (2017) Morishita T., Abramson L. E., Treu T., Schmidt K. B., Vulcani B., Wang X., 2017, ApJ, 846, 139
- Mouhcine et al. (2005) Mouhcine M., Ferguson H. C., Rich R. M., Brown T. M., Smith T. E., 2005, ApJ, 633, 810
- Murante et al. (2004) Murante G., et al., 2004, ApJ, 607, L83
- Murante et al. (2007) Murante G., Giovalli M., Gerhard O., Arnaboldi M., Borgani S., Dolag K., 2007, MNRAS, 377, 2
- Naab et al. (2014) Naab T., et al., 2014, MNRAS, 444, 3357
- Oser et al. (2010) Oser L., Ostriker J. P., Naab T., Johansson P. H., Burkert A., 2010, ApJ, 725, 2312
- Peñarrubia et al. (2006) Peñarrubia J., McConnachie A., Babul A., 2006, ApJ, 650, L33
- Peirani et al. (2017) Peirani S., et al., 2017, MNRAS, 472, 2153
- Peirani et al. (2019) Peirani S., et al., 2019, MNRAS, 483, 4615
- Penoyre et al. (2017) Penoyre Z., Moster B. P., Sijacki D., Genel S., 2017, MNRAS, 468, 3883
- Pillepich et al. (2014) Pillepich A., et al., 2014, MNRAS, 444, 237
- Pillepich et al. (2015) Pillepich A., Madau P., Mayer L., 2015, ApJ, 799, 184
- Pillepich et al. (2018) Pillepich A., et al., 2018, MNRAS, 475, 648
- Poulton et al. (2018) Poulton R. J. J., Robotham A. S. G., Power C., Elahi P. J., 2018, Publ. Astron. Soc. Australia, 35
- Puchwein et al. (2010) Puchwein E., Springel V., Sijacki D., Dolag K., 2010, MNRAS, 406, 936
- Radburn-Smith et al. (2011) Radburn-Smith D. J., et al., 2011, ApJS, 195, 18
- Remus et al. (2017) Remus R.-S., Dolag K., Hoffmann T., 2017, Galaxies, 5, 49
- Robertson et al. (2017) Robertson B. E., et al., 2017, arXiv e-prints,
- Robotham et al. (2014) Robotham A. S. G., et al., 2014, MNRAS, 444, 3986
- Rodriguez-Gomez et al. (2016) Rodriguez-Gomez V., et al., 2016, MNRAS, 458, 2371
- Rudick et al. (2006) Rudick C. S., Mihos J. C., McBride C., 2006, ApJ, 648, 936
- Rudick et al. (2011) Rudick C. S., Mihos J. C., McBride C. K., 2011, ApJ, 732, 48
- Sánchez et al. (2011) Sánchez S. F., et al., 2011, in Zapatero Osorio M. R., Gorgas J., Maíz Apellániz J., Pardo J. R., Gil de Paz A., eds, Highlights of Spanish Astrophysics VI. pp 339–344 (arXiv:1012.3002)
- Schaye et al. (2015) Schaye J., et al., 2015, MNRAS, 446, 521
- Sérsic (1963) Sérsic J. L., 1963, Boletin de la Asociacion Argentina de Astronomia La Plata Argentina, 6, 41
- Somerville & Davé (2015) Somerville R. S., Davé R., 2015, ARA&A, 53, 51
- Teyssier (2002) Teyssier R., 2002, A&A, 385, 337
- Toomre & Toomre (1972) Toomre A., Toomre J., 1972, ApJ, 178, 623
- Vogelsberger et al. (2014) Vogelsberger M., et al., 2014, MNRAS, 444, 1518
- Volonteri et al. (2016) Volonteri M., Dubois Y., Pichon C., Devriendt J., 2016, MNRAS, 460, 2979
- Watkins et al. (2015) Watkins A. E., Mihos J. C., Harding P., 2015, ApJ, 800, L3
- Welker et al. (2014) Welker C., Devriendt J., Dubois Y., Pichon C., Peirani S., 2014, MNRAS, 445, L46
- White & Rees (1978) White S. D. M., Rees M. J., 1978, MNRAS, 183, 341
- Zhang et al. (2018) Zhang Y., et al., 2018, arXiv e-prints,
- Zibetti et al. (2005) Zibetti S., White S. D. M., Schneider D. P., Brinkmann J., 2005, MNRAS, 358, 949
- Zwicky (1952) Zwicky F., 1952, PASP, 64, 242
- van de Sande et al. (2019) van de Sande J., et al., 2019, MNRAS, 484, 869
- van der Wel et al. (2014) van der Wel A., et al., 2014, ApJ, 788, 28
Appendix A IHSC extent and spherical apertures
Here we present how our definition of the IHSC compares to the one defined by spherical overdensity and spherical apertures widely used in the literature (see Section 1 for a discussion). In Fig. 15 we show surface density projections of the stellar mass content using (left column) and 3DFOF (right column) mass conventions. Top row shows the total stellar mass, middle row the stellar mass in the central galaxy and IHSC (CG+IHSC), and bottom row the stellar mass in the IHSC only, as identified by velociraptor. The total mass content (top row) shows that 3DFOF convention does not capture the presence of some satellites in the vicinity of the central galaxy, as well as some diffuse stellar mass, differing by %. This difference is similar to the excess of mass content in the IHSC and 3DFOF definitions. For this particular example, the mass fraction in the IHSC is for and . This behaviour is consistent for the entire population of objects resolved in the Horizon-AGN simulation, as can be seen in Fig. 16, where the total stellar mass content, (top panel), and the mass in the IHSC, (middle panel), follow an almost 1-to-1 correspondence with only notable variations at . Finally, the relation (bottom panel) is consistent in shape and amplitude at all stellar masses for both conventions.
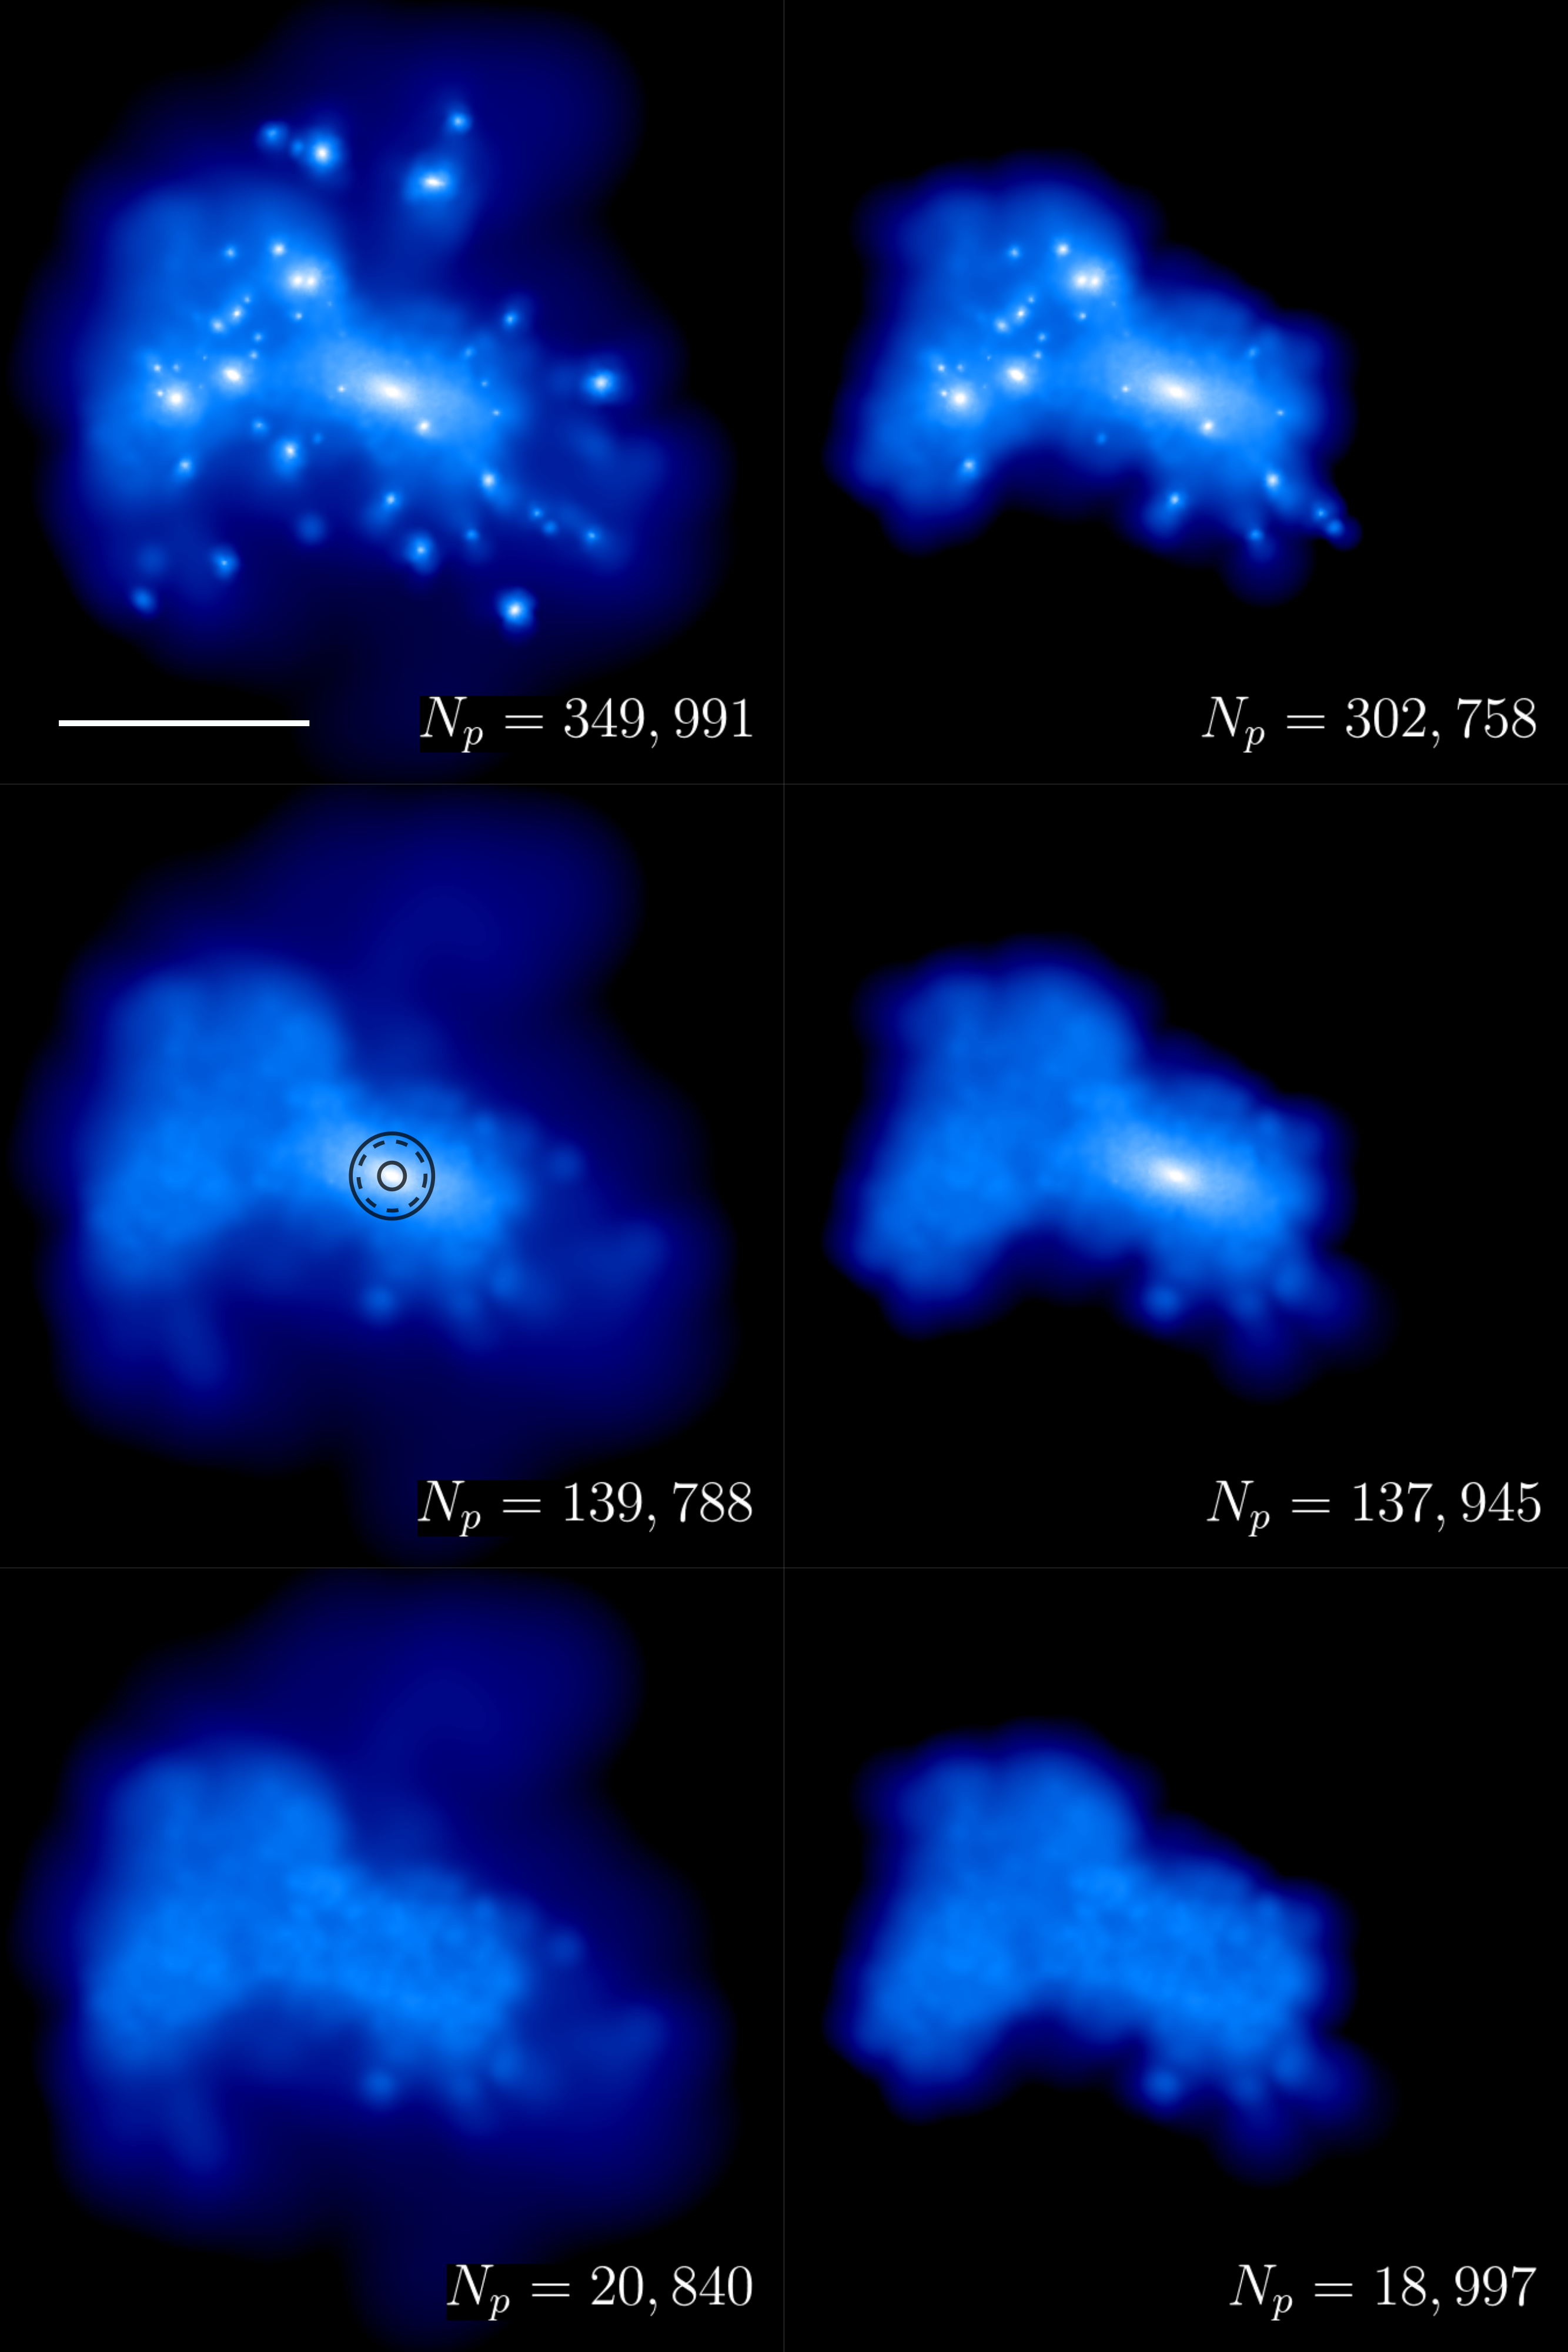
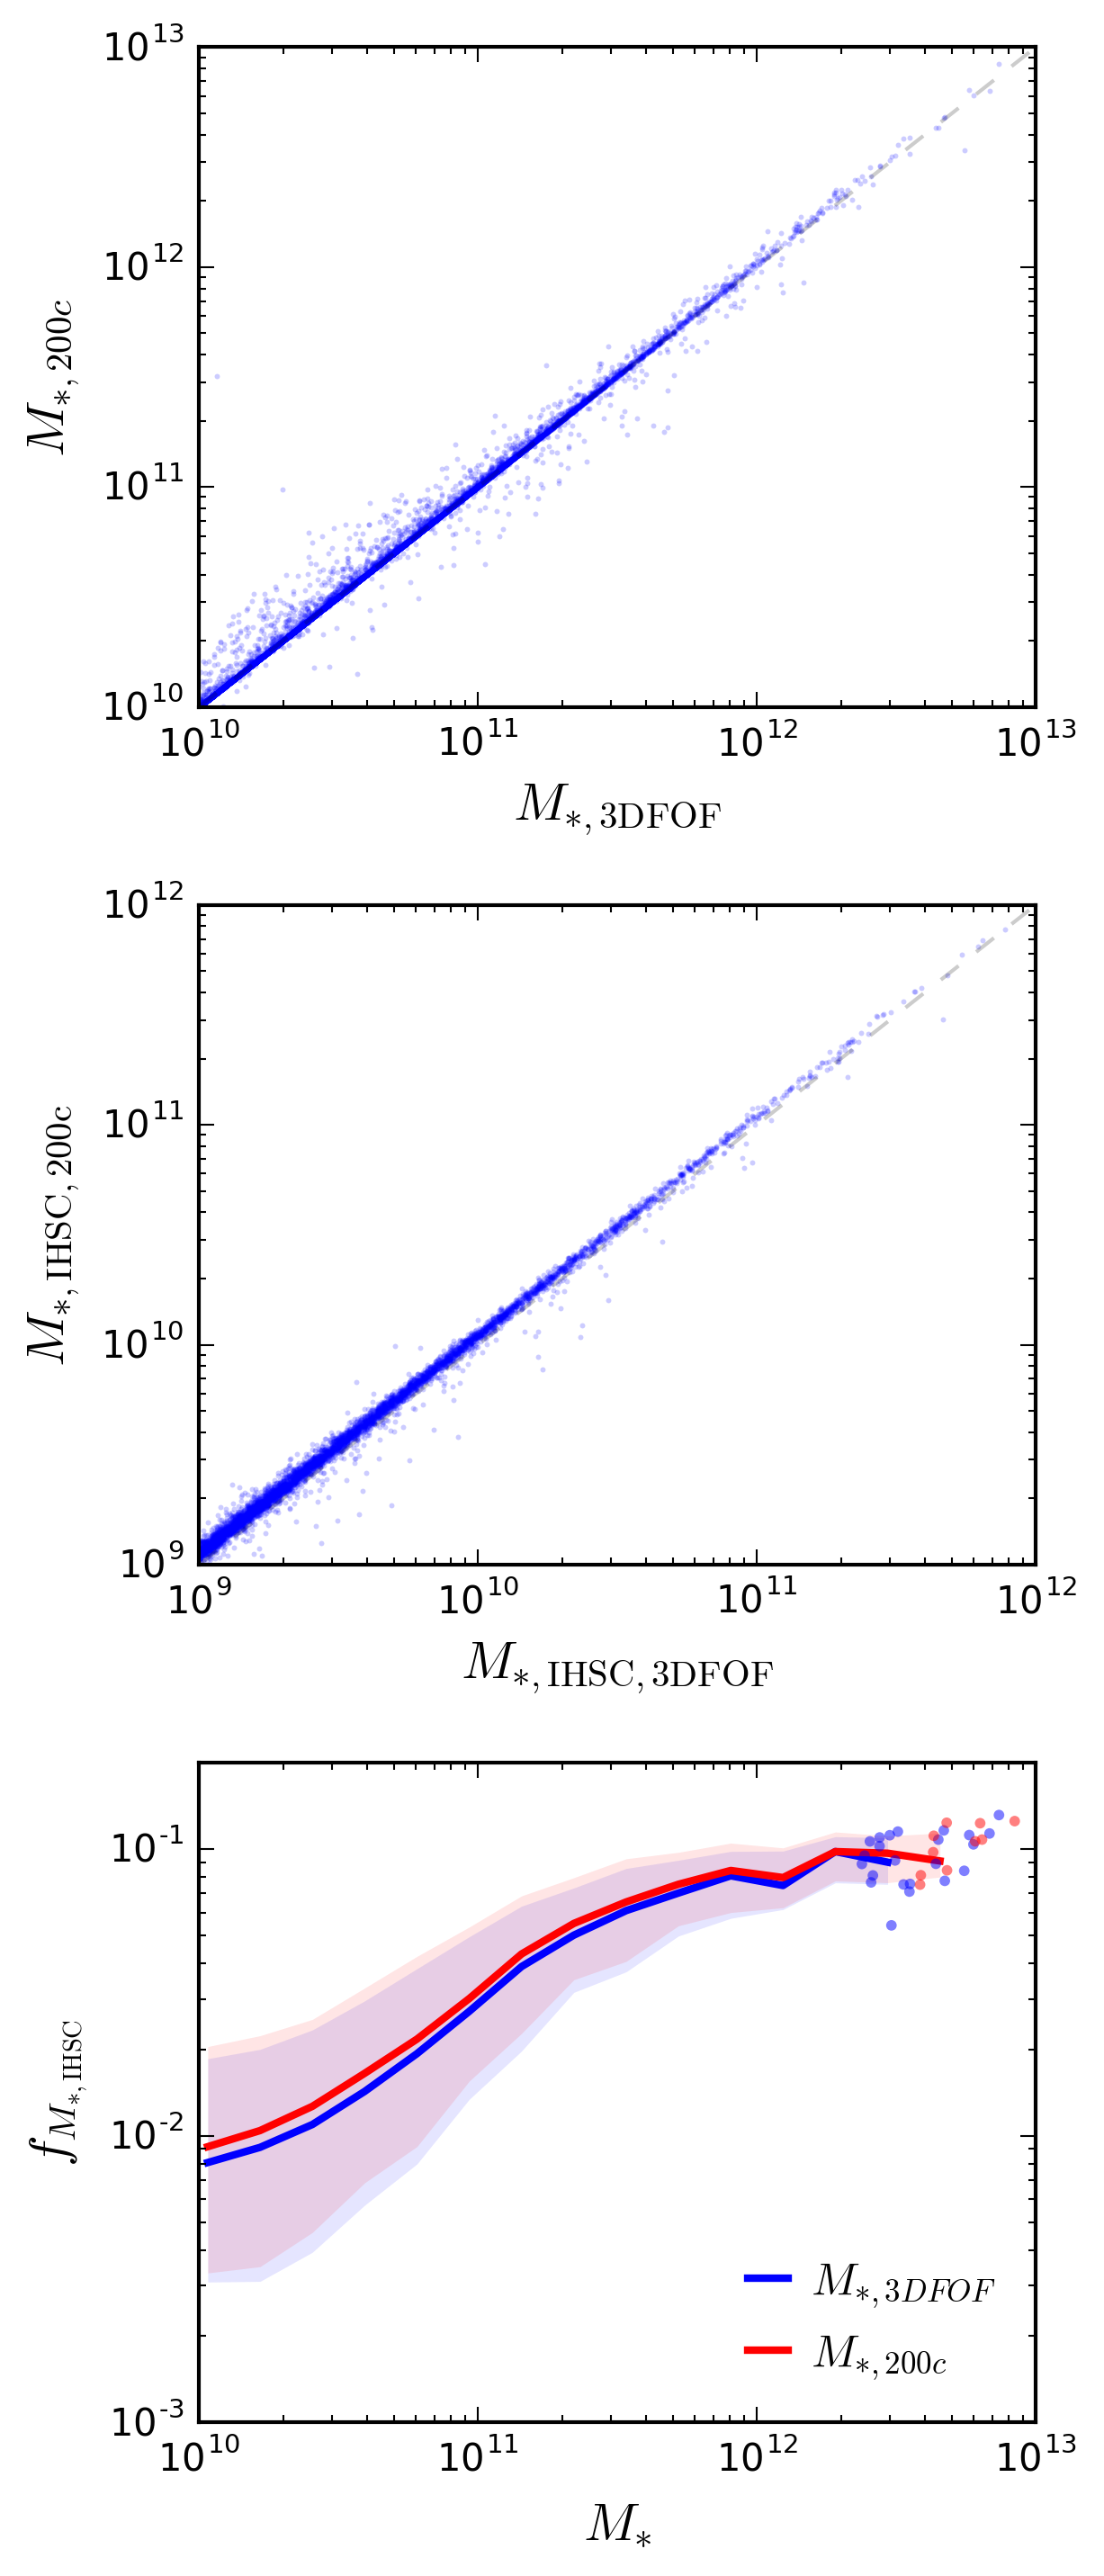
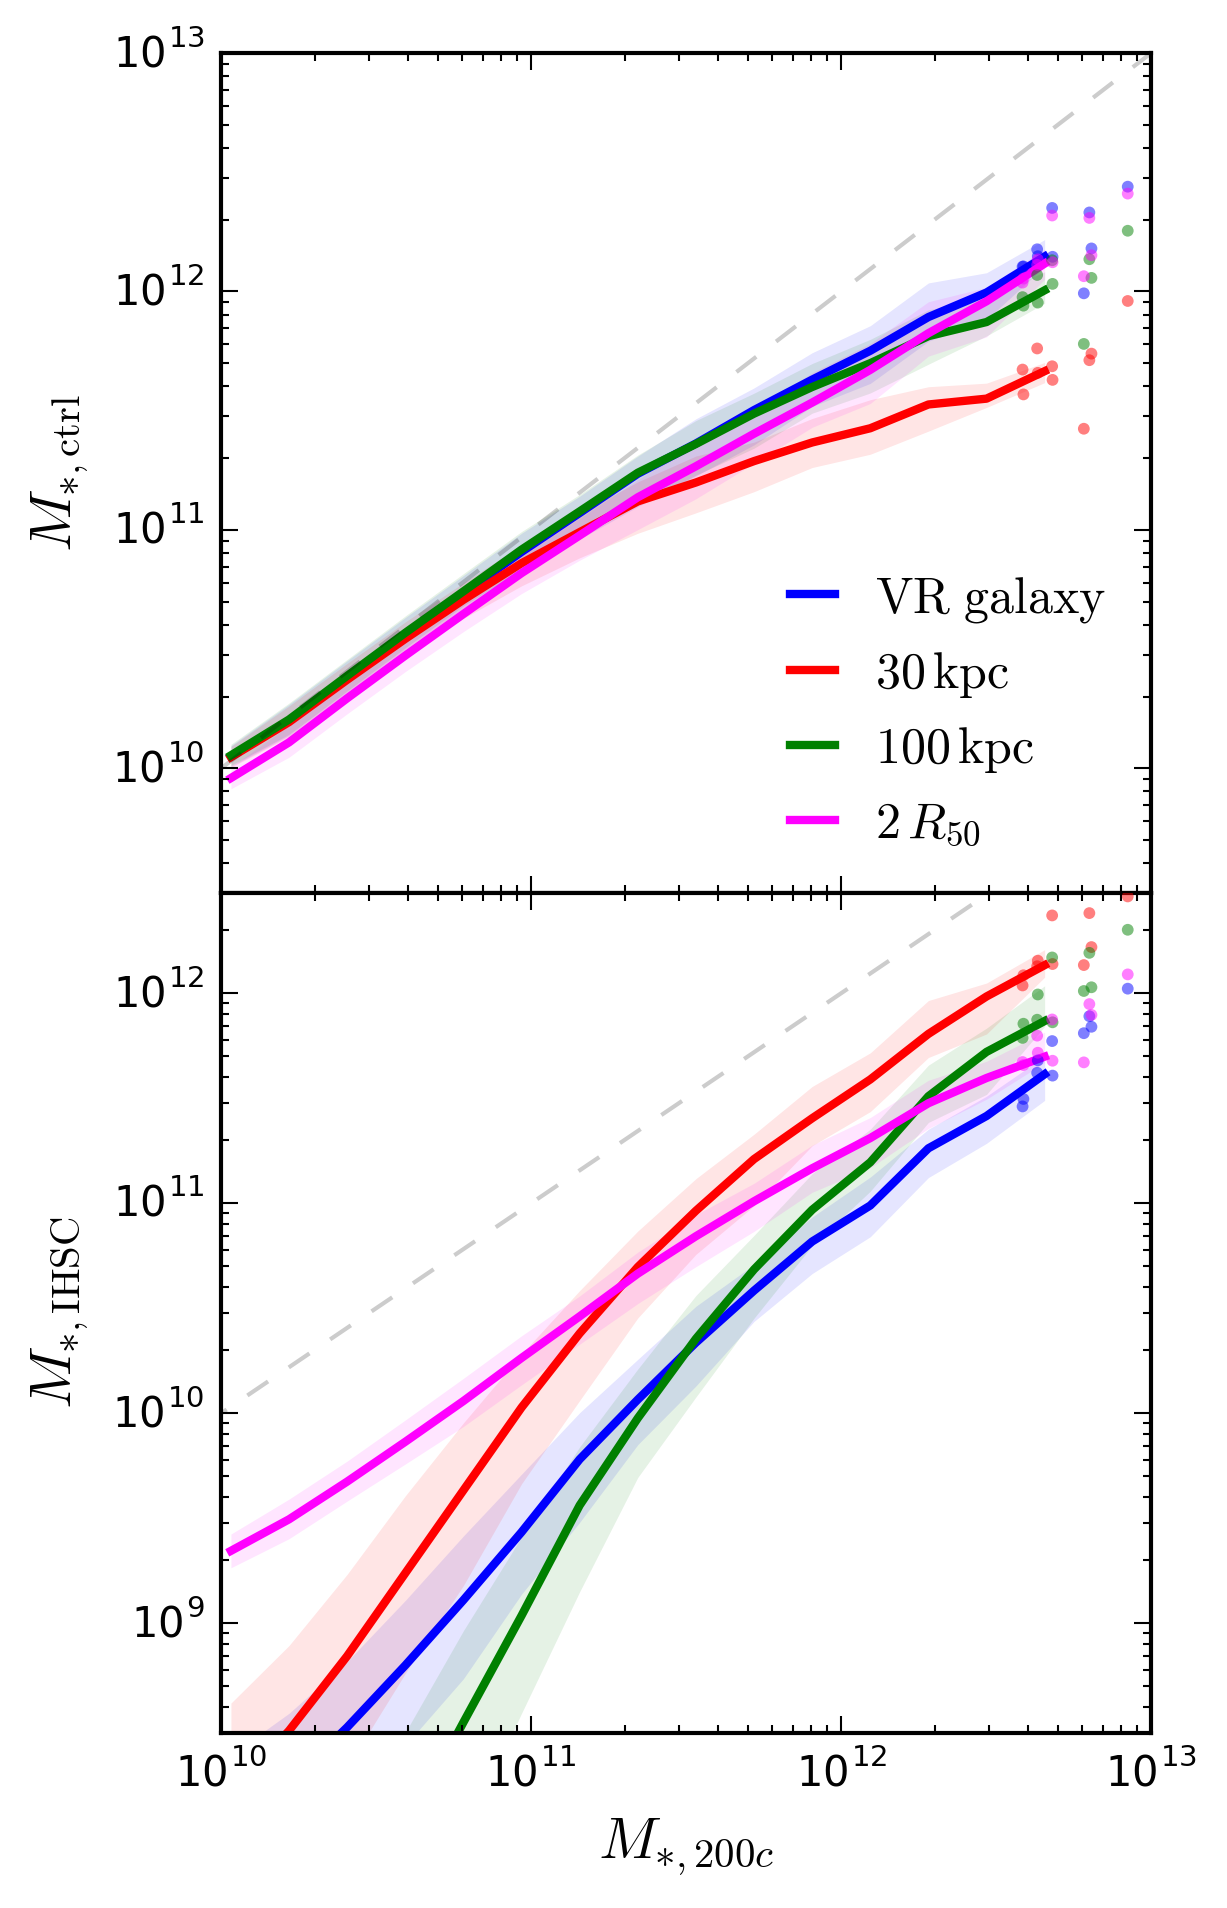
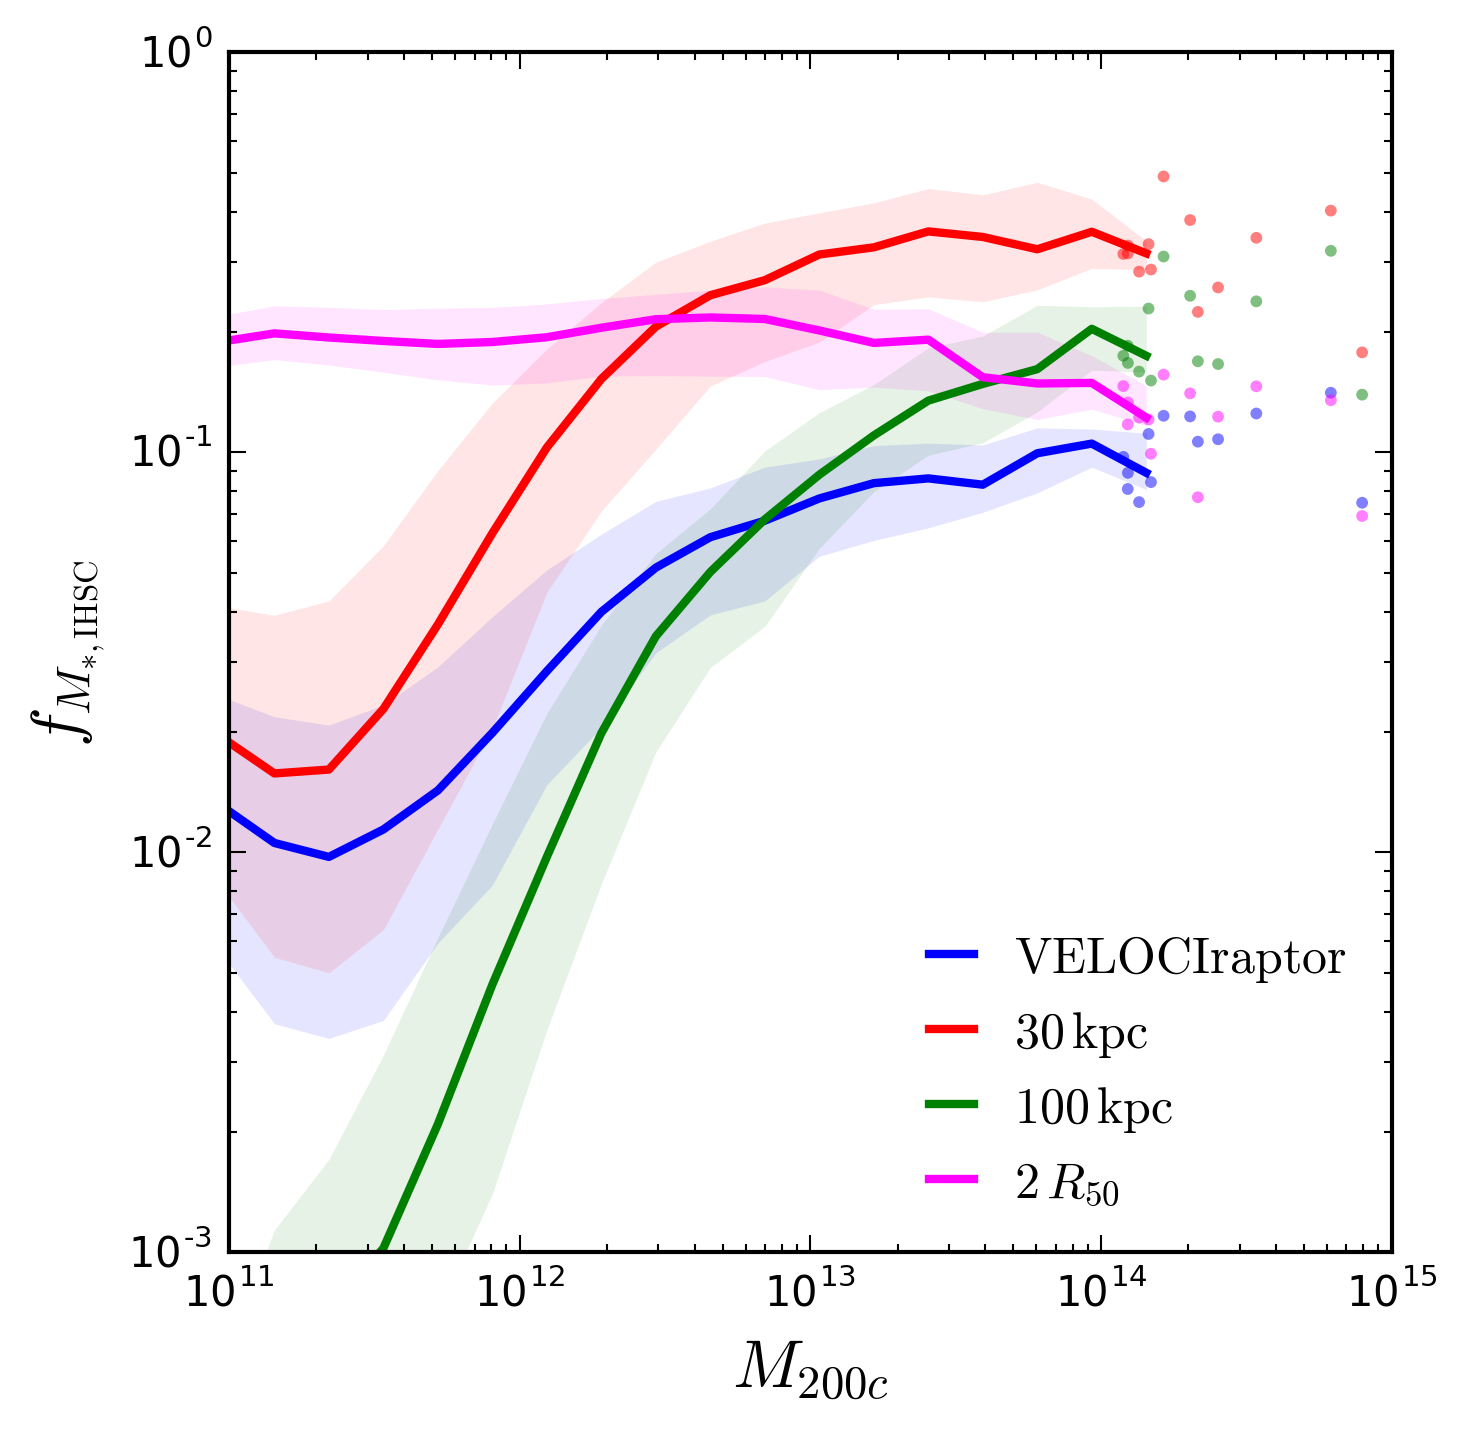
In the middle panel of Fig. 15, we show the combination of CG+IHSC components, along with concentric circles representing spherical apertures of 30 and 100 kpc (solid circles) and (dashed circle) used in the literature to separate the central galaxy from the IHSC (e.g. Pillepich et al., 2018; Elias et al., 2018). We show in the top panel of Fig. 17 the stellar mass of the central galaxy, as a function of total stellar mass inside spherical over-density, ; note that for the velociraptor measurement we use the definition of the bottom left panel of Fig. 15, instead of the 3DFOF for consistency. All definitions show a consistent relation between and for , which is expected as the mass budget is contained mainly in the central galaxy, which at this masses can be well defined by spherical apertures of 30 and 100 kpc. At larger masses the relations deviate from the 1-to-1 relation. This is in part because most of the mass comes from satellites, which is particularly noticeable for the 30 kpc aperture as the central galaxy is also likely to extend beyond this aperture. A similar trend is visible at for the 100 kpc aperture for the same reason. The trend displayed by velociraptor and appears to indicate that the velociraptor relation flattens a little at higher masses, while the slope of is steeper, however, statistics are low to make a strong conclusion. Contrary to the , the relation between and is different for all definitions at all mass ranges. The relation has a power-law index at all masses. In the case of the 30 kpc aperture, there is an evident change in the power-law index which goes from being at to for higher masses. The 100 kpc aperture also shows a change in the power-law index at a similar mass, but with a value ; finally for our method the initial slope is slightly for and at higher masses.
Lastly, in Fig. 18 we show the as a function of the total halo mass . This plot is complementary to that of Fig. 6. While the relation is observable for low-mass systems, the is useful for theoretical predictions, and can also be estimated via lensing at cluster scales. The behaviour of both relations is very similar, which is expected from the 1-to-1 comparison shown in Fig. 16.