Structural, Electronic, and Magnetic Properties of Bulk and Epitaxial LaCoO3 through Diffusion Monte Carlo
Abstract
Magnetism in lanthanum cobaltite (LCO, LaCoO3) appears to be strongly dependent on strain, defects, and nanostructuring. LCO on strontium titanate (STO, SrTiO3) is a ferromagnet with an interesting strain relaxation mechanism that yields a lattice modulation. However, the driving force of the ferromagnetism is still controversial. Experiments debate between a vacancy-driven or strain-driven mechanism for epitaxial LCO’s ferromagnetism. We found that a weak lateral modulation of the superstructure is sufficient to promote ferromagnetism. Our research also showed that ferromagnetism appears under uniaxial compression and expansion. Although earlier experiments suggest that bulk LCO is nonmagnetic, our Diffusion Monte Carlo calculations found that magnetic phases have a lower energy ground state for bulk LCO. This article discusses recent experiments indicating a more complicated picture for the bulk magnetism and closer agreement with our calculations. The role of defects are also discussed through excited-state calculations.
pacs:
I Introduction
The electronic structure of correlated systems can be heavily dependent on their geometry and external stimuli such as epitaxial strain, temperature, and impurities. Using lattice distortions, the balance between crystal field splitting and Hund’s exchange can be manipulated to drive metal/insulator and ferromagnetic/antiferromagnetic (FM/AFM) transitions Dagotto (2005); Tokura and Nagaosa (2000); Ahn et al. (2004). Lanthanum cobaltite (LCO, LaCoO3) is an example of a material that becomes a ferromagnet under epitaxial strain Biškup et al. (2014); Mehta et al. (2015); Gazquez et al. (2011); Kwon et al. (2014); Choi et al. (2012); Qiao et al. (2015). Ferromagnetism in epitaxial LCO is particularly interesting, as the bulk material was thought to be nonmagnetic Koehler and Wollan (1957). The ability to control the ferromagnetism in epitaxial LCO could yield novel basic properties and new technological applications. A combination of external factors has been found to simultaneously affect the atomic spin states of LCO Zobel et al. (2002); Klie et al. (2007); Radaelli and Cheong (2002); Señarı́s-Rodrı́guez and Goodenough (1995); Podlesnyak et al. (2006); Saitoh et al. (1997); Asai et al. (1998); Phelan et al. (2006); Zhou et al. (2007); Fuchs et al. (2007, 2009). Therefore, having a clear understanding of the origin of the spin transition can be extremely challenging.
Several authors Biškup et al. (2014); Mehta et al. (2015); Gazquez et al. (2011); Kwon et al. (2014); Choi et al. (2012); Qiao et al. (2015) have reported an unconventional mechanism of strain relaxation in epitaxial LCO. In scanning transmission electron microscope (STEM) images, LCO grown on strontium titanate (STO) typically yields a superstructure of two bright stripes following a dark stripe. In these images, brightness is associated with the larger electron density of La atoms. The brighter stripes indicate a smaller La-La separation (3.61 Å), whereas the La-La separation in the darker stripes is larger (4.54 Å) on the in-plane axis Biškup et al. (2014). In LCO, Co has a nominal charge of 3+. Thus, Co3+ can have three different atomic magnetic moments: high-spin (HS, , =2), intermediate-spin (IS, , =1) and low-spin (LS, , =0, nonmagnetic). Dark stripes with a larger La-La distance might be ascribed to the HS state, due to the diminished crystal field splitting with the larger Co-O interatomic distances. Therefore, the HS state of Co3+ in darker stripes might explain the ferromagnetism observed in LCO thin films. Two mechanisms are proposed to explain the lattice modulation and the ferromagnetism: The first mechanism indicates that an ordered array of oxygen vacancies is the driving force for the superstructure formation and the ferromagnetism Biškup et al. (2014); Mehta et al. (2015); Gazquez et al. (2011). However, the second mechanism indicates that the epitaxial strain drives the ferromagnetism through the rearrangement of the Co-octahedra Kwon et al. (2014); Choi et al. (2012); Qiao et al. (2015). The controversy between the two experimentally suggested mechanisms arises from the interpretation of the methods, which provides averaged information. These mechanisms were also studied using Density Functional Theory (DFT) W. Kohn and L. J. Sham (1965); Hohenberg and Kohn (1964) to help resolve the controversy. However, the accuracy of DFT has not yet been sufficient to differentiate between the two mechanisms Biškup et al. (2014); Kwon et al. (2014).
Projector methods Ma et al. (2013), such as Diffusion Monte Carlo (DMC) Ceperley and Alder (1980); Foulkes et al. (2001), are shown to be the most accurate and practical methods to tackle the ground states of complex, highly correlated materials with a similar success in the excited states Kolorenc et al. (2010); Yu et al. (2015); Needs and Towler (2003); Mitra et al. (2015); Schiller et al. (2015); Saritas et al. (2018a, 2017); Trail et al. (2017); Luo et al. (2016); Benali et al. (2016); Zheng and Wagner (2015); Kylänpää et al. (2017); Yu et al. (2017); Santana et al. (2015); Shin et al. (2017, 2018); Saritas et al. (2019). Although it is computationally more expensive, DMC explicitly accounts for the antisymmetry of the many-body wave function and electron correlation, without using any empirical parameters Ceperley and Alder (1980); Foulkes et al. (2001); Shulenburger and Mattsson (2013); Needs et al. (2010). DMC previously predicted the correct energetic ordering between the three polymorphs of CoO, surpassing the accuracy of DFT approximations Saritas et al. (2018b). DMC was shown to yield accurate energies for La-containing compounds as well Santana et al. (2016, 2017). Thanks to its favorable computational scaling, , DMC can be an ideal theoretical method to study LCO.
In this work, we studied the magnetism of bulk and epitaxial LCO using DMC under isotropic scaling and lattice modulation. Understanding the magnetism of bulk LCO is an integral part of our study. Bulk LCO has long been thought to be nonmagnetic Koehler and Wollan (1957), but recent experiments challenge this idea Belanger et al. (2016); Durand et al. (2015a, b); Kaminsky et al. (2018); Durand et al. (2013); Belanger et al. (2016); Itoh et al. (1995). We predict an AFM ground state for the bulk LCO using DMC. In uniaxially strained LCO, we find a complete transition from HS-AFM to HS-FM at a La-La separation of nearly 4.5 Å. When La-La separation is allowed to contract, another transition between HS-AFM and HS/LS-FM mixed phase is also observed at 3.71 Å. In epitaxial LCO, we find that a mixed phase of HS-AFM and HS/LS-FM phases is allowed to exist that is less than 0.1 eV per Co above the LCO ground state. Yet, the stable lattice modulation of the epitaxial LCO from DMC is not as large as the lattice modulation observed in the experiments. Our findings suggest that defects may be playing a more dominant role in driving this lattice modulation. We calculated the quasiparticle and optical gaps of LCO using various DFT approximations and DMC. Our results indicate LCO optical and quasiparticle gaps of 3.75 eV from DMC, while 1.6–1.9 eV Kohn-Sham gaps from DFT. Our theoretical estimates of these gaps are significantly larger than the experimental estimates, which are less than 1 eV. We argue that the presence of defects in LCO or internal - transitions provides a possible explanation for both the substantially large lattice modulation and the overestimation of the experimental gap energies.
Section II briefly describes the DMC approach and our methods. In Section III.1, using the experimental geometry from the literature, we study the ground-state magnetic and structural properties of bulk LCO using DMC. In Section III.2, we first calculate the ground-state DMC energies of various magnetic phases in epitaxial LCO with uniform La-La separation. Then, under the epitaxial equilibrium conditions, we study the lattice modulation (i.e., superstructure formation). Section III.2 shows that external factors such as defects are required to drive larger lattice modulations. In Section III.3, we present the results of our DFT and DMC calculations for optical and electronic gaps, which suggest the existence of intrinsic defects. In Section III.4, we study the orbital ordering in LCO, which provides the physical reasoning for HS-FM ordering over HS-AFM as observed in Section III.2. In Section III.5, we present our DFT and DMC benchmark for the magnetic ground states of bulk LCO studied in Section III.1. Finally, in Section IV, we provide study conclusions and discuss future research.
II Methods
For this work, we used DMC to obtain ground-state energies of bulk and epitaxial LCO, as well as the excited-state energies of bulk LCO. Methods for calculating excited states will be discussed later in this section. DFT functionals used in this work include local (LDA Perdew and Zunger (1981)), semilocal (PBE Perdew et al. (1996) and PBEsol Perdew et al. (2008)), and meta-GGA (SCAN Perdew et al. (2017)) functionals involving benchmarks with hybrid-DFT (B3LYP Becke (1993), HSE Heyd et al. (2003), and PBE0 Adamo and Barone (1999)) from the literature. In addition, Dudarev’s Hubbard- Anisimov et al. (1997); Dudarev et al. (1998) corrected LDA, PBE, and PBEsol functionals are also used to avoid well-known self-interaction error in correlated systems.
Geometry relaxation in DMC is possible for extended systems, but it is still computationally intensive and challenging Archibald et al. (2018); Sorella and Capriotti (2010). Due to this challenge, DMC studies often use experimental structural parameters with no relaxation Archibald et al. (2018). Similarly for bulk LCO, experimental structural parameters are available from the neutron diffraction experiments done at 4 K (ICSD no. 201761) Thornton et al. (1986). However, for epitaxial LCO, the experimental structures are not available. Therefore, a structural optimization method that is empirically validated and can best reproduce the experimental structures can be used in DMC. Ref. 49 shows that PBEsol+ = 4 eV is superior to PBE+ and LDA+ functionals in terms of producing accurate Co-O-Co bond angles and the equilibrium volume of bulk LCO. Therefore, we used PBEsol+ = 4 eV to obtain the structural parameters of epitaxial LCO to be used in DMC calculations. For the DMC calculations on bulk LCO, the experimental structural parameters are used with no relaxation. For the DFT benchmark calculations, the geometry optimization is performed separately with each functional. Benchmark DFT calculations and band decomposed charge density calculations were performed using VASP code with projector augmented wave (PAW) pseudopotentials Kresse and Furthmüller (1996); Kresse and Joubert (1999), using a kinetic energy cutoff of 520 eV with 6x6x6 reciprocal grid.
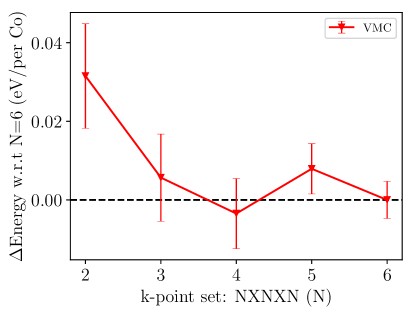
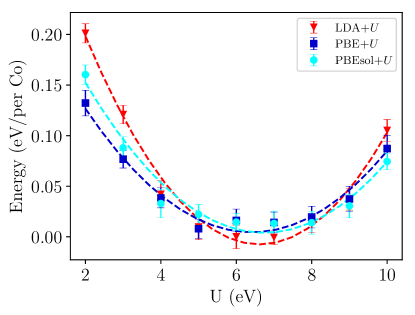
The Variational Monte Carlo (VMC) and DMC Foulkes et al. (2001); Needs et al. (2010) calculations were performed using QMCPACK Kim et al. (2018), while DFT-VMC-DMC calculation workflows were generated using Nexus Krogel (2016) software suite. We used DMC trial wavefunctions in the Slater-Jastrow form Slater (1929); Jastrow (1955). Quantum Espresso Giannozzi et al. (2009) (QE) code was used to generate the single determinant spin-up and spin-down orbitals. We included terms up to three-body Jastrow correlation functions as described in Drummond et al. (2004). These functions were parameterized in terms of radial blip-splines for one- and two-body terms and in terms of low-order polynomials for the three-body terms. The purpose of using a trial-wavefunction with the Slater-Jastrow form is to guide the simulation to achieve the ground-state energy with higher accuracy, smaller localization error Mitáš et al. (1991), and reduced variance Foulkes et al. (2001). Jastrow parameters are optimized using subsequent VMC variance and energy minimization calculations using the linear method Umrigar et al. (2007). Cost function of the energy minimization is split as 95/5 energy and variance minimization, which is shown to provide a good balance for improvements in DMC with the resulting variance Umrigar and Filippi (2005). The Slater part of the trial wavefunction is optimized by improving the nodal surface. DMC has the zero-variance property, meaning that as the trial wavefunction approaches the exact ground state (i.e., having exact nodal surface), statistical fluctuations in the energy reduce to zero Foulkes et al. (2001). Various sophisticated methods can be used to optimize the nodal surface of the trial wavefunction Kwon et al. (1993, 1998); López Ríos et al. (2006); Bajdich et al. (2010). However, we used a simpler approach with LDA+, where the Hubbard- value is used as a variational parameter to optimize the nodal surface using DMC. In the appendix, we show that DMC minima is largely insensitive to the choice of DFT functional, and the choice of value does not affect the ordering between the magnetic phases of LCO. Our findings are also supported by previous studies on NiO Shin et al. (2018), TiO2 Luo et al. (2016), and CoO Saritas et al. (2018b). We found that LDA+ = 6 eV gives optimized DMC energies for all the magnetic phases of LCO studied here; hence it is used throughout this work.
A timestep of 0.01 Ha-1 and a supercell 3x3x3 reciprocal twist were used in all DMC calculations. Convergence tests regarding the timestep error and the one-body finite-size effects are given in the appendix and the supplementary information sup . The locality approximation is used to evaluate the nonlocal pseudopotentials within DMC Mitáš et al. (1991). Compared to the T-moves approximation Casula et al. (2010), the locality approximation is found to reduce the localization error further for the pseudopotentials used in this work Dzubak et al. (2017); Krogel and Kent (2017). Model periodic Coulomb (MPC) Williamson et al. (1997); Kent et al. (1999) interaction was used to eliminate spurious two-body interactions on the potential energy Drummond et al. (2008); Fraser et al. (1996). We used hard LDA Perdew and Zunger (1981) RRKJ pseudopotentials that had been generated using OPIUM OPI and were previously tested for use in Quantum Monte Carlo (QMC) operations Krogel et al. (2016); Santana et al. (2016, 2017); Saritas et al. (2018b). The kinetic energy cutoff we used, 350 Ry, is found to converge total energies within 1 meV per atom.
QMC simulations were performed using supercells containing a minimum of 8 formula units (40 atoms for bulk LCO) when the energies of two structures with identical lattice parameters are compared. When the energy difference between two structures with different lattice parameters is calculated, finite-size extrapolations are performed using up to 90-atom cells sup . The real-space blip-spline basis sets used in the finite-size extrapolation calculations can have very large memory requirements on computational nodes, making large simulations inaccessible. Therefore, a hybrid orbital scheme Luo et al. (2018), separating core and interatomic regions, was used in the finite-size extrapolation calculations. Within this scheme, cutoff radii of 2.2 Å, 1.4 Å, and 1.2 Å were used on La, Co, and O atoms, respectively. The radii values we used for Co and O closely resemble the values used for Ni and O in NiO Luo et al. (2018). These values were found to provide ground-state energies converged under 10 meV per atom sup .
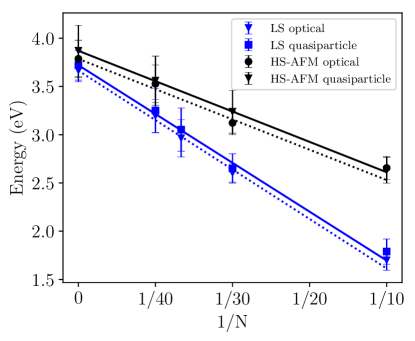
Excited-state calculations in DMC are done using automated workflows developed using Nexus. In this workflow, the primitive cell of the structures is standardized using Spglib Togo and Tanaka (2018), and the irreducible Brillouin zone paths are obtained using SeeK-path Hinuma et al. (2017) for the band structure calculations. Starting from an upper diagonal Hermite normal form Lloyd-Williams and Monserrat (2015), tiling matrices are optimized for each twist for the largest Wigner-Seitz radius possible to reduce finite-size errors. While the experimental bulk LCO structure has a perfect Co octahedra, the geometry optimization yields a slight distortion, modifying the location of valence band maximum (VBM) and conduction band minimum (CBM). Following the geometry optimization with PBEsol+ = 4 eV, LDA+ = 6 eV calculations are used to determine VBM/CBM and to generate trial wavefunctions. Orbitals for the optical and quasiparticle calculations are extracted from the neutral ground-state wavefunction. An optical excitation is produced by annihilating the electron at VBM and creating another electron at CBM. To find the optical gap, the energy of this excited state, , is subtracted from the energy of the ground state, , where is the number of electrons at the ground state. Therefore, the energy of the optical gap, , is defined as . For the quasiparticle gap calculations, the ground-state energies of positively and negatively charged cells, and , respectively, are used. The quasiparticle gap, , is defined as , which is equal to , such that is the electron affinity and is the ionization potential.
III Results and Discussion
III.1 Isotropic scaling of bulk LCO
Bulk LCO has a rhombohedral, Rc structure ( Å, ), with the Co3+ ions having valence structure Thornton et al. (1986); Autret et al. (2005); Oygarden et al. (2012). The ground spin state of Co3+ in bulk LCO (T 30 K) is reported to be LS Wollan and Koehler (1955); Koehler and Wollan (1957); Heikes et al. (1964); Raccah and Goodenough (1967, 1967); Goodenough (1958, 1967), though current experiments now question this long-held conclusion. In the low-temperature region, AFM correlations are shown to dominate the coexisting FM correlations Belanger et al. (2016); Durand et al. (2015a, b); Kaminsky et al. (2018); Durand et al. (2013); Belanger et al. (2016); Itoh et al. (1995). This is different from an LS scenario where all Co atoms would be diamagnetic. However, an AFM ground state cannot be claimed since no long-range magnetic ordering has been reported in LCO Koehler and Wollan (1957); Thornton et al. (1986); Radaelli and Cheong (2002); Belanger et al. (2016); Durand et al. (2015a, b). Any materials disorder can strongly affect the long-range ordering, such as a coexisting Co3O4 phase reported to exist up to 5 wt % in even high-quality LCO crystals Durand et al. (2015a, b). Surface FM in LCO is well known and can influence the magnetic ground state of bulk LCO depending on the materials preparation Señarı́s-Rodrı́guez and Goodenough (1995); Yan et al. (2004); Durand et al. (2015b). Similarly, in LCO nanoparticles, an empirical model with an FM surface and an AFM core magnetism has been found to be the best explanation for the magnetic response Durand et al. (2015a).
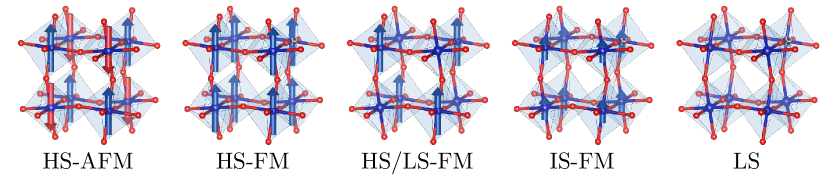
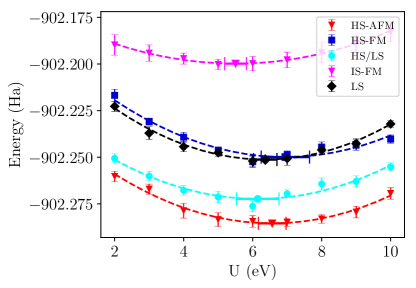
We first introduce the magnetic phases of LCO that will be studied throughout this work. Detailed illustrations are given in Fig. 1. Using the HS, IS, and LS spin states on Co3+ ions, we investigate: G-type antiferromagnetic high-spin (HS-AFM), ferromagnetic high-spin (HS-FM), ferromagnetic intermediate-spin (IS-FM), ferromagnetic G-type mixed high-spin and low-spin (HS-FM/LS) and the low-spin (LS, nonmagnetic) states of LCO. The HS-FM, IS-FM, LS-FM, and HS-FM/LS phases have been studied previously using DFT Mukhopadhyay et al. (2013); Buckeridge et al. (2016); Korotin et al. (1996); Rondinelli and Spaldin (2009); Ritzmann et al. (2014). Therefore, these phases are included in our work as well for comparison. We have also included the HS-AFM phase, which is often not considered in other theoretical works. The magnetic phases we studied can be represented using the 10-atom unit cell of bulk LCO, which can form an acceptable starting point prior to studying supercells with more complex magnetic orderings.
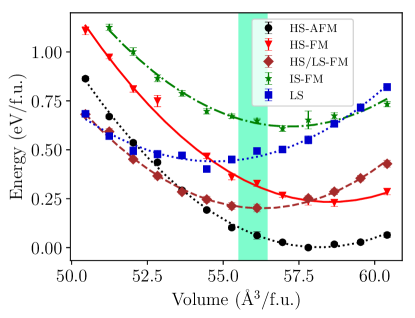
In Fig. 2, we present the DMC calculations with isotropic scaling in all three dimensions, to identify the DMC equilibrium volume and the DMC magnetic ground state of bulk LCO. In these calculations, we use the equilibrium LCO geometry from neutron diffraction experiments at 4 K (ICSD no. 201761) Thornton et al. (1986) without applying geometry relaxation. In Fig. 2, each fitted curve is obtained using the Murnaghan equation Murnaghan (1944). Fig. 2 shows that the HS-AFM state is predicted as the magnetic ground state. Given the recent experiments, which show stronger short-range AFM correlation up to 37 K Kaminsky et al. (2018); Durand et al. (2013); Belanger et al. (2016); Itoh et al. (1995), our results are worth further investigation. At the experimental volume, HS-FM/LS is the second-most-stable phase according to DMC, followed by HS-FM. Compression yields a HS-FM/LS state more favorable compared to the HS-AFM state. We find that the HS-FM and HS-AFM curves in Fig. 2 are almost parallel to each other within the investigated volume range. This can be explained by the isotropic scaling of the structure in Fig. 2; any rotation on the Co-O octahedra and change in Co-O-Co angle is not allowed.
In addition to the coexisting Co3O4 phase, the material may also have significant intrinsic defects in the powder form. In Section III.3, we discuss that photoemission and optical conductivity measurements yield a much smaller band gap compared to the Kohn-Sham gaps from DFT functionals Chainani et al. (1992); Abbate et al. (1993); Razzaque Sarker (2015); Tokura et al. (1998); Arima et al. (1993). It is known that oxygen vacancies can change the charge state of Co atoms, modifying the magnetic structure of LCO. However, to our knowledge, a complete study of possible intrinsic defects in LCO has not yet been done. Additionally, it has been claimed that a spin-canted magnetic structure can also be energetically more favorable compared to the magnetic states we studied in this work Seo et al. (2012).
Finally, in this section, we investigate the DMC equilibrium volume of HS-AFM bulk LCO. Fig. 2 shows that HS-AFM has an equilibrium volume of 58.2(1) Å3 per formula unit (eV/f.u.), which is nearly 4 larger than the experimental volume of 55.8(3). DMC overestimates the equilibrium volume by nearly 4, hence 1.3 for the lattice parameter. The accuracy of DMC on the equilibrium volume is comparable to the DFT functionals (see Section III.5 and Table 1). It was shown that the La pseudopotential we use overestimates the La2O3 equilibrium volume by nearly 3%, although it produces excellent cohesive energies and bulk moduli with DMC Santana et al. (2016). Given that the La3+ ionic radii is almost twice as large as Co3+ Shannon (1976), the La3+ ion can dominate the packing of the LCO crystal, and performance similar to La2O3 can be observed in equilibrium volume. We also calculated the standard formation enthalpy of LaCoO3 using DMC and found a formation energy of 2.62(1) eV eV/f.u. compared to the experimental standard formation enthalpy of 2.55(1) eV/f.u. Details of this calculation are found in the Supplementary Information sup . We must note that the DMC formation enthalpy calculation also yields the same HS-AFM phase. The HS-AFM phase is of lower energy compared to other magnetic phases; therefore, the other magnetic phases investigated yielded less accurate estimates of the formation energy up to 0.7 eV. Further benchmarks with DFT functionals on the ground-state energies and volumes are given in Section III.5.
III.2 Epitaxial LCO
In this section, we study the lattice modulation (i.e., superstructure formation) of the epitaxial LCO thin films on the strontium titanate (STO) substrate. We first examine how the simulation cells used in this section are constructed. LaCoO3 is known to grow in a cube-on-cube manner on many substrates including STO, since STO also has a cubic lattice with Å Fuchs et al. (2007). Therefore, we use a 222 (40-atom) pseudocubic cell of LCO using the starting ionic positions as mapped from the bulk LCO. We define and as the in-plane lattice parameters, whereas is the out-of-plane lattice parameter. Similarly, , , and are defined as the corresponding lattice directions. Using this starting cell, ionic relaxation is performed with PBEsol+ = 4 eV, where Å, while the is varied systematically using fixed lattice angles (90∘). The out-of-plane axis lattice constant, , is found to be 7.52 Å, which agrees with the experiment (7.524 Å) Mehta et al. (2015); Li et al. (2008) and PBE (7.54 Å) Kwon et al. (2014). Therefore, is kept constant for all the remaining calculations performed in this section.
III.2.1 Uniform La-La Separation
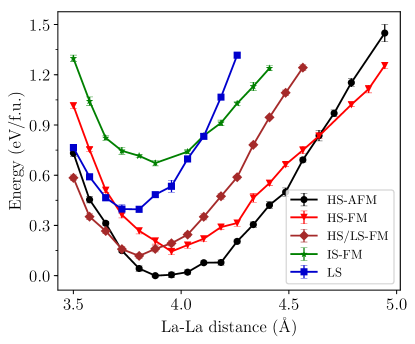
We initially studied the system with uniform La-La separation along the direction, by varying the size of , while keeping the remaining lattice parameters constant. Meanwhile, all the ionic degrees of freedom are optimized, except for the La atoms in the direction. The geometry optimization was performed separately for each point in Fig. 3. Our results are presented in Fig. 3. We compare the results in Fig. 3 to Fig. 2 and find that the results are qualitatively similar near each equilibrium. However, the results in Fig. 3 are more scattered compared to Fig. 2, due to the systematic contributions from the DFT relaxations, as previously observed in Rondinelli and Spaldin (2009). The energy difference between the minimum energy LS and HS-AFM structures is identical in Fig. 3 and Fig. 2 with 0.40(2) and 0.39(1) eV. However, the difference between the HS-AFM and the HS-FM minima reduces from 0.22(1) in Fig. 2 to 0.14(1) eV in Fig. 3. A similar reduction is also observed between the HS-AFM and the HS-FM/LS states, from 0.20(2) to 0.11(1) eV. Because the stability between HS-AFM and LS states remains unchanged, we can conclude that HS-FM and HS-FM/LS states become more stabilized with geometry optimization in Fig. 3. We find that the ionic relaxations on the Co and O atoms under uniaxial strain lead to distorted octahedra, compared to the perfect octahedra of the experimental structure we studied in Fig. 2. However, qualitative energetic ordering around the equilibrium in each case is unchanged between the two studies.
Another important result from Fig. 3 is the crossing between the HS-FM and HS-AFM energy curves at 4.6 Å. A crossing between HS-FM and HS-AFM states in Fig. 3 indicates that exchange coupling the constant changes its sign as a function of the La-La separation. Goodenough-Kanamori-Anderson (GKA) rules Goodenough (1958); Kanamori (1960); Anderson (1950) state that 180∘ superexchange of two magnetic ions with partially filled orbitals is strongly antiferromagnetic. However, a FM state can be stabilized over the an AFM state if orbital ordering exists in the FM state Kugel’ and Khomskii (1982). This point will be discussed further in Section III.4. The calculations in Fig. 3 are useful to show that (1) a crossing between HS-FM and HS-AFM states is possible as a function of strain and (2) the qualitative energetic ordering is identical both in Fig. 2 and 3. In Fig. 3, we have only studied a single magnetic phase throughout the bulk material. However, bright and dark stripes shown in the STEM images of epitaxial LCO samples Biškup et al. (2014); Mehta et al. (2015); Gazquez et al. (2011); Kwon et al. (2014); Choi et al. (2012); Qiao et al. (2015) clearly demonstrate a structural modification with two lateral domains. These domains can choose different magnetic ground states given the large variation in their La-La separations. Therefore, in Section III.2.2, we will study the structural modulation of epitaxial LCO along with the different magnetic phases applied on each lateral domain.
III.2.2 Modulated La-La Separation
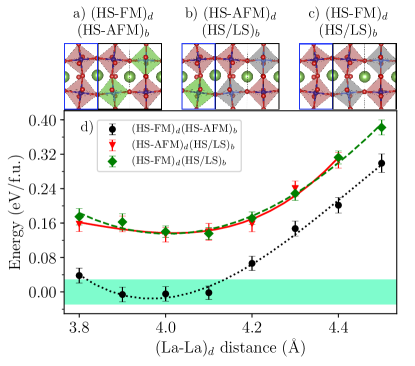
In Fig. 4, we study the lattice modulation under the epitaxial conditions with two coexisting magnetic phases. The definitions for the lattice parameters and directions here are identical to Section III.2. Here, the lattice parameters are fixed as , , and Å. However, the La-La distances along the direction are modulated to simulate the superstructure with two bright stripes and one dark stripe as seen in the STEM images Biškup et al. (2014); Mehta et al. (2015); Gazquez et al. (2011); Kwon et al. (2014); Choi et al. (2012); Qiao et al. (2015). To simulate this structure, we use a relation such as (La-La)d + 2 (La-La). Here, (La-La)d is the La-La separation in the dark stripes, whereas (La-La)b is the La-La separation in the bright stripes, both along the direction. In Fig. 4, (La-La)d is varied between 3.8 to 4.5 Å. La ionic degrees of freedom along the direction are kept fixed throughout the geometry optimization to maintain the lateral modulation. Geometry optimizations are performed separately for each point in Fig. 4.
We study three different spin configurations in the lattice-modulated superstructure defined above. The spin configurations we studied are shown in Fig. 4(a)–(c). Here, the up-spin Co3+ octahedra are shown with red octahedra, down-spin Co3+ octahedra are shown in green, and the nonmagnetic (LS) Co3+ octhedra are shown in gray. For example, (HS-FM)d(HS-AFM)b means HS-FM ordering is in the dark (larger, single-striped) region, whereas HS-AFM ordering is studied in the bright (smaller, double-striped) region as seen in the STEM images. In Fig. 4, energies on the y-axis are relative to the HS-AFM phase with uniform La-La separation (as in Fig. 3) for every point. All magnetic states studied in Fig. 4, including (HS-FM)d(HS-AFM)b, have an optimal (La-La)d distance of 4.0 Å, meaning (La-La)b is 3.85 Å, which is slightly larger than the lattice parameter of the STO unit cell (3.905 Å). We list the results obtained from Fig. 4(d) below for a better discussion.
-
i)
It costs almost no energy to induce a lattice modulation with (HS-FM)d(HS-AFM)b magnetic structure under epitaxial strain. STEM images from the LCO on STO samples Kwon et al. (2014); Biškup et al. (2014); Mehta et al. (2015) show that the immediate LCO on STO boundary has very small lattice modulation. Although most studies focus on the emergence of ferromagnetism within the LCO layer (which has much larger lattice modulation), we show that a FM layer along the LCO/STO boundary can also be energetically favorable.
-
ii)
To stabilize experimentally observed (La-La)d (4.5 Å), an additional 0.3 eV/f.u. is required.
-
iii)
Substitutional or vacancy defect formations may be needed to drive lattice separations, (La-La)d, of the magnitude observed in experiments. Oxygen vacancy formation has been suggested as a likely defect in the dark-striped regions, but this would mean a change from Co3+ to Co2+ charge state as well. So far, this has not been observed in the Co electron energy loss spectra Kwon et al. (2014); Biškup et al. (2014); Mehta et al. (2015).
-
iv)
As the (La-La)d distance is increased, energies of the distinct configurations start approaching each other with less than 2 uncertainty, with 0.1 eV. Meaning that the magnetic configurations not studied in Fig. 4 could also yield very similar energies at (La-La)d separation of 4.5 Å.
| HS-AFM | |
|---|---|
| LDA(+=6 eV) | 1.94† |
| DMC (XX) | 3.77 0.12 |
| DMCQP (XX) | 3.87 0.22 |
| LS | |
| LDA(+=4 eV) | 0.72∗, 0.87∗ Ritzmann et al. (2014), 0.95† |
| LDA(+=6 eV) | 1.15∗, 1.45† |
| LDA(+=7 eV) | 1.23∗, 1.6†, 1.72 Hsu et al. (2009) |
| LDA(+=7.8 eV, =0.9 eV) | 1.23∗, 2.06 Korotin et al. (1996) |
| PBE(+=4 eV) | 1.12∗, 1.12∗Ritzmann et al. (2014), |
| PBE(+=5.4 eV) | 1.25∗, 1.58†, 1.5 Kniaek et al. (2005) |
| PBE(+=6 eV) | 1.34∗, 1.7† |
| B3LYP | 2.2 Mukhopadhyay et al. (2013) |
| HSE | 2.38∗, 2.44 He and Franchini (2012), 2.54† |
| PBE0 | 2.42∗, 2.4∗ Gryaznov et al. (2010), 3.29†, 3.2Gryaznov et al. (2010) |
| DMC () | 3.65 0.06 |
| DMCQP () | 3.7 0.1 |
| Experimental | |
| Optical conductivity | 0.1-1.1 Razzaque Sarker (2015); Tokura et al. (1998); Arima et al. (1993) |
| X-ray photoemission spectroscopy | 0.6-0.9 Chainani et al. (1992); Abbate et al. (1993) |
| Photoluminescence and UV/Vis | 3.44-3.50 Jayapandi et al. (2018a, b) |
III.3 Electronic structure, quasiparticle and optical gaps
In Table 1, we show the experimental, DFT Kohn-Sham, and DMC optical/quasiparticle gaps for the HS-AFM and LS states of LCO. However, before presenting the DMC band gaps, we first benchmark the DFT band gaps of LS LCO using our calculations and the results collected from the literature. Because QE-RRKJ orbitals are used to perform ground-state and excited-state DMC calculations, it is important to benchmark their performance with respect to the other codes and the pseudopotentials to test any systematic difference. The results with an asterisk (∗) in Table 1 are VASP-PAW calculations, whereas all the calculations with (†) are using QE-RRKJ. All electron band gap calculations using WIEN2k-FLAPW Blaha and J. ; Hsu et al. (2009); Kniaek et al. (2005), CRYSTAL-LCAO Dovesi et al. (2018), and LMTO Korotin et al. (1996) are taken from the literature. Unless a reference is given next to a value, all the calculations in Table 1 are performed by us. A general trend we identified in these DFT calculations is that harder pseudopotentials Krogel et al. (2016) and all-electron calculations yield larger band gaps compared to softer core pseudopotentials in VASP-PAW Kresse and Joubert (1999). In LDA+( 7 eV) calculations, VASP-PAW yields a gap of 1.23, whereas a gap with 1.72 eV Hsu et al. (2009) is found using WIEN2k-FLAPW. Similarly, for LDA7.8 eV and 0.9 eV calculations (using Liechtenstein’s rotationally invariant method Liechtenstein et al. (1995)), VASP-PAW underestimates the band gap by nearly 0.8 eV compared to LMTO Korotin et al. (1996). We found that the VASP LDA band gap is identical to the LDA 7 eV band gap (1.23 eV) using Dudarev’s simplified scheme (), meaning that the implementation has only minimal effect on the band gaps. Interestingly, a large discrepancy was reported by Gryaznov et. al. Gryaznov et al. (2010) between the PBE0 VASP-PAW and CRYSTAL-LCAO band gaps (2.4 eV vs. 3.2 eV). Our VASP-PAW DFT+4 eV and hybrid-DFT calculations are in very good agreement with the literature; therefore, we validate the VASP-PAW results from Gryaznov et. al. Gryaznov et al. (2010). On the other hand, the benchmark on the QE-RRKJ band gaps indicates that QE-RRKJ band gaps are closer to the WIEN2k-FLAPW gaps with respect to the VASP-PAW gaps. The QE-RRKJ PBE0 band gap is in very good agreement with the CRYSTAL-LCAO, again indicating an estimate that is 0.8 eV larger than the VASP-PAW PBE0 band gap.
The hybrid-DFT band gap values are rather large compared to some of the experiments claiming 0.6–0.9 eV from photoemission measurements Chainani et al. (1992); Abbate et al. (1993), and at 0.1–1.1 eV from optical conductivity measurements Razzaque Sarker (2015); Tokura et al. (1998); Arima et al. (1993). However, the recent photoluminescence and UV-Vis spectroscopy measurements yield a gap of nearly 3.5 eV which agrees very well with the CRYSTAL-LCAO and QE-RRKJ PBE0 calculations. There can be multiple reasons to explain this discrepancy: (1) The interpretation of the experimental spectra has been challenging. While a value of 0.6 eV is reported by Chainani et. al. Chainani et al. (1992), the same data are interpreted as 2–3 eV by Saitoh et. al. Saitoh et al. (1997). (2) It is also possible that some of the measured excitations may correspond to internal - transitions. We have reported a similar discrepancy in the band gap of CoO, where the band gaps were found to be between 2.5 and 6 eV using different experimental techniques Saritas et al. (2018b). However, in CoO, ellipsometry studies have indicated that the band gap is observed at 5.43 eV, while the lower energy excitations (around 2–3 eV) may correspond to the internal - transitions Dong et al. (2007). (3) The flexible nature of the magnetic state of LCO may also play a role in the discrepancy between some of the theoretical and experimental results. Fig. 2 shows that different magnetic states of Co3+ (e.g., HS or IS) can be accessible within 0.7 eV per Co of the ground state. This may suggest that changing the spin of a single Co3+ ion can be achieved within an excitation of similar magnitude. Therefore, we believe that additional experimental studies may be needed to understand the optical transitions in LCO.
Excited-state DMC calculations require identifying the conduction band and valence band wavevectors of the excitation. Therefore, we obtained band structures using LDA=6 eV to identify VBM and CBM. The band structures of both materials are given in the Supplementary Information sup . We find that both HS-AFM and LS LCO are indirect band gap materials, where indirect and direct band gap energies differ less than 0.1 eV in the LDA+ calculations. HS-AFM LCO has a well defined valence band maximum at with a bandwidth of 1 eV at the valence band. However, HS-AFM LCO conduction band and the LS LCO conduction and valence bands are found to be rather flat with bandwidths smaller than 0.2 eV. Therefore, we study the direct band gaps in the DMC calculations, since it provides more flexible choice for the supercell tiling matrices to eliminate the finite size errors. We study HS-AFM direct band gap at , while the LS-LCO is studied at . The reported DMC band gap values are obtained from the finite-size extrapolation in Fig. 5. We find DMC band gaps of roughly 3.7(2) eV for both LS and HS-AFM LCO. This agrees very well with the photoluminescence and UV/Vis Jayapandi et al. (2018a, b) experiments and also with PBE0, where a band gap of 3.2–3.3 eV is obtained using QE-RRKJ and CRYSTAL-LCAO. DMC band gaps are larger than the hybrid-DFT band gaps as observed previously Saritas et al. (2018a, b); Kent et al. (1999). We used a simple single-determinant scheme to obtain the band gaps from DMC; therefore, our results should be treated as an upper bound due to the fixed node bias, which may not fully cancel between the ground and excited states. Multideterminant wavefunctions can be used to optimize the excited-state nodal surface and control fixed node bias, although studies for extended systems are very limited Scemama et al. (2018); Blunt and Neuscamman (2019, 2017), because of the significant computational resources that would be required using DMC. A very recent work on VMC, however, shows that nodal surface errors can be minimized using orbital rotations on the single-determinant wavefunction Zhao and Neuscamman (2019). DMC quasiparticle and optical gaps in Fig. 5 are identical given the statistical uncertainties, suggesting very small exciton binding energies.
III.4 Orbital ordering in LCO
Superexchange interactions usually lead to strong AFM when the transition metal -orbitals containing single electrons overlap over the intermediate anions (ligands) near linear angles Goodenough (1958); Kanamori (1960); Anderson (1950). However, in broken symmetry states, orbital ordering may emerge, leading to an alternating pattern of localized occupied orbitals Pavarini et al. (2016). If orbital ordering occurs, the filled orbital at one site can overlap with a vacant orbital in the adjacent site and lead to relatively weaker FM interactions Kugel’ and Khomskii (1982). Orbital ordering in LCO was initially proposed for the formation of the IS-FM state Korotin et al. (1996). Co3+ ions have the configuration in the IS-FM state where the ordering is observed on the majority-spin orbitals. In HS-FM LCO, however, the majority-spin orbitals on Co3+ are completely filled. Therefore, the orbital ordering can only form over the minority spin orbitals as the hopping between the filled parallel spin electrons is forbidden by the Pauli principle. The superexchange mechanism among the minority spin electrons of the Co3+ ions in the HS-FM phase LCO is analogous to the superexchange of ions such as Ti3+ in LaTiO3 and YTiO3.
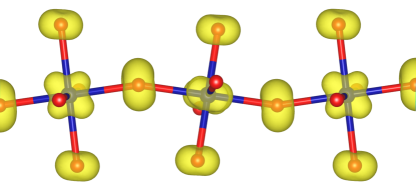
In Fig. 6, we plot the band decomposed charge density at the VBM of the minority spin electrons for HS-FM LCO to demonstrate the orbital ordering. The ordering alternates between the dxy and dxz orbitals. As expected, a similar orbital ordering has not been observed for the HS-AFM state. In the case of orbital ordering, GKA rules do not apply, and the hopping from a filled to a degenerate empty orbital favors the FM interaction over the AFM interaction. The presence of orbital ordering is also supported by the difference in octahedra distortion indices Baur (1974) found on the Co-O octahedra. We find that the distortion index monotonously increases in both HS-FM and HS-AFM states as a function of increased uniaxial strain, while the distortion index is less than 2% near the equilibrium of each curve.
III.5 Comparisons with DFT methods
Several theoretical approaches have been used to study the role of various external stimuli and the environment of the Co atom on the spin state of bulk and epitaxially strained LCO. Density functional mean field Křápek et al. (2012); Izquierdo et al. (2014) and quantum chemistry calculations Wang et al. (2015); Siurakshina et al. (2010); Eder (2010); Takahashi et al. (1998); Saitoh et al. (1997) have been extensively used for this end Hsu et al. (2009); Kushima et al. (2010); Han and Yildiz (2011); Mukhopadhyay et al. (2013); Ritzmann et al. (2014). DFT methods with Hubbard- Anisimov et al. (1991); Dudarev et al. (1998) corrections and exchange mixing Heyd et al. (2003); Becke (1993) are often highly tuned to reproduce bulk spin ground states, band gaps, and geometric properties reported experimentally Buckeridge et al. (2016); Rondinelli and Spaldin (2009). The accuracy of these methods depends critically on the corrections applied. Experimental properties might also depend strongly on the presence of defects and strain. Therefore, the use of a more accurate method, such as DMC, and benchmarking is rather critical for consistent results.
In Table 2, we present our benchmark on the ground-state energetic, magnetic, and structural properties of LCO. Here, the geometry relaxations are performed for the DFT calculations, whereas DMC results are transferred from Fig. 2. Table 2 shows that, with increased values, the HS-AFM state is stabilized over the LS state for all DFT functionals. For LDA, the crossing between LS and HS-AFM states occurs at a value of 4–6 eV, whereas for PBE this crossing occurs with a smaller value of between 0–2 eV. However, with SCAN, the correction is not needed to stabilize the HS-AFM state over the LS state. We find that hybrid-DFT functionals, HSE and B3LYP, also predict the HS-AFM state to be more stable than the LS state. Interestingly, Table 2 shows that it is not possible to stabilize the LS state over the HS-AFM state with the SCAN+ approach. This contrasts with LDA and PBE, where tuning the + parameter to smaller values allows for studying the LS state as the ground state of LCO Korotin et al. (1996). Various examples in the literature suggest a reduced self-interaction error and an improvement in performance with SCAN over GGA Perdew et al. (2017); Peng and Perdew (2017); Kitchaev et al. (2016); Sai Gautam and Carter (2018). This is also observed in our calculations such that significantly lower values are required with SCAN to reproduce equivalent results with GGA+, indicating a possible improved description of the exchange interactions is provided with SCAN. We previously observed that SCAN provided an improvement over PBE in predicting the energy differences between CoO polymorphs Saritas et al. (2018b).
| (eV) | Ground state | ||
|---|---|---|---|
| LDA | - | LS | -7.16 |
| LDA(+=2 eV) | 0.52 | LS | -7.51 |
| LDA(+=4 eV) | 0.21 | LS | -7.70 |
| LDA(+=6 eV) | -0.19 | HS-AFM | -2.54 |
| LDA(+=8 eV) | -0.65 | HS-AFM | -4.02 |
| PW91 | - | LS | -0.32 |
| PBEsol | - | LS | -4.52 |
| PBEsol(+=4 eV) | -0.19 | HS-AFM | 1.70 |
| PBE | - | LS | -0.21 |
| PBE(+=2 eV) | -0.04 | HS-FM/LS | 2.56 |
| PBE(+=4 eV) | -0.38 | HS-AFM | 5.78 |
| PBE(+=6 eV) | -0.77 | HS-AFM | 5.40 |
| PBE(+=8 eV) | -1.20 | HS-AFM | 4.50 |
| SCAN | -0.77 | HS-AFM | 3.50 |
| SCAN(+=2 eV) | -1.43 | HS-AFM | 3.55 |
| SCAN(+=4 eV) | -1.95 | HS-AFM | 2.77 |
| SCAN(+=6 eV) | -2.45 | HS-AFM | 2.06 |
| SCAN(+=8 eV) | -2.99 | HS-AFM | 1.08 |
| B3LYP | -0.09 | HS-AFM | 7.80 |
| HSE | -0.19 | HS-AFM | -4.30 |
| DMC | -0.40(2) | HS-AFM | 4.30(5) |
Percent errors for the equilibrium volumes are also presented for each method in Table 1. As expected, LDA largely underestimates the equilibrium volume, while PBE underestimates with a much smaller percentage. PW91, PBEsol+ = 4 eV, and SCAN+ = 8 eV have are the most accurate in reproducing equilibrium volume. The performance of the PBEsol+ = 4 eV functional has been reported elsewhere for bulk LCO Belanger et al. (2016). As explained previously, the PBEsol+ = 4 eV functional is used throughout this work to optimize the systems’ structural parameters due to the functional’s superior performance. Considering all the factors investigated in Table 2, we find that PBE+ = 4 eV gives the best compromise in all properties compared to DMC. values of 3–4 eV were reported to be typical for PBE and the PAW pseudopotentials we use in binary Co-oxides, in terms of giving a reasonable compromise across different properties Seo et al. (2012); Wang et al. (2006); Jain et al. (2011).
IV Conclusions
DMC has consistently produced accurate structural and energetic properties for challenging materials problems, such as improving DFT approximations on transition-metal oxides. Because the accuracy of DMC is established in materials with minimal controversy between the experiments, we believe our results are significant enough to explain the experimental and theoretical controversies observed for various physical properties of LCO.
We studied bulk and epitaxial LCO subject to uniaxial strain and lattice modulation. We first found that bulk LCO has an AFM ground state that is of lower energy compared to the nonmagnetic state. This is in contrast to long-standing experiments; our experiments support this idea. However, experimental characterization of the magnetic ground state of LCO is a challenging problem that has been actively researched since the 1950s Koehler and Wollan (1957). In our calculations, we also find that a magnetic state with net FM can be stabilized through uniaxial strain or compression. However, our study shows that the periodic structural deformation observed experimentally is not stabilized by the FM state. We showed that additional external factors, with an energy comparable to 0.3 eV/f.u., should play a role in generating lattice modulation of epitaxial LCO with experimentally observed La-La separation.
We calculated the optical and quasiparticle gaps of LCO and found that DFT and DMC predictions are significantly larger than the experimental values. We explained this discrepancy and showed that the spin transitions below 0.7 eV may explain the low excitation energies observed in the experiments. In addition, we pointed out that possible defects in the structure should also be considered. A subsequent study involving defects is under way.
In summary, we calculated the electronic, structural, and magnetic properties of bulk and epitaxial LCO using a range of density functionals and the DMC method to study the origin of FM in LCO thin films. We found the ground state of bulk LCO to be magnetic, while the G-type HS-AFM structure was the lowest energy among the structures considered. We discussed the significance of this result in light of recent experimental results and showed that, under epitaxial strain, a FM phase can appear with little extra energy and small lattice distortion. We pointed out that defects can provide sufficient energy to yield experimentally observed La-La separations in epitaxial LCO that is nearly 4.5 Å. We found that DFT and DMC electronic gaps are significantly larger than experimental energy gaps, suggesting possible intrinsic defects.
Acknowledgements.
We are grateful for helpful discussions with Dr. Jaime Fernandez-Baca and Dr. Feng Ye on analyzing our neutron diffraction experiments. The work was supported by the Materials Sciences and Engineering Division of the Office of Basic Energy Sciences, US Department of Energy (DOE). Computational resources were provided by the Oak Ridge Leadership Computing Facility at the Oak Ridge National Laboratory, supported by the Office of Science of the DOE under Contract no. DE-AC05-00OR22725.*
Appendix A DMC wavefunction optimization and convergence tests
References
- Dagotto (2005) E. Dagotto, Science (80-. ). 309, 257 (2005).
- Tokura and Nagaosa (2000) Y. Tokura and N. Nagaosa, Science (80-. ). 288, 462 (2000).
- Ahn et al. (2004) K. H. Ahn, T. Lookman, and A. R. Bishop, Nature 428, 401 (2004).
- Biškup et al. (2014) N. Biškup, J. Salafranca, V. Mehta, M. P. Oxley, Y. Suzuki, S. J. Pennycook, S. T. Pantelides, and M. Varela, Phys. Rev. Lett. 112, 087202 (2014).
- Mehta et al. (2015) V. V. Mehta, N. Biskup, C. Jenkins, E. Arenholz, M. Varela, and Y. Suzuki, Phys. Rev. B 91, 144418 (2015).
- Gazquez et al. (2011) J. Gazquez, W. Luo, M. P. Oxley, M. Prange, M. A. Torija, M. Sharma, C. Leighton, S. T. Pantelides, S. J. Pennycook, and M. Varela, Nano Lett. 11, 973 (2011).
- Kwon et al. (2014) J. H. Kwon, W. S. Choi, Y. K. Kwon, R. Jung, J. M. Zuo, H. N. Lee, and M. Kim, Chem. Mater. 26, 2496 (2014).
- Choi et al. (2012) W. S. Choi, J. H. Kwon, H. Jeen, J. E. Hamann-Borrero, A. Radi, S. MacKe, R. Sutarto, F. He, G. A. Sawatzky, V. Hinkov, M. Kim, and H. N. Lee, Nano Lett. 12, 4966 (2012).
- Qiao et al. (2015) L. Qiao, J. H. Jang, D. J. Singh, Z. Gai, H. Xiao, A. Mehta, R. K. Vasudevan, A. Tselev, Z. Feng, H. Zhou, S. Li, W. Prellier, X. Zu, Z. Liu, A. Borisevich, A. P. Baddorf, and M. D. Biegalski, Nano Lett. 15, 4677 (2015).
- Koehler and Wollan (1957) W. C. Koehler and E. O. Wollan, J. Phys. Chem. Solids 2, 100 (1957).
- Zobel et al. (2002) C. Zobel, M. Kriener, D. Bruns, J. Baier, M. Gruninger, T. Lorenz, P. Reutler, and A. Revcolevschi, Phys. Rev. B 66, 020402(R) (2002).
- Klie et al. (2007) R. F. Klie, J. C. Zheng, Y. Zhu, M. Varela, J. Wu, and C. Leighton, Phys. Rev. Lett. 99, 047203 (2007).
- Radaelli and Cheong (2002) P. G. Radaelli and S. W. Cheong, Phys Rev B 66, 094408 (2002).
- Señarı́s-Rodrı́guez and Goodenough (1995) M. Señarı́s-Rodrı́guez and J. Goodenough, J. Solid State Chem. 116, 224 (1995).
- Podlesnyak et al. (2006) A. Podlesnyak, S. Streule, J. Mesot, M. Medarde, E. Pomjakushina, K. Conder, A. Tanaka, M. W. Haverkort, and D. I. Khomskii, Phys. Rev. Lett. 97, 247208 (2006).
- Saitoh et al. (1997) T. Saitoh, T. Mizokawa, A. Fujimori, M. Abbate, Y. Takeda, and M. Takano, Phys. Rev. B 55, 4257 (1997).
- Asai et al. (1998) K. Asai, A. Yoneda, O. Yokokura, J. M. Tranquada, G. Shirane, and K. Kohn, J. Phys. Soc. Japan 67, 290 (1998).
- Phelan et al. (2006) D. Phelan, D. Louca, S. Rosenkranz, S.-H. Lee, Y. Qiu, P. J. Chupas, R. Osborn, H. Zheng, J. F. Mitchell, J. R. D. Copley, J. L. Sarrao, and Y. Moritomo, Phys. Rev. Lett. 96, 027201 (2006).
- Zhou et al. (2007) S. Zhou, L. Shi, J. Zhao, L. He, H. Yang, and S. Zhang, Phys. Rev. B 76, 172407 (2007).
- Fuchs et al. (2007) D. Fuchs, C. Pinta, T. Schwarz, P. Schweiss, P. Nagel, S. Schuppler, R. Schneider, M. Merz, G. Roth, and H. v. Löhneysen, Phys. Rev. B 75, 144402 (2007).
- Fuchs et al. (2009) D. Fuchs, L. Dieterle, E. Arac, R. Eder, P. Adelmann, V. Eyert, T. Kopp, R. Schneider, D. Gerthsen, and H. v. Löhneysen, Phys. Rev. B 79, 024424 (2009).
- W. Kohn and L. J. Sham (1965) W. Kohn and L. J. Sham, Phys. Rev. 140, A1133 (1965).
- Hohenberg and Kohn (1964) P. Hohenberg and W. Kohn, Phys. Rev. B 136, B864 (1964).
- Ma et al. (2013) F. Ma, S. Zhang, and H. Krakauer, New J. Phys. 15 (2013), arXiv:1211.4635 .
- Ceperley and Alder (1980) D. M. Ceperley and B. J. Alder, Phys. Rev. Lett. 45, 566 (1980).
- Foulkes et al. (2001) W. Foulkes, L. Mitas, R. Needs, and G. Rajagopal, Rev. Mod. Phys. 73, 33 (2001).
- Kolorenc et al. (2010) J. Kolorenc, S. Hu, and L. Mitas, Phys. Rev. B 82, 115108 (2010).
- Yu et al. (2015) J. Yu, L. K. Wagner, and E. Ertekin, The J. Chem. Phys. 143, 224707 (2015).
- Needs and Towler (2003) R. J. Needs and M. D. Towler, Int. J. Mod. Phys. B 17, 5425 (2003).
- Mitra et al. (2015) C. Mitra, J. T. Krogel, J. A. Santana, and F. A. Reboredo, J. Chem. Phys. 143, 164710 (2015).
- Schiller et al. (2015) J. A. Schiller, L. K. Wagner, and E. Ertekin, Phys. Rev. B 92, 235209 (2015).
- Saritas et al. (2018a) K. Saritas, J. T. Krogel, P. R. C. Kent, and F. A. Reboredo, Phys. Rev. Materials 2, 085801 (2018a).
- Saritas et al. (2017) K. Saritas, T. Mueller, L. Wagner, and J. C. Grossman, J. Chem. Theory Comput. 13, 1943 (2017).
- Trail et al. (2017) J. Trail, B. Monserrat, P. López Ríos, R. Maezono, and R. J. Needs, Phys. Rev. B 95, 121108(R) (2017).
- Luo et al. (2016) Y. Luo, A. Benali, L. Shulenburger, J. T. Krogel, O. Heinonen, and P. R. C. Kent, New J. Phys. 18, 113049 (2016).
- Benali et al. (2016) A. Benali, L. Shulenburger, J. T. Krogel, X. Zhong, P. R. C. Kent, and O. Heinonen, Phys. Chem. Chem. Phys. 18, 1 (2016).
- Zheng and Wagner (2015) H. Zheng and L. K. Wagner, Phys. Rev. Lett. 114, 176401 (2015).
- Kylänpää et al. (2017) I. Kylänpää, J. Balachandran, P. Ganesh, O. Heinonen, P. R. C. Kent, and J. T. Krogel, Phys. Rev. Materials 1, 065408 (2017).
- Yu et al. (2017) J. Yu, L. K. Wagner, and E. Ertekin, Phys. Rev. B 95, 075209 (2017).
- Santana et al. (2015) J. A. Santana, J. T. Krogel, J. Kim, P. R. C. Kent, and F. A. Reboredo, The J. Chem. Phys. 142, 164705 (2015).
- Shin et al. (2017) H. Shin, Y. Luo, P. Ganesh, J. Balachandran, J. T. Krogel, P. R. C. Kent, A. Benali, and O. Heinonen, Phys. Rev. Materials 1, 073603 (2017).
- Shin et al. (2018) H. Shin, A. Benali, Y. Luo, E. Crabb, A. Lopez-Bezanilla, L. E. Ratcliff, A. M. Jokisaari, and O. Heinonen, Phys. Rev. Materials 2, 075001 (2018).
- Saritas et al. (2019) K. Saritas, W. Ming, M.-H. Du, and F. A. Reboredo, J. Phys. Chem. Lett. 10, 67 (2019).
- Shulenburger and Mattsson (2013) L. Shulenburger and T. R. Mattsson, Phys. Rev. B 88, 245117 (2013).
- Needs et al. (2010) R. J. Needs, M. D. Towler, N. D. Drummond, and P. López Ríos, J. Phys.: Condensed Matter 22, 023201 (2010).
- Saritas et al. (2018b) K. Saritas, J. T. Krogel, and F. A. Reboredo, Phys. Rev. B 98, 155130 (2018b).
- Santana et al. (2016) J. A. Santana, J. T. Krogel, P. R. C. Kent, and F. A. Reboredo, J. Chem. Phys. 144, 174707 (2016).
- Santana et al. (2017) J. A. Santana, J. T. Krogel, P. R. C. Kent, and F. A. Reboredo, J. Chem. Phys. 147, 034701 (2017).
- Belanger et al. (2016) D. P. Belanger, T. Keiber, D. Bridges, A. M. Durand, A. Mehta, H. Zheng, J. F. Mitchell, and V. Borzenets, J. Phys. Condens. Matter 28, 025602 (2016).
- Durand et al. (2015a) A. M. Durand, D. P. Belanger, T. J. Hamil, F. Ye, S. Chi, J. A. Fernandez-Baca, C. H. Booth, Y. Abdollahian, and M. Bhat, J. Phys. Condens. Matter 27, 176003 (2015a).
- Durand et al. (2015b) A. M. Durand, T. J. Hamil, D. P. Belanger, S. Chi, F. Ye, J. A. Fernandez-Baca, Y. Abdollahian, and C. H. Booth, J. Phys. Condens. Matter 27, 126001 (2015b).
- Kaminsky et al. (2018) G. M. Kaminsky, D. P. Belanger, F. Ye, J. A. Fernandez-Baca, J. Wang, M. Matsuda, and J. Q. Yan, Phys. Rev. B 97, 024418 (2018).
- Durand et al. (2013) A. M. Durand, D. P. Belanger, C. H. Booth, F. Ye, S. Chi, J. A. Fernandez-Baca, and M. Bhat, J. Phys. Condens. Matter 25, 382203 (2013).
- Itoh et al. (1995) M. Itoh, M. Sugahara, K. Motoya, and I. Natori, J. Phys. Soc. Japan 64, 3967 (1995).
- Perdew and Zunger (1981) J. P. Perdew and A. Zunger, Phys. Rev. B 23, 5048 (1981).
- Perdew et al. (1996) J. P. Perdew, K. Burke, and M. Ernzerhof, Phys. Rev. Lett. 77, 3865 (1996).
- Perdew et al. (2008) J. P. Perdew, A. Ruzsinszky, G. I. Csonka, O. A. Vydrov, G. E. Scuseria, L. A. Constantin, X. Zhou, and K. Burke, Phys. Rev. Lett. 100, 136406 (2008).
- Perdew et al. (2017) J. P. Perdew, W. Yang, K. Burke, Z. Yang, E. K. U. Gross, M. Scheffler, G. E. Scuseria, T. M. Henderson, I. Y. Zhang, A. Ruzsinszky, H. Peng, J. Sun, E. Trushin, and A. Görling, PNAS 114, 2801 (2017).
- Becke (1993) A. D. Becke, J. Chem. Phys. 98, 5648 (1993).
- Heyd et al. (2003) J. Heyd, G. E. Scuseria, and M. Ernzerhof, J. Chem. Phys. 118, 8207 (2003).
- Adamo and Barone (1999) C. Adamo and V. Barone, J. Chem. Phys. 110, 6158 (1999).
- Anisimov et al. (1997) V. I. Anisimov, F. Aryasetiawan, and A. I. Lichtenstein, J. Phys.: Condens. Matter 9, 767 (1997).
- Dudarev et al. (1998) S. L. Dudarev, G. A. Botton, S. Y. Savrasov, C. J. Humphreys, and A. P. Sutton, Phys. Rev. B 57, 1505 (1998).
- Archibald et al. (2018) R. Archibald, J. T. Krogel, and P. R. Kent, J. Chem. Phys. 149, 164116 (2018).
- Sorella and Capriotti (2010) S. Sorella and L. Capriotti, J. Chem. Phys. 133, 234111 (2010).
- Thornton et al. (1986) G. Thornton, B. C. Tofield, and A. W. Hewat, J. Solid State Chem. 61, 301 (1986), 0112017 .
- Kresse and Furthmüller (1996) G. Kresse and J. Furthmüller, Phys. Rev. B 54, 11169 (1996).
- Kresse and Joubert (1999) G. Kresse and D. Joubert, Phys. Rev. B 59, 1758 (1999).
- Kim et al. (2018) J. Kim et al., J. Phys.: Condens. Matter 30, 195901 (2018).
- Krogel (2016) J. T. Krogel, Comput. Phys. Commun. 198, 154 (2016).
- Slater (1929) J. C. Slater, Phys. Rev. 34, 1293 (1929).
- Jastrow (1955) R. Jastrow, Phys. Rev. 98, 1479 (1955).
- Giannozzi et al. (2009) P. Giannozzi et al., J. Phys.: Condens. Matter 21, 395502 (2009).
- Drummond et al. (2004) N. D. Drummond, M. D. Towler, and R. J. Needs, Phys. Rev. B 70, 235119 (2004).
- Mitáš et al. (1991) L. Mitáš, E. L. Shirley, and D. M. Ceperley, The J. Chem. Phys. 95, 3467 (1991).
- Umrigar et al. (2007) C. J. Umrigar, J. Toulouse, C. Filippi, S. Sorella, and R. G. Hennig, Phys. Rev. Lett. 98, 110201 (2007).
- Umrigar and Filippi (2005) C. J. Umrigar and C. Filippi, Phys. Rev. Lett. 94, 150201 (2005).
- Kwon et al. (1993) Y. Kwon, D. M. Ceperley, and R. M. Martin, Phys. Rev. B 48, 12037 (1993).
- Kwon et al. (1998) Y. Kwon, D. M. Ceperley, and R. M. Martin, Phys. Rev. B 58, 6800 (1998).
- López Ríos et al. (2006) P. López Ríos, A. Ma, N. D. Drummond, M. D. Towler, and R. J. Needs, Phys. Rev. E 74, 066701 (2006).
- Bajdich et al. (2010) M. Bajdich, M. L. Tiago, R. Q. Hood, P. R. C. Kent, and F. A. Reboredo, Phys. Rev. Lett. 104, 193001 (2010).
- (82) See Supplementary Information at …
- Casula et al. (2010) M. Casula, S. Moroni, S. Sorella, and C. Filippi, J. Chem. Phys. 132, 154113 (2010).
- Dzubak et al. (2017) A. L. Dzubak, J. T. Krogel, and F. A. Reboredo, The J. Chem. Phys. 147, 024102 (2017).
- Krogel and Kent (2017) J. T. Krogel and P. R. C. Kent, The J. Chem. Phys. 146, 244101 (2017).
- Williamson et al. (1997) A. J. Williamson, G. Rajagopal, R. J. Needs, L. M. Fraser, W. M. C. Foulkes, Y. Wang, and M.-Y. Chou, Phys. Rev. B 55, R4851 (1997).
- Kent et al. (1999) P. R. C. Kent, R. Q. Hood, A. J. Williamson, R. J. Needs, W. M. C. Foulkes, and G. Rajagopal, Phys. Rev. B 59, 1917 (1999).
- Drummond et al. (2008) N. D. Drummond, R. J. Needs, A. Sorouri, and W. M. C. Foulkes, Phys. Rev. B 78, 125106 (2008).
- Fraser et al. (1996) L. M. Fraser, W. M. C. Foulkes, G. Rajagopal, R. J. Needs, S. D. Kenny, and A. J. Williamson, Phys. Rev. B 53, 1814 (1996).
- (90) “Opium pseudopotential generator,” http://opium.sourceforge.net.
- Krogel et al. (2016) J. T. Krogel, J. A. Santana, and F. A. Reboredo, Phys. Rev. B 93, 075143 (2016).
- Luo et al. (2018) Y. Luo, K. P. Esler, P. R. C. Kent, and L. Shulenburger, J. Chem. Phys 149, 84107 (2018).
- Togo and Tanaka (2018) A. Togo and I. Tanaka, (2018), arXiv:1808.01590 .
- Hinuma et al. (2017) Y. Hinuma, G. Pizzi, Y. Kumagai, F. Oba, and I. Tanaka, Comput. Mater. Sci. 128, 140 (2017).
- Lloyd-Williams and Monserrat (2015) J. H. Lloyd-Williams and B. Monserrat, Phys. Rev. B 92, 184301 (2015).
- Autret et al. (2005) C. Autret, J. Hejtmánek, K. Knížek, M. Maryško, Z. Jirák, M. Dlouhá, and S. Vratislav, J. Phys. Condens. Matter 17, 1601 (2005).
- Oygarden et al. (2012) V. Oygarden, H. L. Lein, and T. Grande, J. Solid State Chem. 192, 246 (2012).
- Wollan and Koehler (1955) E. O. Wollan and W. C. Koehler, Phys. Rev. 100, 545 (1955).
- Heikes et al. (1964) R. R. Heikes, R. C. Miller, and R. Mazelsky, Physica 30, 1600 (1964).
- Raccah and Goodenough (1967) P. M. Raccah and J. B. Goodenough, Phys. Rev. 155, 932 (1967).
- Goodenough (1958) J. B. Goodenough, J. Phys. Chem. Solids 6, 287 (1958).
- Goodenough (1967) J. B. Goodenough, Czechoslov. J. Phys. 17, 304 (1967).
- Yan et al. (2004) J.-Q. Yan, J.-S. Zhou, and J. B. Goodenough, Phys. Rev. B 70, 014402 (2004).
- Mukhopadhyay et al. (2013) S. Mukhopadhyay, M. W. Finnis, and N. M. Harrison, Phys. Rev. B 87, 125132 (2013).
- Buckeridge et al. (2016) J. Buckeridge, F. H. Taylor, and C. R. A. Catlow, Phys. Rev. B 93, 155123 (2016).
- Korotin et al. (1996) M. A. Korotin, S. Y. Ezhov, I. V. Solovyev, V. I. Anisimov, D. I. Khomskii, and G. A. Sawatzky, Phys. Rev. B 54, 5309 (1996).
- Rondinelli and Spaldin (2009) J. M. Rondinelli and N. A. Spaldin, Phys. Rev. B 79, 054409 (2009).
- Ritzmann et al. (2014) A. M. Ritzmann, M. Pavone, A. B. Muñoz-García, J. A. Keith, and E. A. Carter, J. Mater. Chem. A 2, 8060 (2014).
- Murnaghan (1944) F. D. Murnaghan, Proc. Natl. Acad. Sci. 30, 244 (1944).
- Chainani et al. (1992) A. Chainani, M. Mathew, and D. D. Sarma, Phys. Rev. B 46, 9976 (1992).
- Abbate et al. (1993) M. Abbate, J. C. Fuggle, A. Fujimori, L. H. Tjeng, C. T. Chen, R. Potze, G. A. Sawatzky, H. Eisaki, and S. Uchida, Phys. Rev. B 47, 16124 (1993).
- Razzaque Sarker (2015) A. Razzaque Sarker, Int. J. Mater. Sci. Appl. 4, 159 (2015).
- Tokura et al. (1998) Y. Tokura, Y. Okimoto, S. Yamaguchi, H. Taniguchi, T. Kimura, and H. Takagi, Phys. Rev. B - Condens. Matter Mater. Phys. 58, R1699 (1998).
- Arima et al. (1993) T. Arima, Y. Tokura, and J. B. Torrance, Phys. Rev. B 48, 17006 (1993).
- Seo et al. (2012) H. Seo, A. Posadas, and A. A. Demkov, Phys. Rev. B 86, 014430 (2012).
- Shannon (1976) R. D. Shannon, Acta Crystallogr. Sect. A 32, 751 (1976).
- Li et al. (2008) Y. Li, S. J. Peng, D. J. Wang, K. M. Wu, and S. H. Wang, AIP Adv. , 056317 (2008).
- Kanamori (1960) J. Kanamori, J. Appl. Phys. (1960).
- Anderson (1950) P. W. Anderson, Phys. Rev. 79, 350 (1950).
- Kugel’ and Khomskii (1982) K. I. Kugel’ and D. I. Khomskii, Acad. Sci. USSR Usp. Fiz. Nauk, Tech. Rep. (1982).
- Hsu et al. (2009) H. Hsu, K. Umemoto, M. Cococcioni, and R. Wentzcovitch, Phys. Rev. B 79, 125124 (2009).
- Kniaek et al. (2005) K. Kniaek, P. Novák, and Z. Jirák, Phys. Rev. B 71, 054420 (2005).
- He and Franchini (2012) J. He and C. Franchini, Phys. Rev. B 86, 235117 (2012).
- Gryaznov et al. (2010) D. Gryaznov, R. A. Evarestov, and J. Maier, Phys. Rev. B 82, 224301 (2010).
- Jayapandi et al. (2018a) S. Jayapandi, D. Lakshmi, S. Premkumar, P. Packiyaraj, and K. Anitha, Mater. Lett. 218, 205 (2018a).
- Jayapandi et al. (2018b) S. Jayapandi, V. A. Prakasini, and K. Anitha, in AIP Conf. Proc., Vol. 1942 (2018) p. 140048.
- (127) S. K. M. G. K. D. Blaha, P. and L. J., .
- Dovesi et al. (2018) R. Dovesi, A. Erba, R. Orlando, C. M. Zicovich-Wilson, B. Civalleri, L. Maschio, M. Rérat, S. Casassa, J. Baima, S. Salustro, and B. Kirtman, Wiley Interdiscip. Rev. Comput. Mol. Sci. 8, e1360 (2018).
- Liechtenstein et al. (1995) A. I. Liechtenstein, V. I. Anisimov, and J. Zaanen, Phys. Rev. B 52, R5467 (1995).
- Dong et al. (2007) T. Dong, H. Suk, and H. Hosun, J. Korean Phys. Soc. 50, 632 (2007).
- Scemama et al. (2018) A. Scemama, A. Benali, D. Jacquemin, M. Caffarel, and P. F. Loos, J. Chem. Phys. 149, 034108 (2018).
- Blunt and Neuscamman (2019) N. S. Blunt and E. Neuscamman, J. Chem. Theory Comput. 15, 178 (2019).
- Blunt and Neuscamman (2017) N. S. Blunt and E. Neuscamman, J. Chem. Phys. 147, 194101 (2017).
- Zhao and Neuscamman (2019) L. Zhao and E. Neuscamman, Phys. Rev. Lett. 123, 036402 (2019).
- Pavarini et al. (2016) E. Pavarini, E. Koch, J. van den Brink, and G. Sawatzky, Quantum Materials: Experiments and Theory, Modeling and Simulation, Vol. 6 (2016).
- Baur (1974) W. H. Baur, Acta Crystallogr. Sect. B Struct. Crystallogr. Cryst. Chem. 30, 1195 (1974).
- Křápek et al. (2012) V. Křápek, P. Novák, J. Kuneš, D. Novoselov, D. M. Korotin, and V. I. Anisimov, Phys. Rev. B 86, 195104 (2012).
- Izquierdo et al. (2014) M. Izquierdo, M. Karolak, C. Trabant, K. Holldack, A. Föhlisch, K. Kummer, D. Prabhakaran, A. T. Boothroyd, M. Spiwek, A. Belozerov, A. Poteryaev, A. Lichtenstein, and S. L. Molodtsov, Phys. Rev. B - Condens. Matter Mater. Phys. 90, 235128 (2014).
- Wang et al. (2015) Y. Wang, Z. Wang, Z. Fang, and X. Dai, Phys. Rev. B 91, 125139 (2015).
- Siurakshina et al. (2010) L. Siurakshina, B. Paulus, V. Yushankhai, and E. Sivachenko, Eur. Phys. J. B 74, 53 (2010).
- Eder (2010) R. Eder, Phys. Rev. B 81, 035101 (2010).
- Takahashi et al. (1998) H. Takahashi, F. Munakata, and M. Yamanaka, Phys. Rev. B - Condens. Matter Mater. Phys. 57, 15211 (1998).
- Kushima et al. (2010) A. Kushima, S. Yip, and B. Yildiz, Phys. Rev. B 82, 115435 (2010).
- Han and Yildiz (2011) J. W. Han and B. Yildiz, J. Mater. Chem. 21, 18983 (2011).
- Anisimov et al. (1991) V. I. Anisimov, J. Zaanen, and O. K. Andersen, Phys. Rev. B 44, 943 (1991).
- Peng and Perdew (2017) H. Peng and J. P. Perdew, Phys. Rev. B 96, 100101(R) (2017).
- Kitchaev et al. (2016) D. A. Kitchaev, H. Peng, Y. Liu, J. Sun, J. P. Perdew, and G. Ceder, Phys. Rev. B 93, 045132 (2016).
- Sai Gautam and Carter (2018) G. Sai Gautam and E. A. Carter, Phys. Rev. Mater. 2, 095401 (2018).
- Wang et al. (2006) L. Wang, T. Maxisch, and G. Ceder, Phys. Rev. B 73, 195107 (2006).
- Jain et al. (2011) A. Jain, G. Hautier, S. P. Ong, C. J. Moore, C. C. Fischer, K. A. Persson, and G. Ceder, Phys. Rev. B 84, 045115 (2011).