Galactic globular clusters: a new catalog of masses, structural parameters, velocity dispersion profiles, proper motions and space orbits
Abstract
We collected radial velocities of more than 50.000 individual stars in 156 Galactic globular clusters (GGC) and matched them with HST photometry and Gaia DR2 proper motions. This allowed us to derive the GGC’s mean proper motions and space velocities. By fitting a large set of N-body simulations to their velocity dispersion and surface density profiles, combined with new measurements of their internal radially dependent mass functions, we have determined their present-day masses and structural parameters, and for 144 GGCs their internal kinematics. We also derive the initial cluster masses by calculating the cluster orbits backwards in time applying suitable recipes to account for mass-loss and dynamical friction. The new fundamental parameters of GGCs are publicly available via an online database, which will regularly be updated.
keywords:
Galaxy: globular clusters: general, stars: kinematics, stars: luminosity function, mass function, catalogs, methods: n-body simulations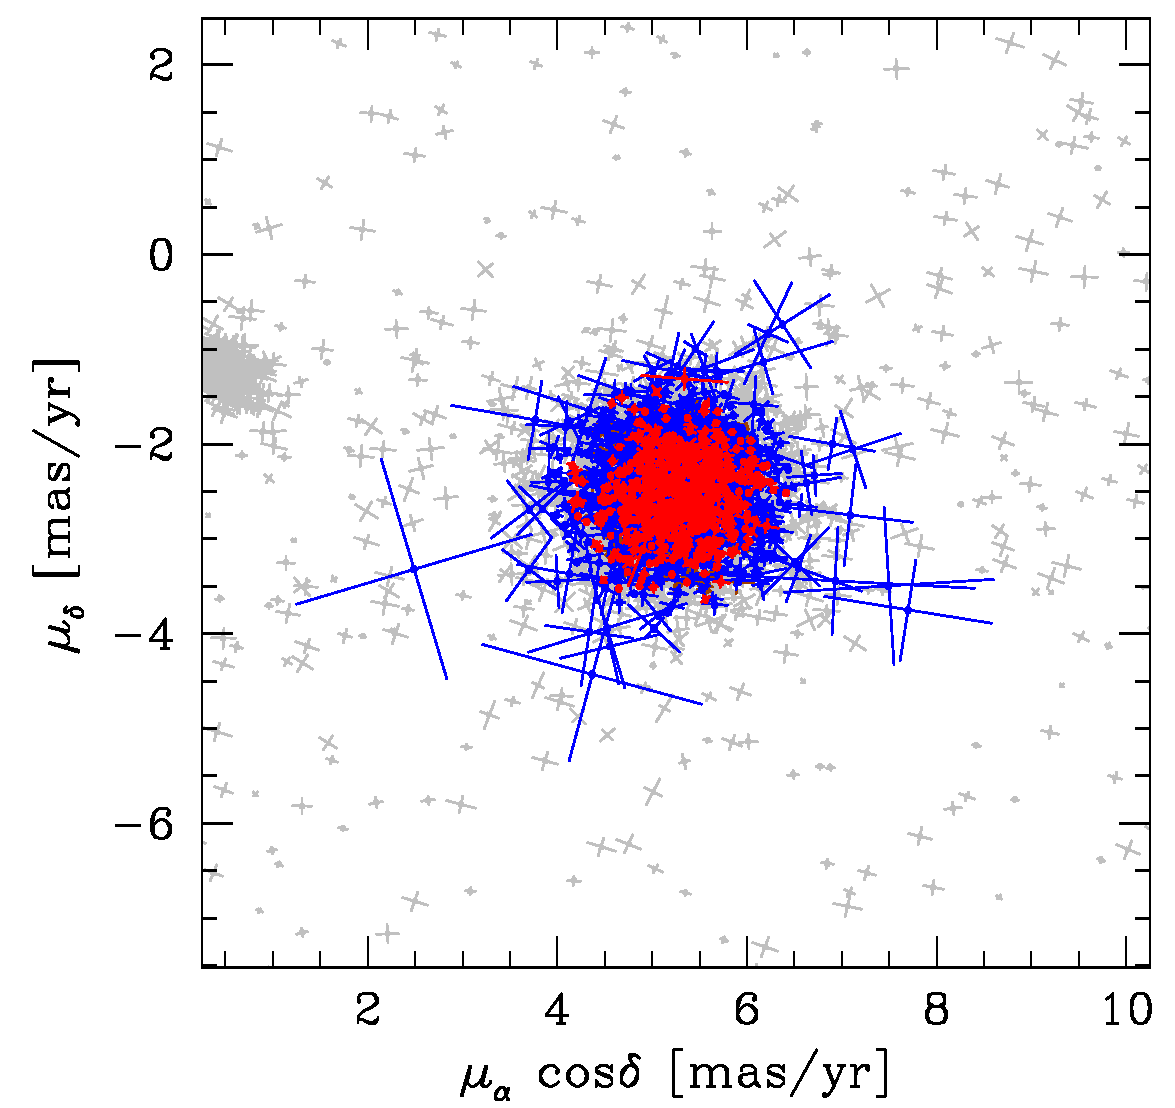
1 The new catalog for Galactic globular clusters
In our poster contribution we presented a new catalog of fundamental properties of Galactic globular clusters based on results from a series of papers:
[Baumgardt (2017)] first compared a large grid of 900 N-body models to the velocity dispersion and surface brightness profiles of 50 GGCs in order to determine their masses and mass-to-light ratios. Additionally, [Sollima & Baumgardt (2017)] presented the global mass functions of 35 GGCs based on deep HST photometry in combination with multimass dynamical models. One year later, [Baumgardt & Hilker (2018)] determined masses, stellar mass functions, and structural parameters of 112 GGCs by fitting a large set of N-body simulations to their velocity dispersion and surface density profiles. The velocity dispersion profiles were calculated based on a combination of more than 15.000 high-precision radial velocities, which were derived from archival ESO/VLT and Keck spectra, together with 20.000 published radial velocities from the literature. When Gaia DR2 became public, [Baumgardt et al. (2019)] presented mean proper motions and space velocities of 154 GGCs and the velocity dispersion profiles of 141 globular clusters based on a combination of Gaia DR2 proper motions with ground-based line-of-sight velocities. The combination of these velocity dispersion profiles with new measurements of the internal mass functions allowed to model the internal kinematics of 144 GGCs, more than 90 per cent of the currently known Milky Way globular cluster population. Finally, [Sollima, Baumgardt & Hilker] analysed the internal kinematics of 62 GGCs, finding significant rotation in 15 of them.
All those results are combined in our new GGC catalog. The online version of this catalog, which is and always will be the reference for the most up-to-date results of our work, can be accessed under the following link:
https://people.smp.uq.edu.au/HolgerBaumgardt/globular/
There we provide several tables:
-
•
A table containing the mean radial velocities, proper motions and orbital parameters of 156 GGCs, derived from the GAIA proper motions and our new radial velocities ([Baumgardt & Hilker (2018), Baumgardt et al. (2019), Baumgardt & Hilker 2018, Baumgardt et al. 2019]). The orbital integrations were done in the [Irrgang et al. (2013)] Milky Way mass model.
-
•
A table containing the masses and structural parameters of 156 GGCs, based on our N-body fits ([Baumgardt & Hilker (2018), Baumgardt & Hilker 2018]).
-
•
Velocity dispersion profiles of 139 GGCs. They are based on the following works: [Watkins et al. 2015], [Baumgardt (2017)], [Kamann et al. (2018)], [Baumgardt & Hilker (2018)] and [Baumgardt et al. (2019)].
-
•
Individual radial velocities for more than 50.000 stars in 122 GGCs, derived from ESO proposals prior to 2014. The data files also contain the Gaia DR2, APOGEE DR14, Keck/DEIMOS, Keck/HIRES and Keck/NIRSPEC radial velocities which are not included in the MNRAS paper.
-
•
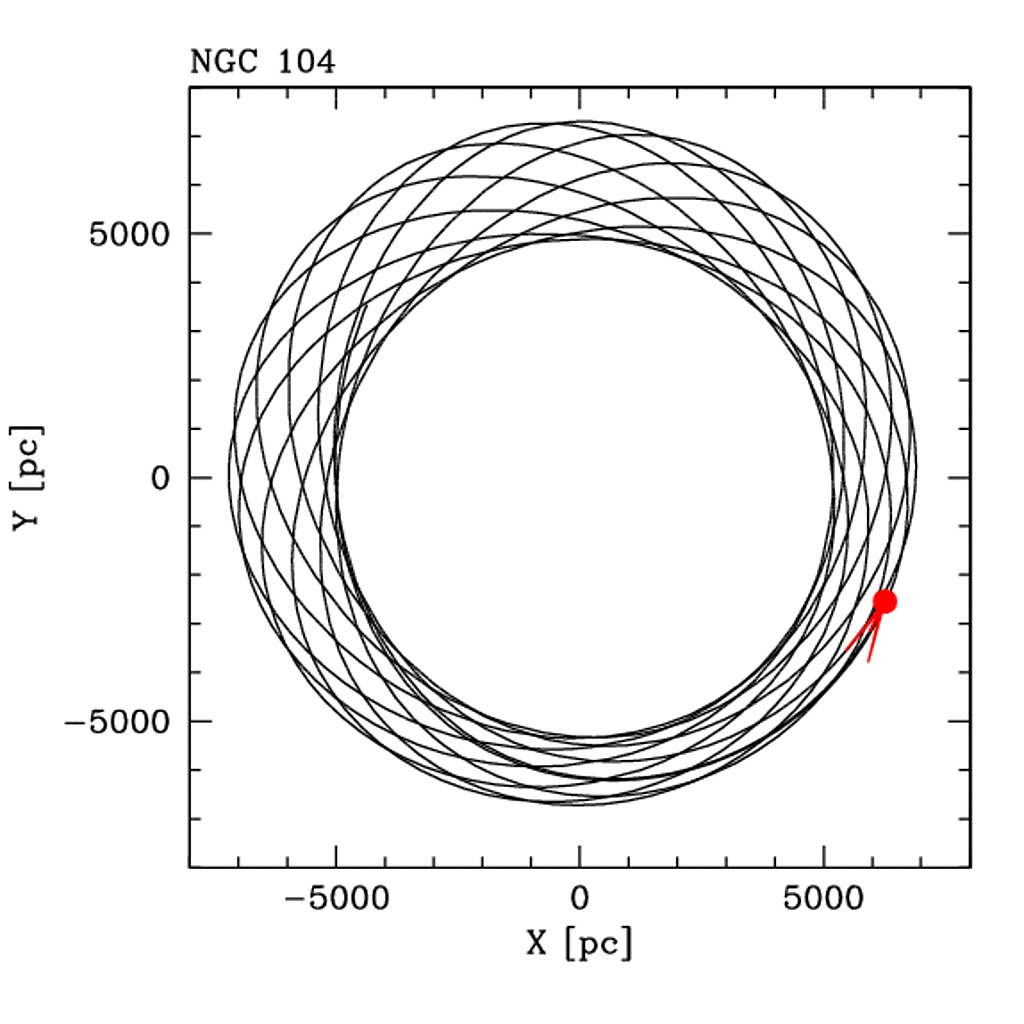
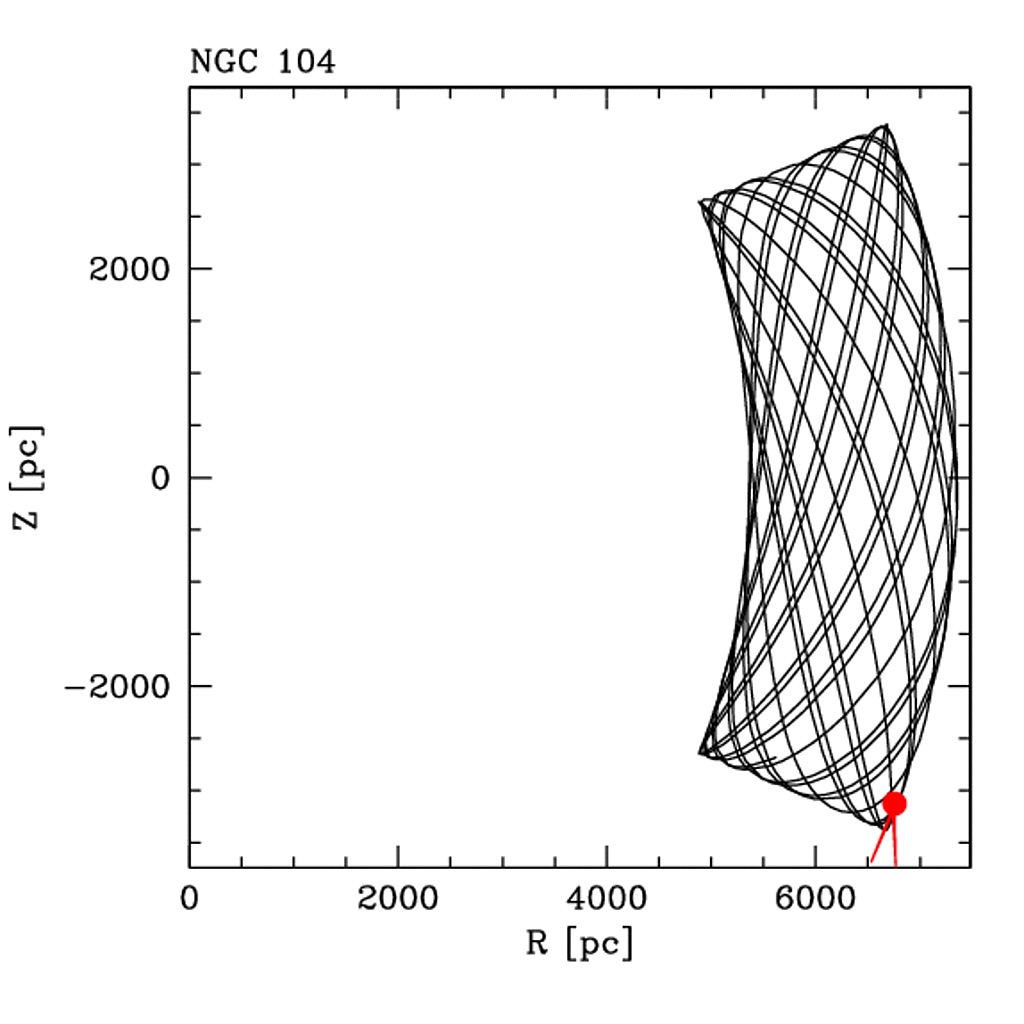
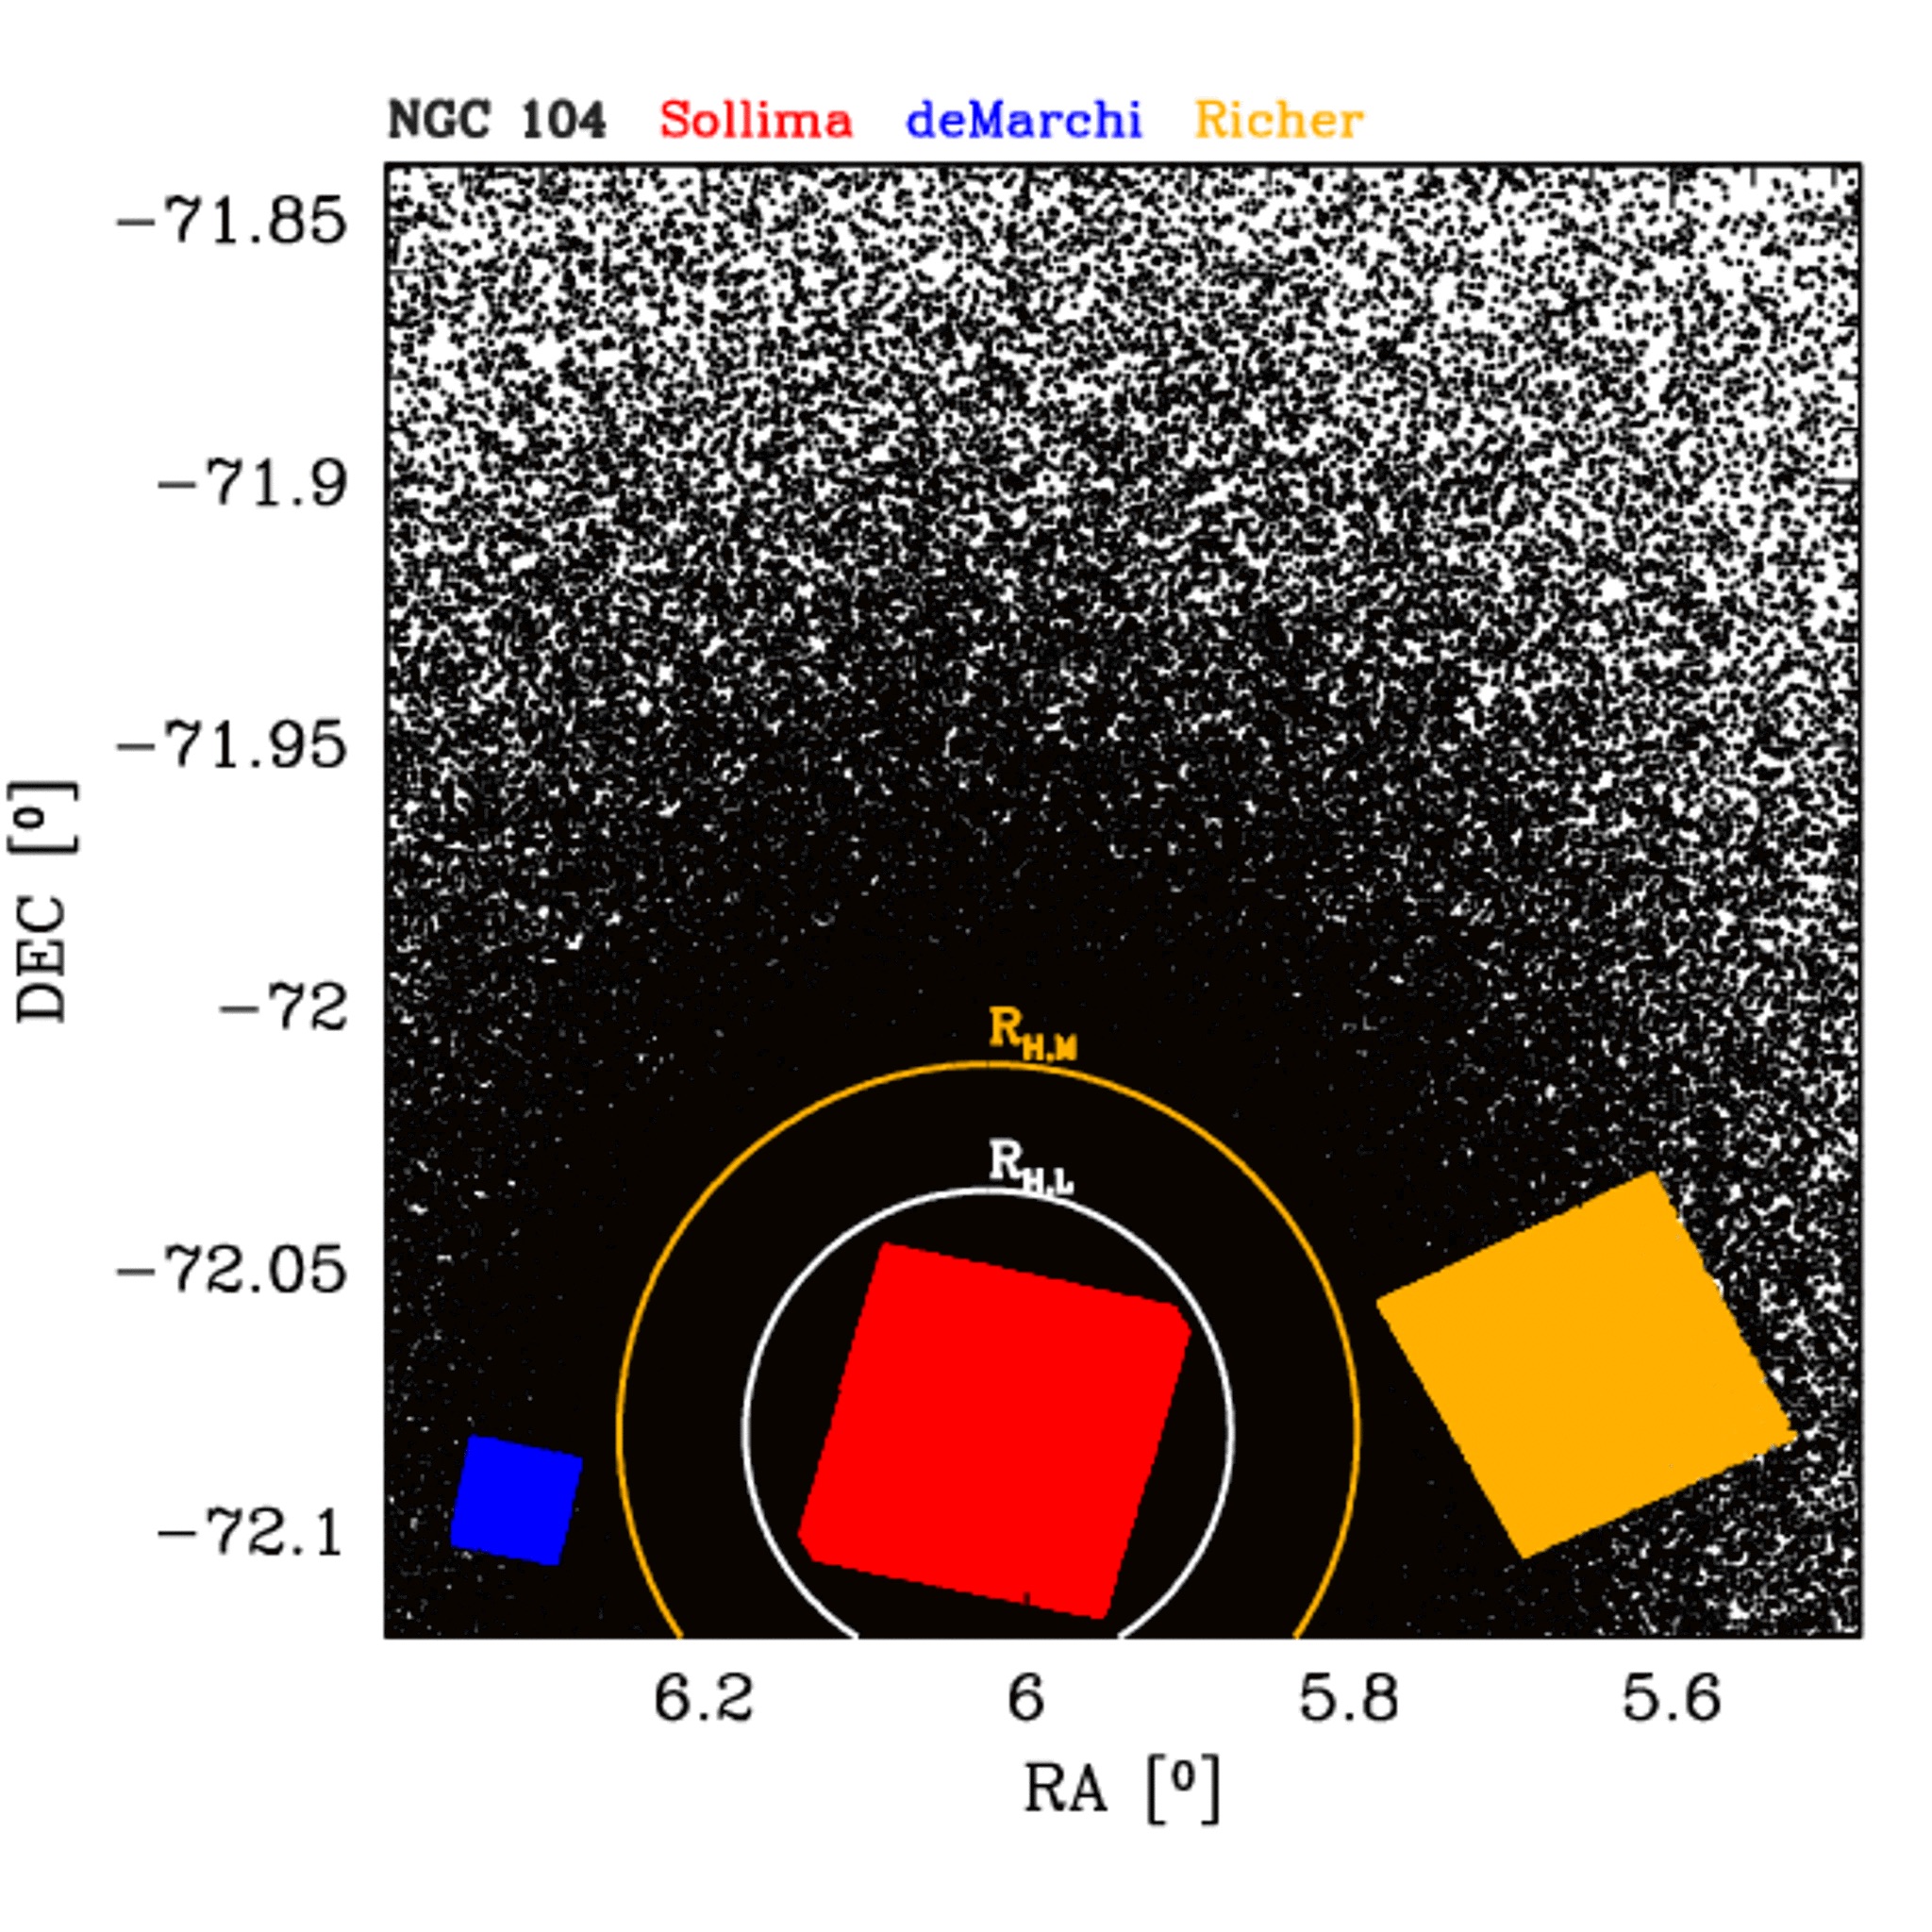
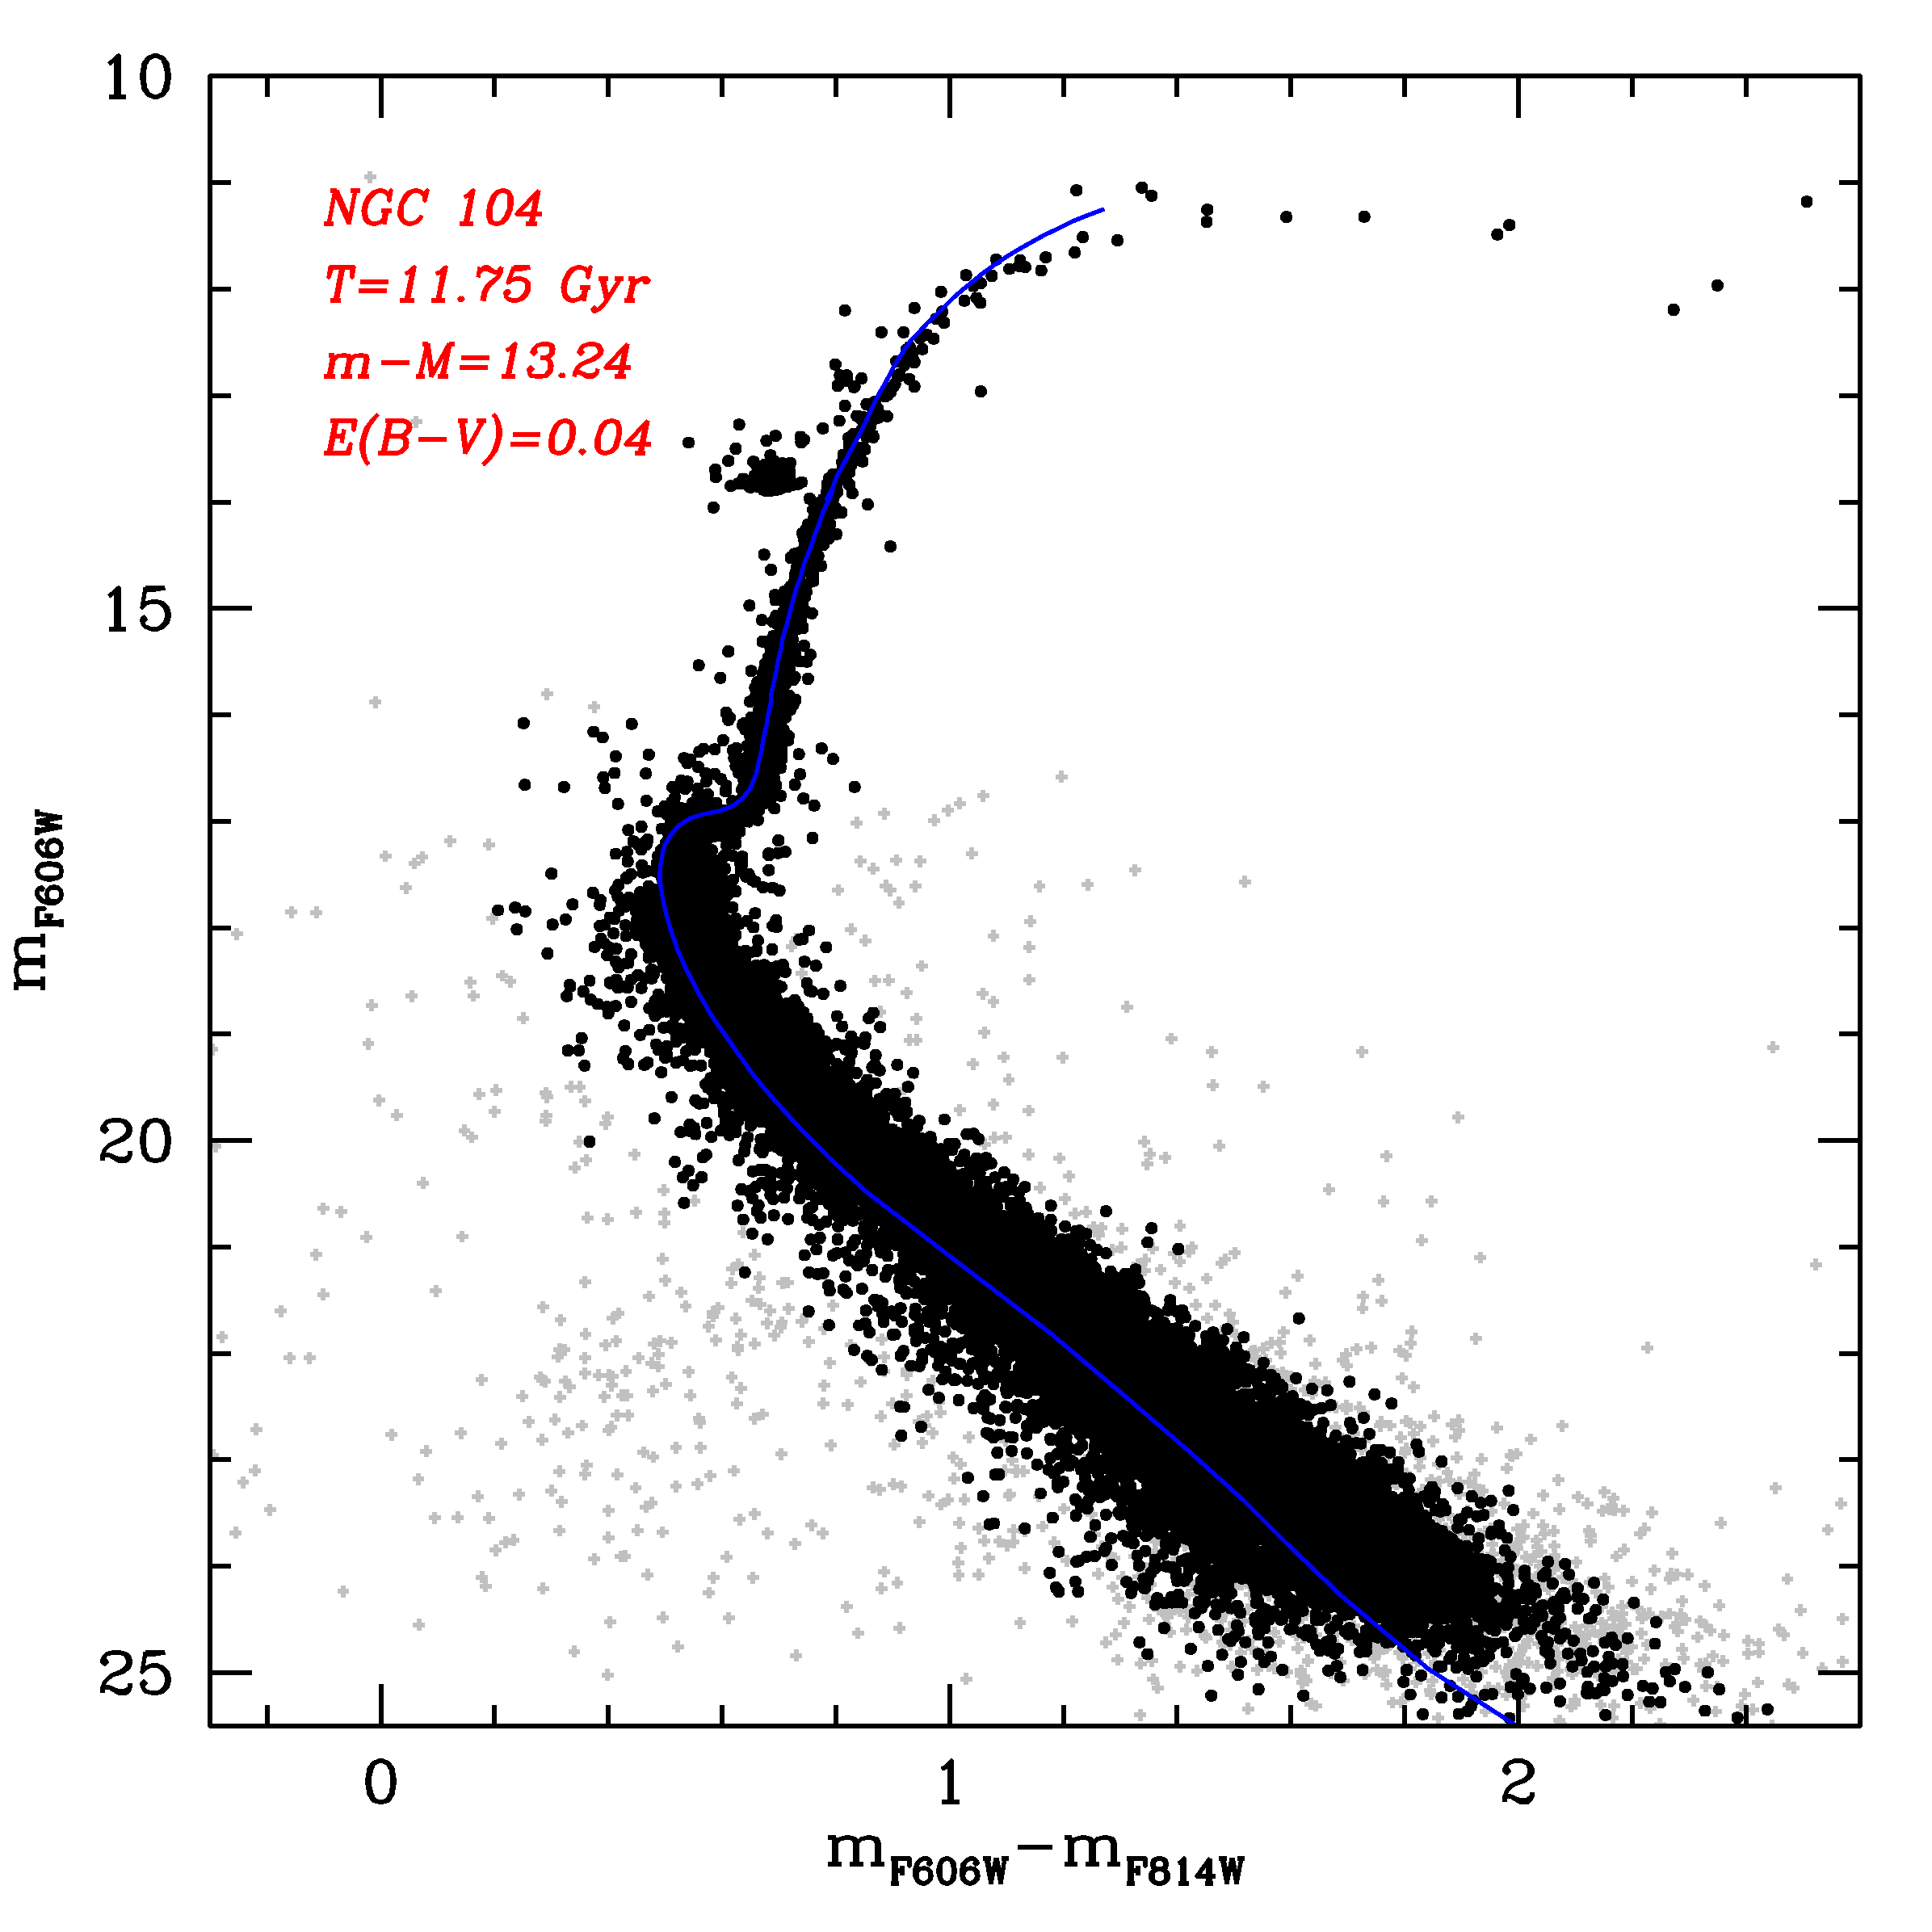
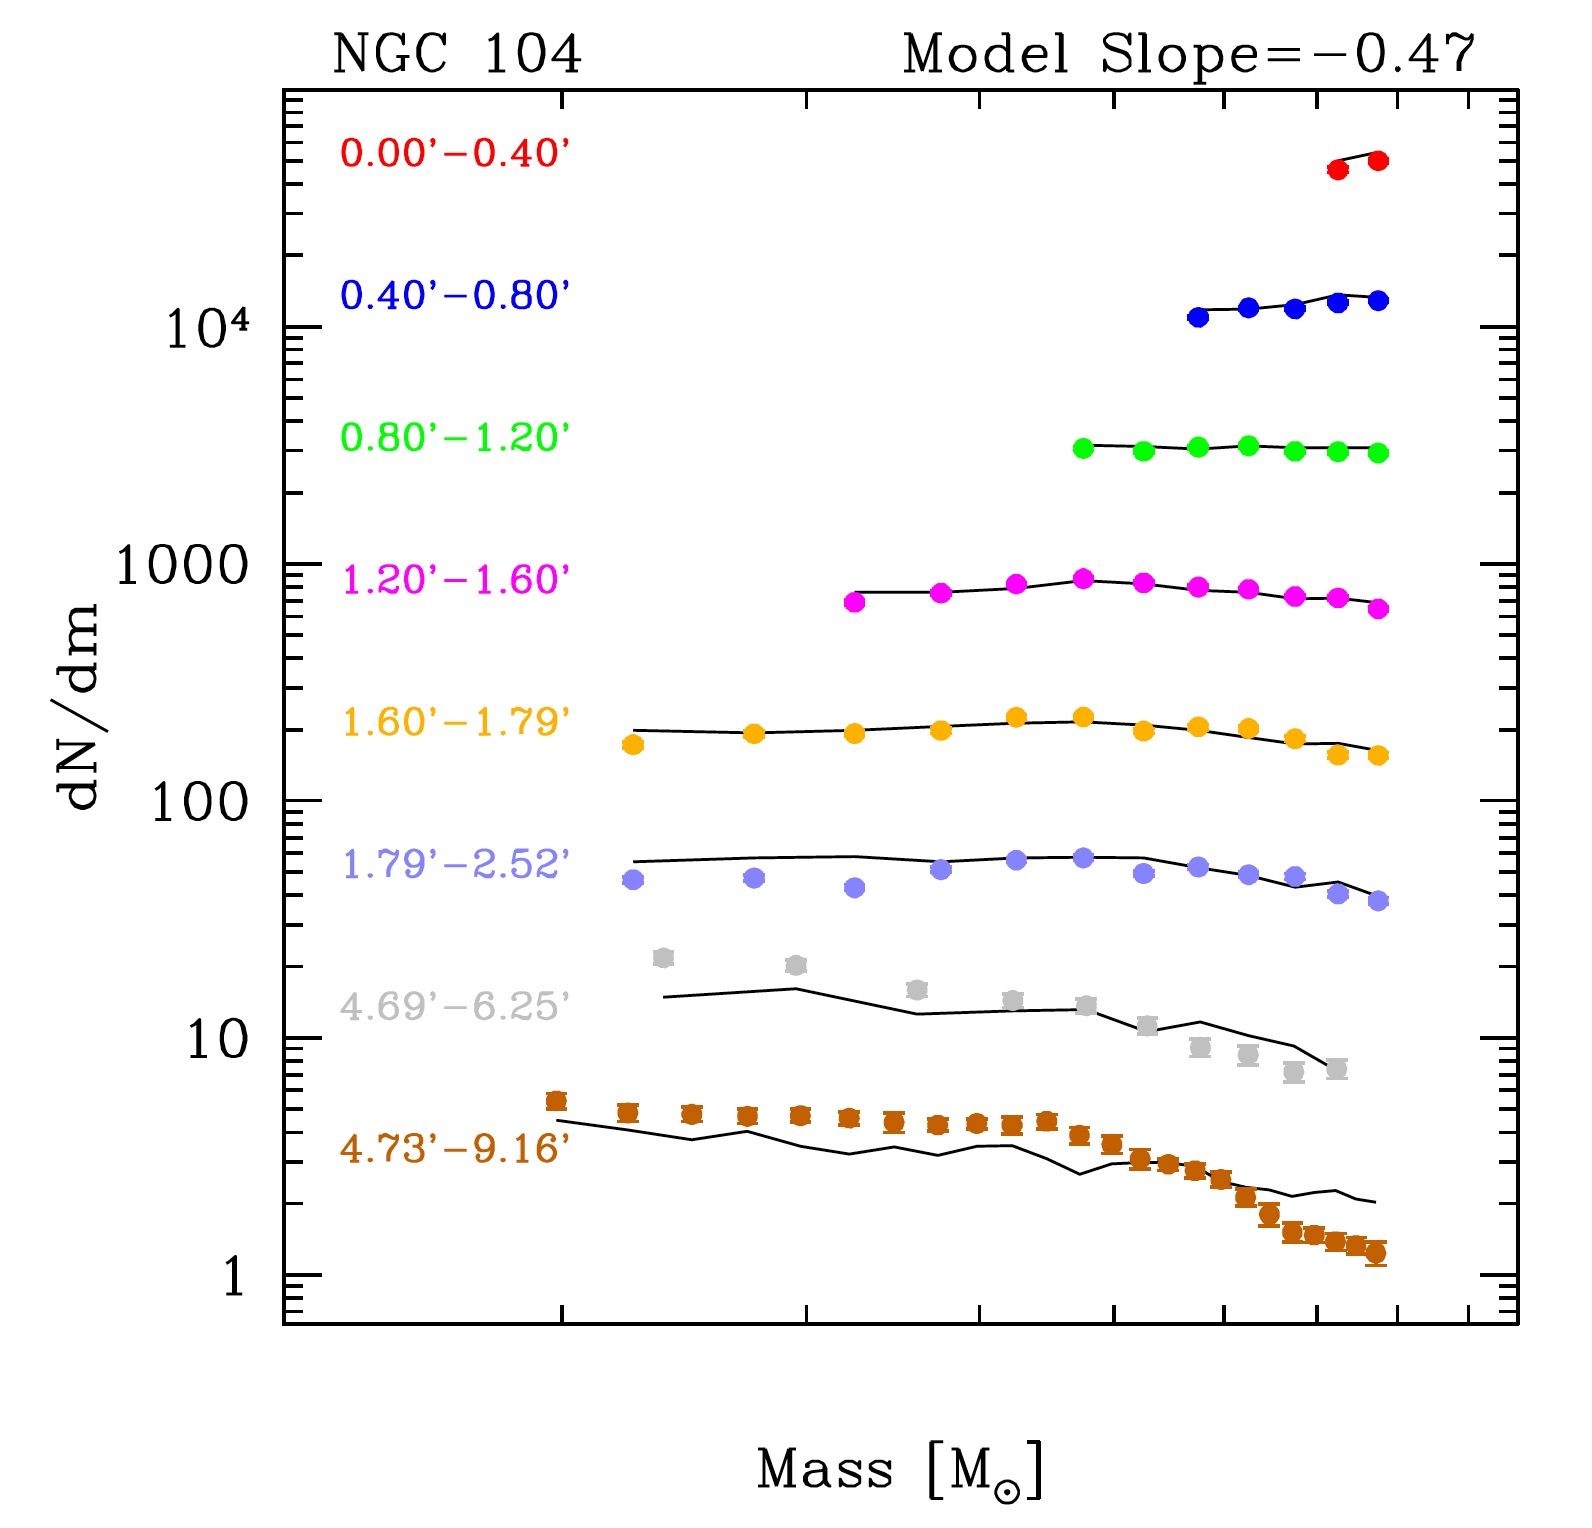
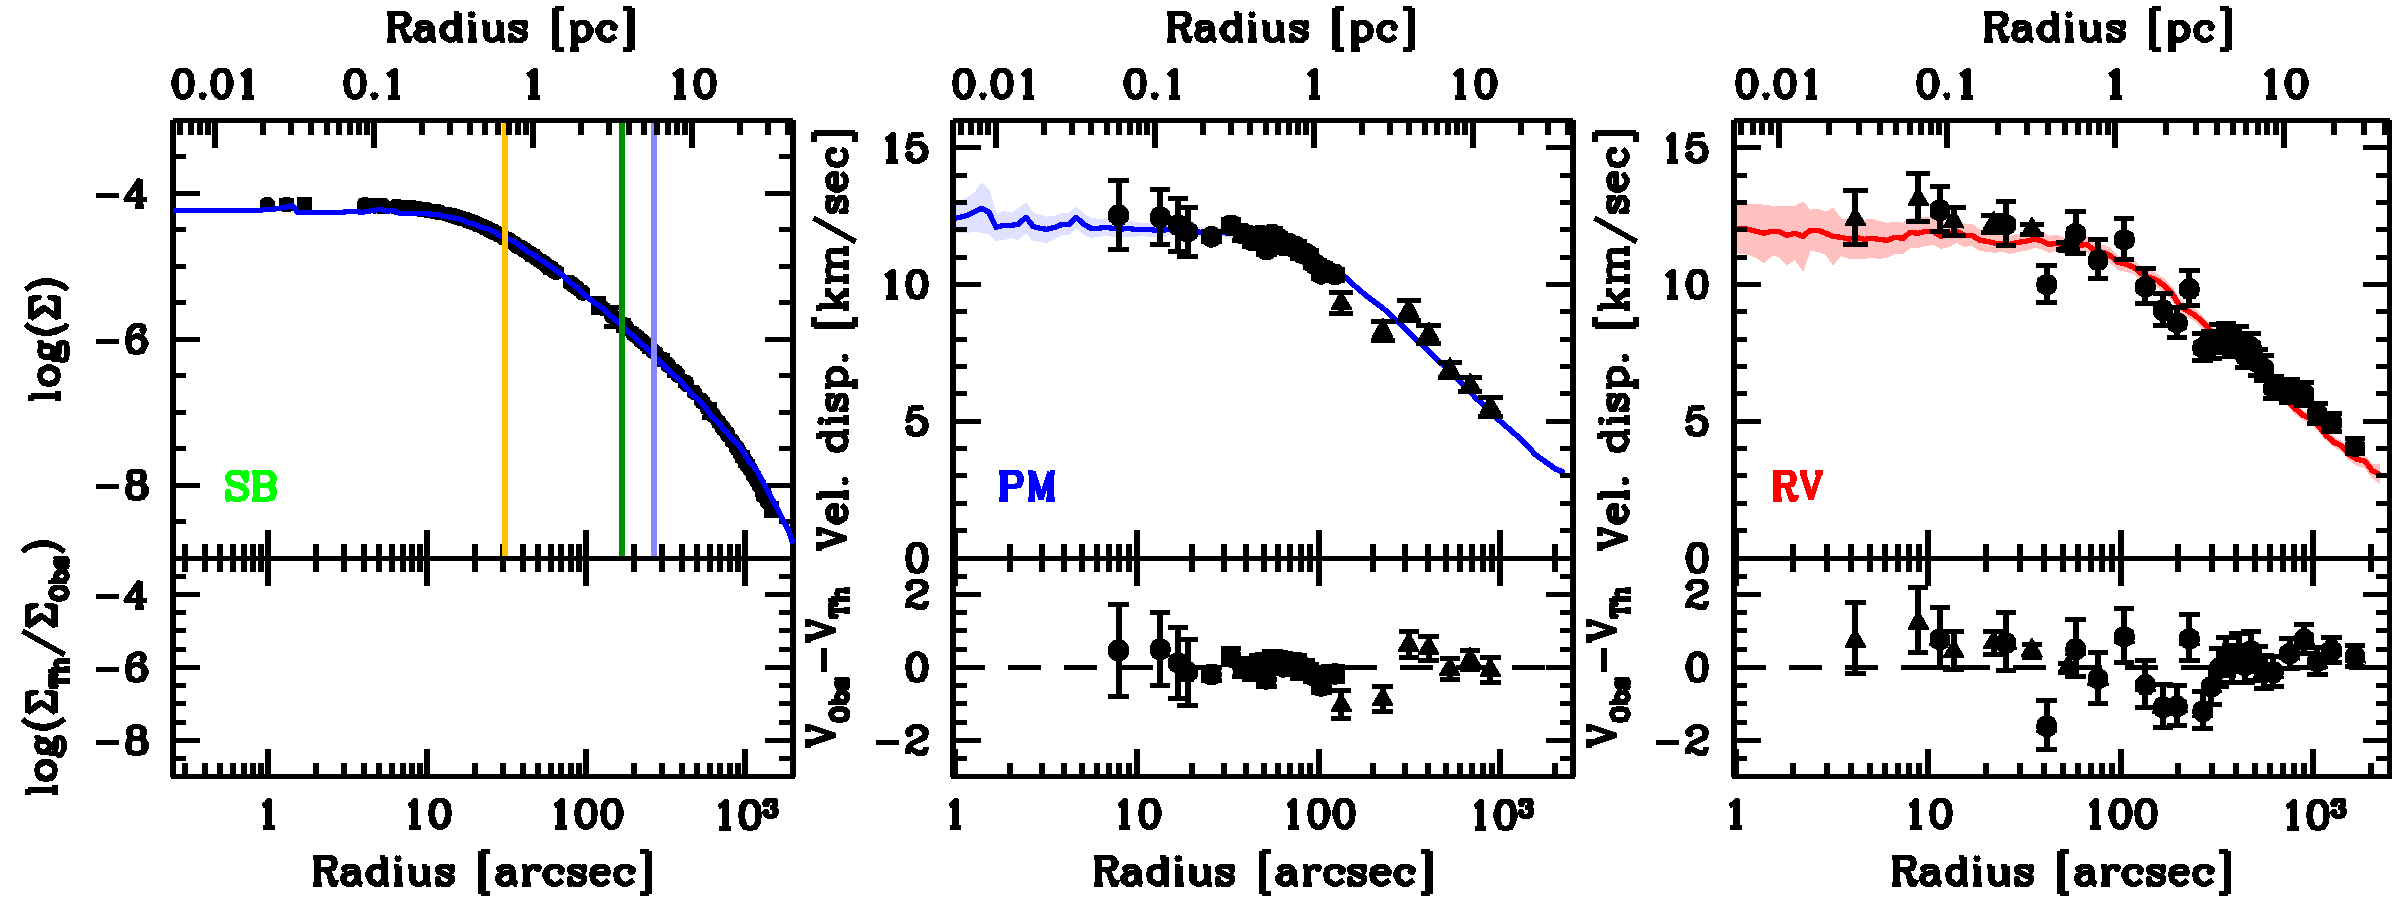
For 156 GGCs: figures on the Gaia selection, HST photometry, orbit over the last 2 Gyr, color magnitude diagram, mass function at different radii, N-body fits to the surface density and velocity dispersion profiles, see an example in Fig. 1.
Regular updates of those tables including new radial velocity and photometry data as well as model fits are planned.
2 Some key results
The compilation and calculation of newly derived structural and dynamical parameters of almost all Milky Way GCs allowed us to investigate several global properties of the Galactic globular cluster system and to derive fundamental correlations. Our most prominent findings are listed in the following.
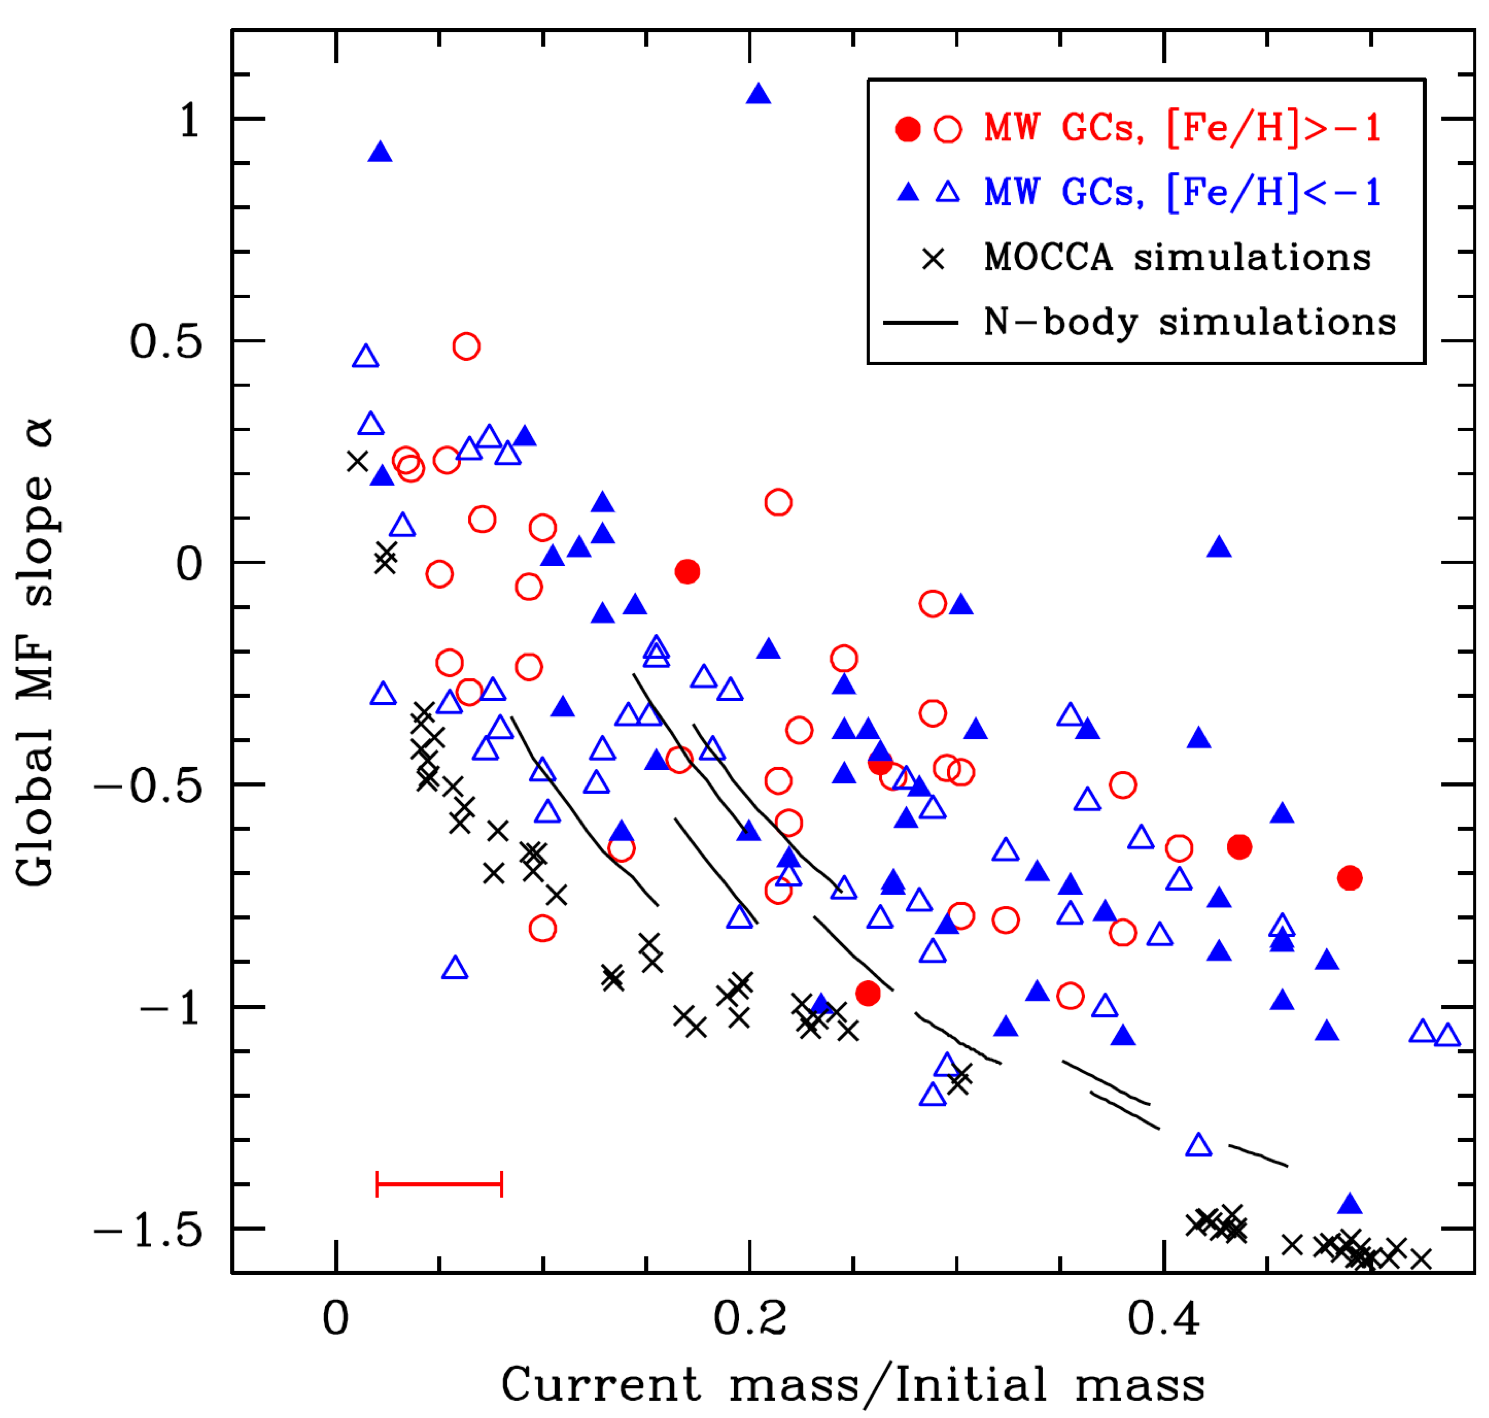
Present-day mass function slope. There exists a strong correlation between the stellar mass function (MF) of a GC and the amount of mass lost from the cluster as well as their relaxation time [Sollima & Baumgardt (2017), Baumgardt & Hilker (2018), (Sollima & Baumgardt 2017, Baumgardt & Hilker 2018)]. Both, metal-rich and metal-poor GGCs, follow the same correlation. Dynamical evolution is the main mechanism shaping the MF of stars in clusters. There is a strong hint that GGCs are formed with a bottom-light IMF. The present-day MF slope anti-correlates with the half-mass relaxation time, while the fraction of rotational kinetic energy correlates with it [Baumgardt et al. (2019), (Baumgardt et al. 2019)].
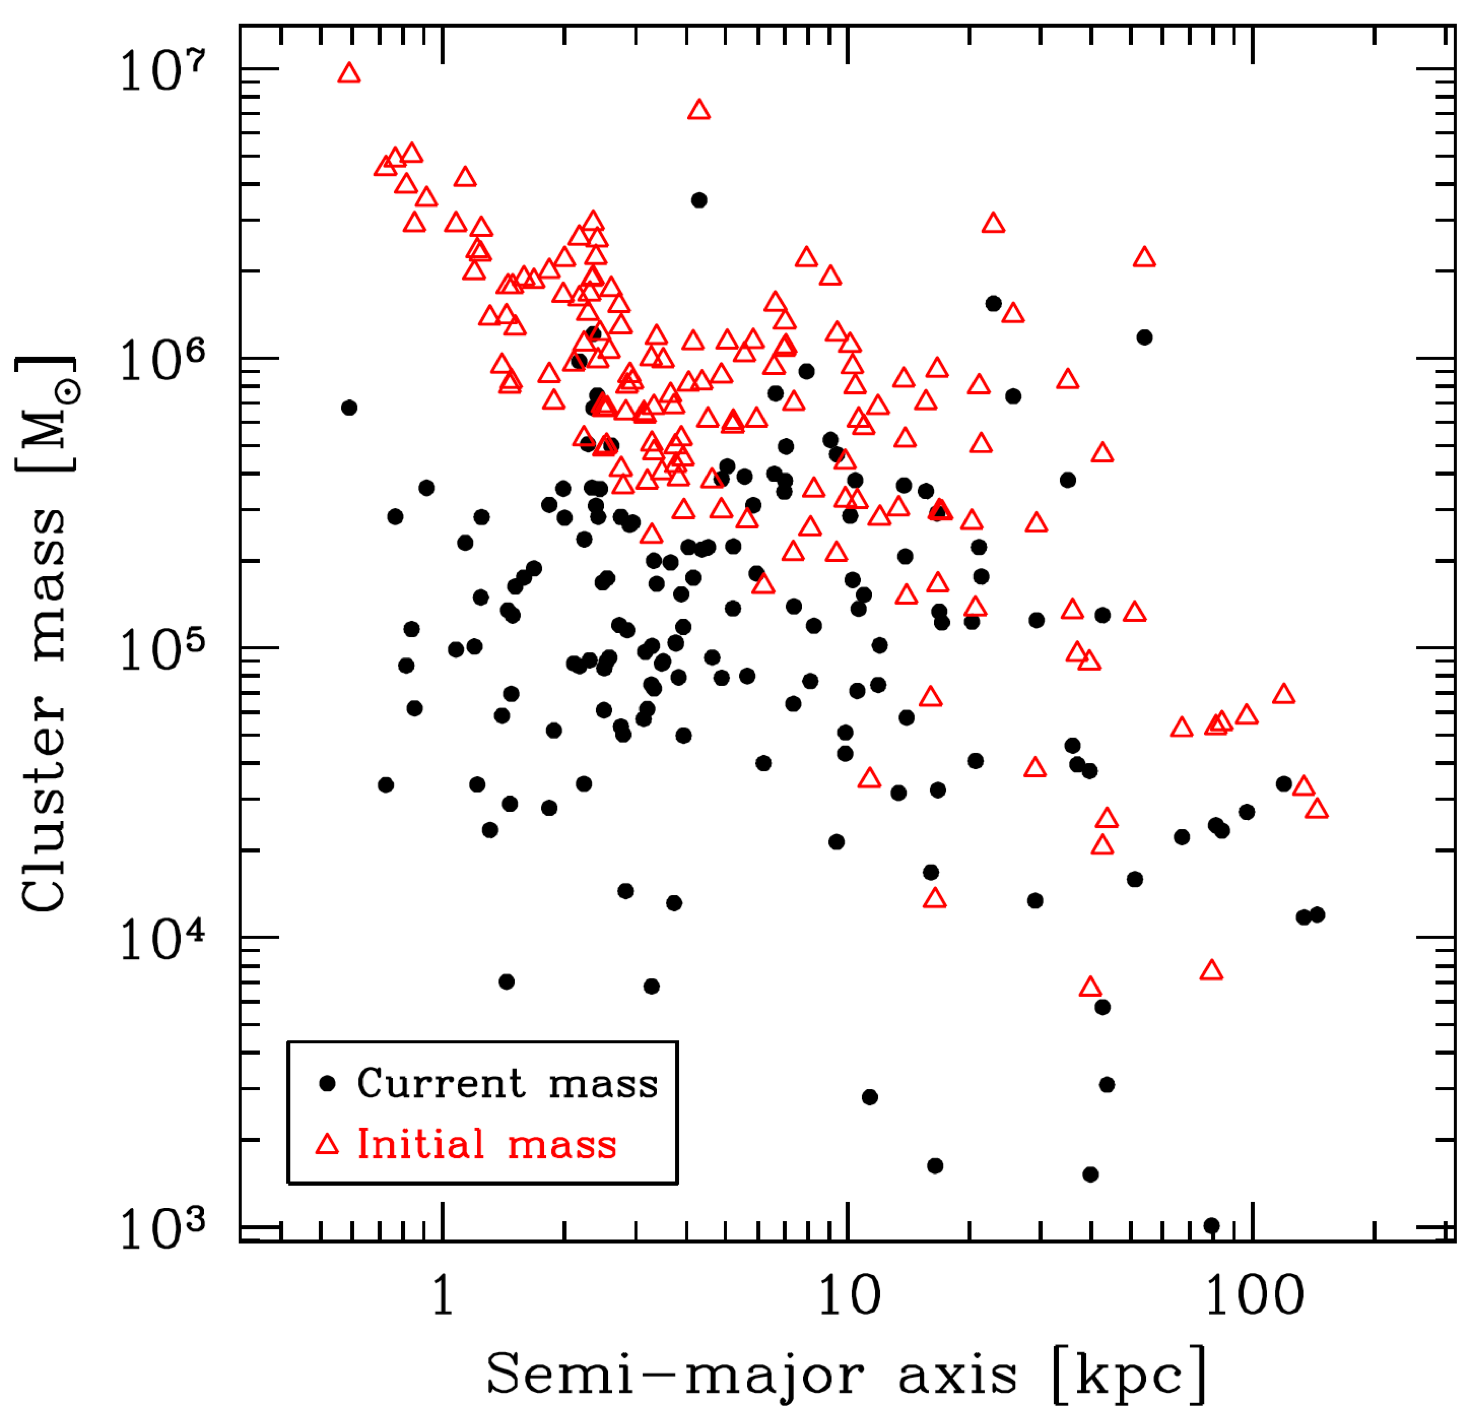
Initial GC masses. The surviving Galactic GC population has lost about 80% of its initial mass: at formation, GCs were about 5x more massive. If GCs started from a log-normal mass function, the MW contained 500 GCs initially, with a combined mass of about . For a power-law initial mass function, the initial mass in GCs could have been about 3 higher [Baumgardt et al. (2019), (Baumgardt et al. 2019)].
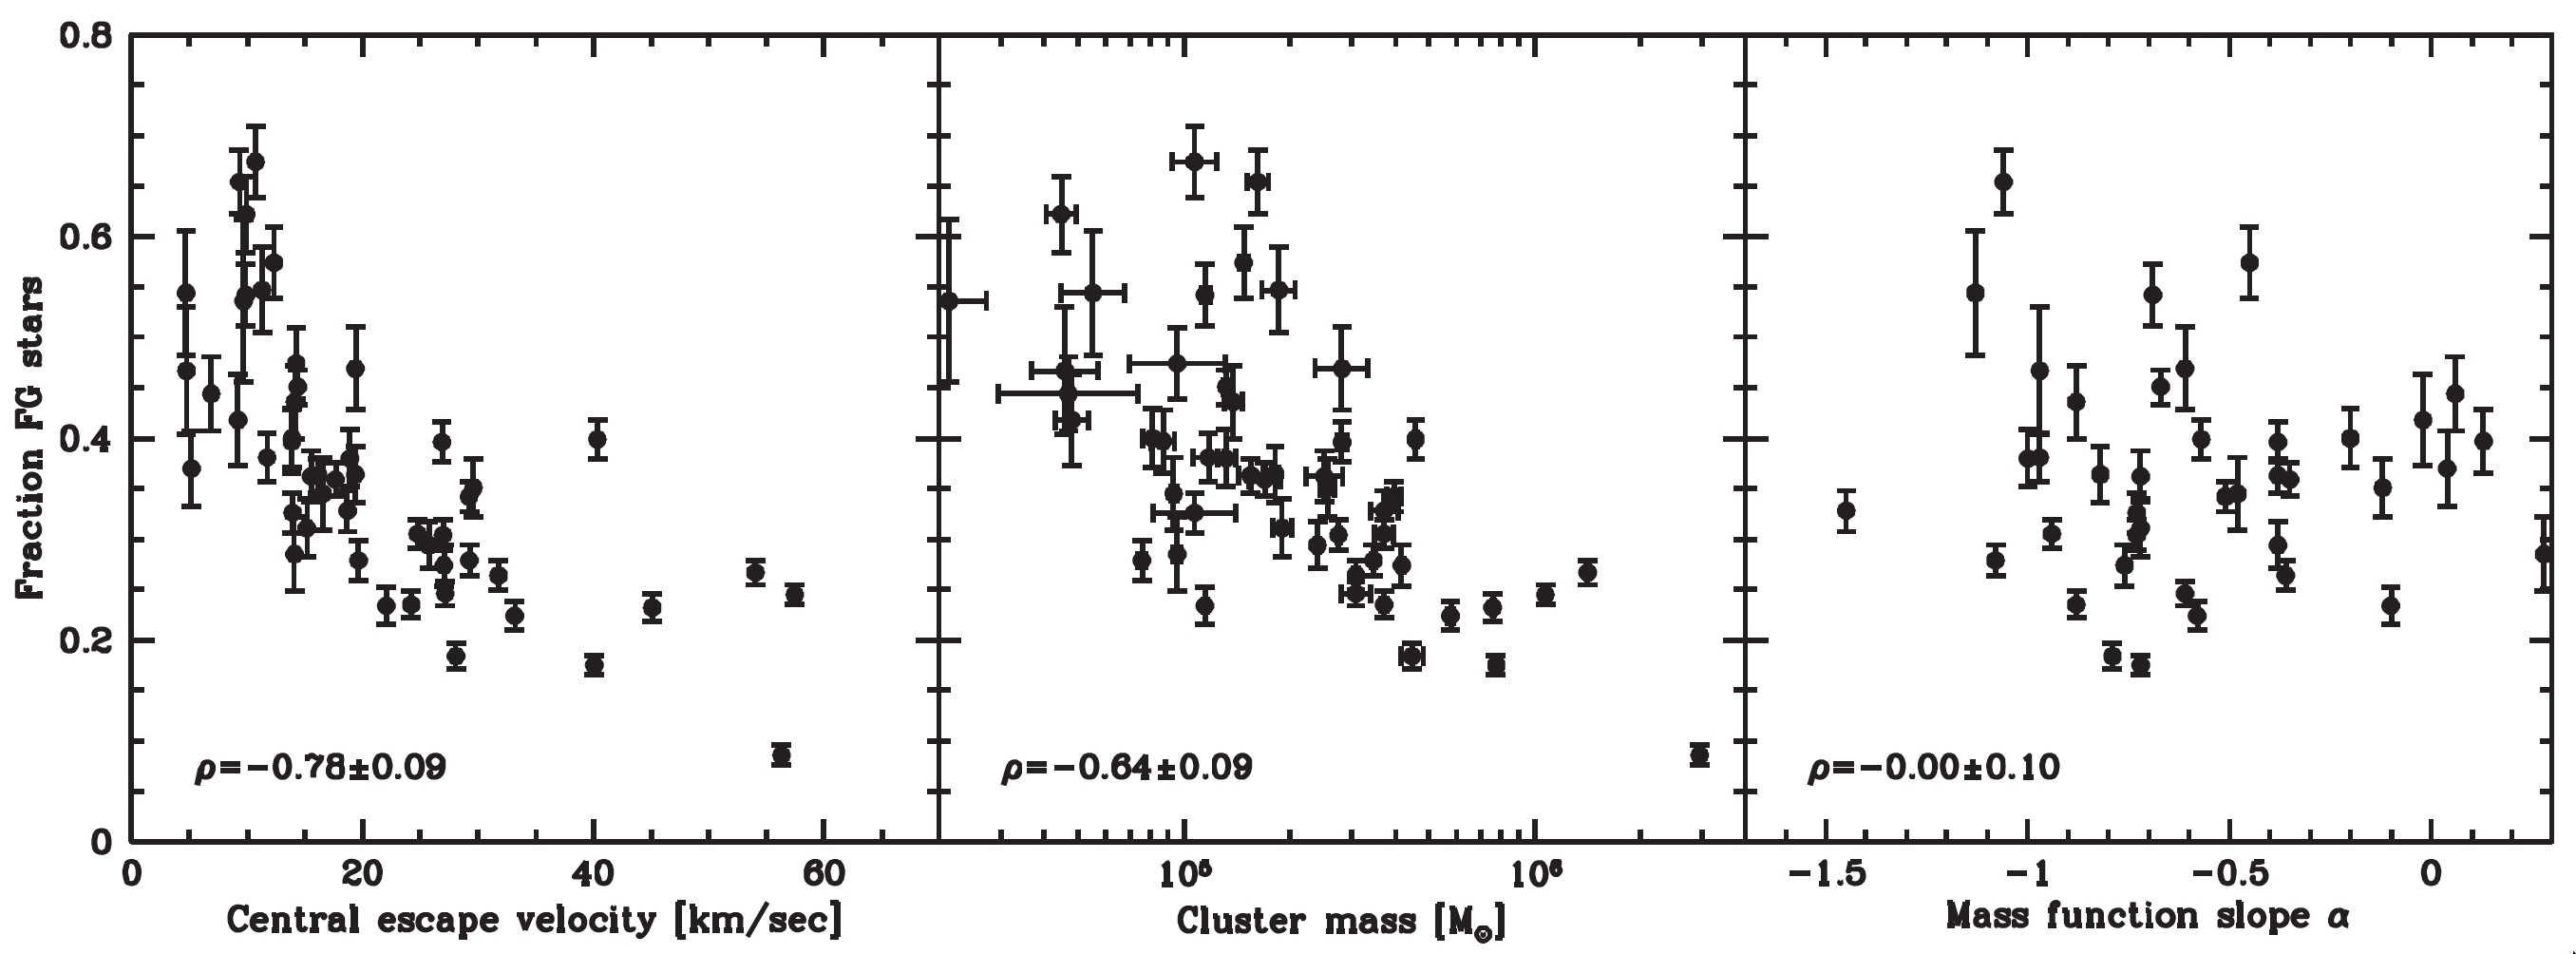
Fraction of first population stars. The fraction of first-population stars in a GGC correlates with its central escape velocity as well as with its total present-day mass, but not with its global MF slope [Baumgardt & Hilker (2018), (Baumgardt & Hilker 2018)], see Fig. 3. This could indicate that the ability of a globular cluster to keep the wind ejecta from the polluting star(s) is the crucial parameter determining the presence and fraction of second-population stars and not its later dynamical mass loss.
References
- [Baumgardt (2017)] Baumgardt, H. 2017, MNRAS, 464, 2174
- [Baumgardt & Hilker (2018)] Baumgardt, H. & Hilker, M. 2018, MNRAS, 478, 1520
- [Baumgardt et al. (2019)] Baumgardt, H., Hilker, M., Sollima, A. & Bellini, A. 2019, MNRAS, 482, 5183
- [Irrgang et al. (2013)] Irrgang, A., Wilcox, B., Tucker, E. & Schiefelbein, L. 2013, A&A, 549, A137
- [Kamann et al. (2018)] Kamann, S., Husser, T.-O., Dreizler, S., Emsellem, E., Weilbacher, P.M., et al. 2018, MNRAS, 473, 5591
- [Milone et al. (2017)] Milone, A.P., Piotto, G., Renzini, A., Marino, A.F., Bedin, L.R., et al. 2017, MNRAS, 464, 3636
- [Sollima & Baumgardt (2017)] Sollima, A. & Baumgardt, H. 2017, MNRAS, 471, 3668
- [Sollima, Baumgardt & Hilker] Sollima, A., Baumgardt, H. & Hilker, M. 2019, MNRAS, 485, 1469
- [Watkins et al. 2015] Watkins, L.L., van der Marel, R.P., Bellini, A. & Anderson, J. 2015, ApJ, 803, 29