High-velocity outflows in massive post-starburst galaxies at
Abstract
We investigate the prevalence of galactic-scale outflows in post-starburst (PSB) galaxies at high redshift (), using the deep optical spectra available in the UKIDSS Ultra Deep Survey (UDS). We use a sample of spectroscopically confirmed PSBs, recently identified in the UDS field, and perform a stacking analysis in order to analyse the structure of strong interstellar absorption features such as Mg ii ( Å). We find that for massive () PSBs at , there is clear evidence for a strong blue-shifted component to the Mg ii absorption feature, indicative of high-velocity outflows () in the interstellar medium. We conclude that such outflows are typical in massive PSBs at this epoch, and potentially represent the residual signature of a feedback process that quenched these galaxies. Using full spectral fitting, we also obtain a typical stellar velocity dispersion for these PSBs of , which confirms they are intrinsically massive in nature (dynamical mass ). Given that these high- PSBs are also exceptionally compact (–) and spheroidal (Sérsic index ), we propose that the outflowing winds may have been launched during a recent compaction event (e.g. major merger or disc collapse) that triggered either a centralised starburst or active galactic nuclei (AGN) activity. Finally, we find no evidence for AGN signatures in the optical spectra of these PSBs, suggesting they were either quenched by stellar feedback from the starburst itself, or that if AGN feedback is responsible, the AGN episode that triggered quenching does not linger into the post-starburst phase.
keywords:
galaxies: high-redshift — galaxies: ISM — galaxies: kinematics and dynamics1 Introduction
In the local Universe, there exists a clear bi-modality in the galaxy population with respect to optical colour, star-formation characteristics and morphology (e.g. Strateva et al., 2001; Schawinski et al., 2014). In general, massive galaxies tend to be red, passive and of early-type morphology, while lower mass galaxies tend to be blue, star forming and of late-type morphology. These two populations form the red-sequence and blue cloud, respectively. Significant evolution in this bi-modality has been observed since , showing a rapid build-up of mass upon the red-sequence (e.g. Bell et al., 2004; Cirasuolo et al., 2007; Faber et al., 2007; Brammer et al., 2011; Ilbert et al., 2013; Muzzin et al., 2013). However, the principal drivers behind the required quenching of blue cloud galaxies at high redshift remain uncertain and a topic of significant debate.
To account for the quenching of star formation at high redshift, several mechanisms have been proposed. For example, gas stripping processes (e.g. Gunn & Gott, 1972), morphological quenching (Martig et al., 2009), shock heating of infalling cold gas by the hot halo (Dekel & Birnboim, 2006), and an exhaustion of the gas supply (e.g. Larson et al., 1980). Other promising contenders include feedback processes, where the outflowing superwinds generated by either an AGN or starburst can expel the cold gas required for continuous star-formation (e.g. Silk & Rees, 1998; Hopkins et al., 2005; Diamond-Stanic et al., 2012). To prevent further gas accretion, and therefore keep star formation suppressed, radio-mode AGN feedback may also be required (Best et al., 2005, 2006). In general, these quenching mechanisms fall into two main categories: i) those that lead to a rapid truncation of star formation (rapid quenching), and ii) those that prevent the accretion of new gas resulting in a more gradual decline (slow quenching). With respect to the dominant quenching route, recent studies have indicated that slow quenching dominates in the local Universe (e.g. Peng et al., 2015), while rapid quenching (e.g. feedback processes) becomes increasingly more important at (e.g. Barro et al., 2013; Wild et al., 2016; Carnall et al., 2018; Belli et al., 2018).
With respect to feedback processes, there is strong evidence for the galactic-scale outflows required to quench high- galaxies. At low- and high-redshift, outflows spanning a wide range of velocities have been detected in both i) AGN of various types (e.g. Hainline et al., 2011; Harrison et al., 2012; Cimatti et al., 2013; Cicone et al., 2014; Talia et al., 2017); and ii) star-forming galaxies with no signs of AGN activity, either in their UV/optical spectrum (e.g. Talia et al., 2012; Bradshaw et al., 2013; Bordoloi et al., 2014; Talia et al., 2017) or X-ray properties (Cimatti et al., 2013). These studies have also revealed that such gaseous outflows are a multiphase phenomenon and exist in each of the high-/low-ionisation, neutral and molecular gas phase of the interstellar medium (ISM; e.g. Hainline et al., 2011; Cicone et al., 2014; Fluetsch et al., 2019; Roberts-Borsani & Saintonge, 2019).
In order for feedback processes to quench a galaxy, strong outflows capable of expelling the gas reservoir are required. In the local Universe, strong outflows are only detected in starburst galaxies (e.g. Heckman et al., 2000; Martin, 2005; Heckman et al., 2015), but at higher redshifts () such outflows are more ubiquitous among the general star-forming population (e.g. Weiner et al., 2009; Bradshaw et al., 2013; Rubin et al., 2014; Du et al., 2018). Particularly, strong outflows () have also been detected in both star-forming AGN at (e.g. Hainline et al., 2011; Harrison et al., 2012; Talia et al., 2017), as well as at in massive compact star-forming/starburst galaxies with no signs of AGN activity (Geach et al., 2014; Sell et al., 2014). Taken together, these results indicate that both AGN and starburst-driven winds are capable of driving the strong outflows required for rapid quenching. For starburst galaxies at , recent studies have also reported that the outflow strength (i.e. velocity) depends on stellar mass, star-formation rate (SFR) and, in particular, SFR density (e.g. Heckman et al., 2015; Heckman & Borthakur, 2016), suggesting feedback from star-formation can be a principal driver of strong galactic-scale outflows. However, although AGN and starburst-driven outflows clearly represent a promising mechanism to explain the quenching of star-formation at high redshift, observationally a direct causal link to quenching remains elusive.
To establish the role of outflows as a quenching process, it isuseful to consider galaxies that have been recently quenched. Therare population of post-starburst (PSB) galaxies provide an ideal example, as they represent systems that have experienced a major burst of star formation that was rapidly quenched at some point during the last Gyr. These galaxies are identified spectroscopically from the characteristic strong Balmer absorption lines related to an enhanced A-star population, combined with a general lack of strong emissionlines (Dressler & Gunn, 1983; Wild et al., 2009). At intermediate red-shifts (), particularly strong outflows ()have been detected in the most luminous PSBs (; Tremonti et al., 2007), potentially representing the residual outflowfrom a quenching event. However, such galaxies are extremely rare,and may not represent the typical evolutionary path of red-sequencegalaxies at this epoch. More modest outflows ()have also been observed in less luminous PSBs at (; Coil et al., 2011), but it is unclear whether such outflows are sufficient to actually quench star-formation. At higher redshifts (), where we observe a rapid build-up of mass upon the red-sequence, recent evidence suggests that rapid quenching becomes increasingly more important (e.g. Barro et al., 2013; Carnall et al., 2018; Belli et al., 2018) and that a large fraction of massive galaxies () will experience a PSB phase (Wild et al., 2016; Belli et al., 2018). However, the nature of outflows in massive PSBs at this epoch has, until now, been largely unexplored.
Until recently, very few PSBs had been spectroscopically identified at high redshift (). However, significant progress was made by Maltby et al. (2016), when photometric PSB candidates identified using the Wild et al. (2014) ‘supercolour’ technique were targeted for follow-up spectroscopy. This led to high- PSBs being identified within the field of the Ultra Deep Survey (UDS; Almaini et al., in preparation). In this paper, we use the deep optical spectra of Maltby et al. (2016), plus additional spectra obtained more recently within the UDS field (see Section 2), to determine the prevalence of outflows in these galaxies. To achieve this, we perform a stacking analysis and analyse the structure of strong interstellar absorption features such as Mg ii ( Å). This is achievable for the first time with our large sample of high- PSB spectra.
The structure of this paper is as follows. In Section 2, we provide a brief description of the UDS data and spectroscopy upon which this work is based, including details of our PSB spectra and stacking procedure. In Section 3.1, we perform full spectral fits on our stacked spectra in order to measure their typical stellar velocity dispersions , while in Section 3.2 we describe the method used for detecting outflows from the Mg ii absorption feature and present our findings for high- PSBs. Finally, we draw our conclusions in Section 4. Throughout this paper, we use AB magnitudes and adopt a cosmology of , and .
2 Description of the Data
2.1 The UDS: photometric and spectroscopic data
This study makes use of the deep photometric data from the UDS (Almaini et al., in preparation).111http://www.nottingham.ac.uk/astronomy/UDS/ This survey represents the deepest component of the UKIRT (United Kingdom Infra-Red Telescope) Infrared Deep Sky Survey (UKIDSS; Lawrence et al., 2007) and comprises extremely deep UKIRT JHK photometry, covering an area of . For this study, we make use of the eighth UDS data release (DR8) where the limiting depths are ; and (AB; in apertures). The UDS is also complemented by extensive multiwavelength observations. These include deep-optical BVRi′z′ photometry from the Subaru–XMM-Newton Deep Survey (SXDS; Furusawa et al., 2008), mid-infrared observations ( and ) from the Spitzer UDS Legacy Program (SpUDS; PI: Dunlop) and deep -band photometry from MegaCam on the Canada–France–Hawaii Telescope (CFHT). The extent of the UDS field with full multiwavelength coverage (optical–mid-infrared) is . For a complete description of these data, see Hartley et al. (2013) and Simpson et al. (2012). In this work, where appropriate, we use the photometric redshifts and SED-derived stellar masses described in Simpson et al. (2013). We also use the galaxy -band structural parameters (effective radius ; Sérsic index ) described in Almaini et al. (2017).
Extensive deep optical spectroscopy is also available within the UDS field. These data are provided by several spectroscopic programmes. The largest sample was obtained by UDSz, the spectroscopic component of the UDS (ESO large programme 180.A-0776), which used both the VIMOS and FORS2 instruments on the ESO VLT to obtain low-/medium-resolution optical spectra for galaxies ( and ; exposures of – h and h, respectively; see Bradshaw et al., 2013; McLure et al., 2013). This is complemented by the spectroscopic follow-up of the Wild et al. (2014, 2016) sample of photometrically selected PSBs (ESO programme 094.A-0410; hereafter M16), which provides medium-resolution optical spectra from VIMOS (; exposures of h; see Maltby et al., 2016). Finally, the VANDELS spectroscopic survey (ESO programme 194.A-2003) also targets the UDS field, providing an additional medium-resolution VIMOS spectra (; exposures of h or h), mainly at , from the second data release (DR2; McLure et al., 2018; Pentericci et al., 2018). From these datasets, secure spectroscopic redshifts are available, all of which were determined via ez (Garilli et al., 2010), which uses a cross-correlation of spectral templates. Optimal solutions were also confirmed using spectral line identification in sgnaps (Paioro & Franzetti, 2012). For further details on these spectroscopic redshifts, see the relevant data papers. In this work, we use these to shift the individual galaxy spectra to their respective rest-frame (i.e. systemic frame).
In this spectroscopic study, we focus specifically on the redshift interval (see Section 2.2). Within the UDS (DR8) there are -band selected galaxies within this redshift range above the per cent mass-completeness limit of the survey ( at ; as determined using the method of Pozzetti et al. 2010). Of these galaxies, per cent have available optical spectra provided by the datasets above. These spectra evenly sample both the and redshift distribution of the parent photometric sample.
2.2 Post-starburst galaxies in the UDS
In general, PSBs are spectroscopically identified from the presence of strong Balmer absorption lines (e.g. H Å), combined with a general lack of strong emission lines (Dressler & Gunn, 1983; Wild et al., 2009). Therefore, to identify PSBs in the UDS, we use all the available optical spectroscopy (see Section 2.1) and apply the following criteria, where applicable: i) an equivalent width in H Å (a general PSB diagnostic; e.g. Goto, 2007); and ii) an equivalent width in [O ii] Å (a standard threshold to remove galaxies with significant on-going star formation; see e.g. Tran et al. 2003; Poggianti et al. 2009; Maltby et al. 2016). We note that, while a cut on [O ii] emission is necessary to avoid the contamination ofour samples by star-forming galaxies, this criterion will also removesome genuine PSBs that host significant AGN activity (Yan et al., 2006). The equivalent width () of a spectral line is defined as
| (1) |
where is the spectral flux and is the continuum flux. To determine the rest-frame equivalent width (), we use a non-parametric approach based on that used by previous works (e.g. Goto et al., 2003; Maltby et al., 2016). First, is used to transform the spectrum into the galaxy’s rest-frame. Then continuum flux is estimated across the relevant feature (i.e. H , [O ii]) using a linear interpolation between the continuum measured in narrow intervals on either side. These intervals are chosen to ensure a lack of significant absorption/emission lines and the continuum is modelled by a linear regression that includes both intervals, weighted by the inverse square error in the flux. A rejection to deviant points above/below an initial continuum model is also used to minimise the effect of noise. Finally, is determined using the ratio across an interval (–) that encapsulates the feature of interest (see Maltby et al., 2016, for more details). For each spectrum, the uncertainty in () is determined from the variance between simulated spectra generated by using the flux errors to add suitable Gaussian noise. Typical uncertainties in both and are Å ( per cent).
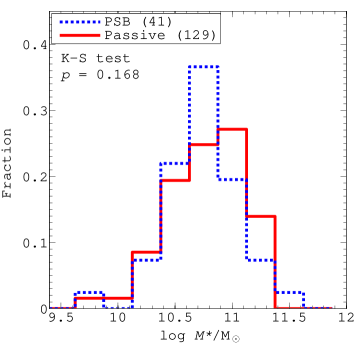
In this study, PSB classification depends on the assessment of both H ( Å) and [O ii] ( Å). Using the available data (see Section 2.1), this requirement restricts our PSB classification to , where these features are within the reach of our spectroscopy. This limits our analysis to spectra at , for which a spectroscopic PSB assessment is possible ( UDSz, M16 and VANDELS spectra). Applying our PSB criteria to these spectra (i.e. Å, Å), we obtain a final sample of spectroscopically classified PSBs at (see Table 1). For comparison to these PSBs, we also identify older passive systems (i.e. Å, Å) and obtain passive galaxy spectra at . In both these cases, the galaxies selected are typically of high stellar mass (; per cent; see Fig. 1). Various properties of our high- PSB and passive spectra are shown in Table. 1. Note that for our passive selection, the addition of a condition to the criteria (i.e. to select older, more secure passive galaxies; see Section 3.2), has no significant effect on the sample’s median properties or the results of this work.
| Galaxy | PSB | Passive | ||
|---|---|---|---|---|
| Property | Spec | Spec+PCA | Spec | Spec+PCA |
| – (udsz–fors2) | ||||
| – (udsz–vimos) | ||||
| – (m16) | ||||
| – (vandels) | ||||
| —————– Median values —————– | ||||
| (Å) | ||||
| (Å) | ||||
| (kpc; ) | ||||
| () | ||||
∗This is the median S/N of the individual spectra, as determined per resolution element and across the observed spectral range.
In this study, we mainly focus on spectroscopically classified galaxy populations. However, in the UDS field robust galaxy classifications (i.e. passive, star-forming, PSB) are also available from the photometric ‘supercolour’ technique of Wild et al. (2014, 2016), which is based on a Principal Component Analysis (PCA) of galaxy SEDs. The effectiveness of this photometric selection, and in particular its PSB classification, has recently been confirmed using the spectroscopic follow-up of Maltby et al. (2016). In that paper, it was reported that per cent of the photometrically selected PSBs show the expected strong Balmer absorption (i.e. Å) and that the confirmation rate remains high ( per cent), even when stricter criteria are used to exclude cases with significant [O ii] emission. We confirm that these findings hold for the extended spectral samples () used throughout this paper. These PCA classifications use a much wider baseline in wavelength than covered by our optical spectra (i.e. full SED information). Consequently, the supercolour technique is able to explicitly identify systems with a ‘hump’ in the SED around the Balmer region (– Å), which is characteristic of a dominant A/F star component. In this study, the addition of supercolour (PCA) class to our classification criteria will likely result in a sub-population of PSBs that host a more dominant A/F star population, and therefore experienced a more significant starburst. We make use of this sub-sample (Spec+PCA; PSBs) in a discussion of our results in Section 3.3, and various relevant properties are shown in Table 1. The properties of a photometrically selected sub-sample for passive galaxies are also shown for completeness, but not used in this work.
2.3 Generating stacked spectra
In order to determine the presence of gaseous outflows, we use the Mg ii absorption doublet (, Å), which is a sensitive tracer of low-ionisation interstellar gas (). We note that systemic-frame Mg ii absorption can originate from either the ISM or stellar photospheres, but the detection of a blue-shifted component to this absorption feature is generally thought to indicate galactic-scale outflows along the line-of-sight to the observer. In this study, per cent of our spectroscopically-classified galaxies (see Table 1) have full coverage of the Mg ii region ( PSB and passive spectra). Unfortunately, the signal-to-noise (S/N) of these VIMOS/FORS2 spectra is not sufficient to reliably determine the structure of the Mg ii profile on an individual galaxy basis [typically Å].222Note: throughout this study, S/N is defined per resolution element. We therefore increase the effective S/N via a stacking analysis, combining the individual rest-frame spectra following an optimised flux normalisation. The following procedure is used.
-
1.
The individual spectra are shifted to their respective rest-frame and oversampled onto a common and finer dispersion axis ( Å). For this we use the spectroscopic redshifts () computed with ez, which are determined using a cross-correlation of spectral templates (see Section 2.1). We note that using an alternative , defined using a single stellar absorption feature which is present in all our spectra, i.e. Ca ii K ( Å), has no significant effect on the results of this work.
-
2.
We combine the individual rest-frame spectra following an optimised flux normalisation. In this study, in addition to our analysis of the Mg ii absorption feature ( Å), we also wish to obtain stellar velocity dispersions using features at Å (see Section 3.1). Therefore, to optimise our analysis we generate two median-stacked spectra: (a) a red-optimised stack ( Å), using the full spectroscopically classified sample (see Table 1) and a flux normalisation over the Balmer break region ( Å); and (b) a blue-optimised stack ( Å), using only spectra with Mg ii coverage and a flux normalisation over the Mg ii continuum ( Å). In both cases, the normalised spectra are averaged without any weighting to avoid any bias towards the brightest galaxies with the highest S/N. For the blue-optimised stack, we also apply a nominal S/N cut to the individual spectra, as determined over the Mg ii region [ Å], in order to remove the influence of poor quality spectra on our stacked Mg ii profiles ( per cent of our high- spectra).
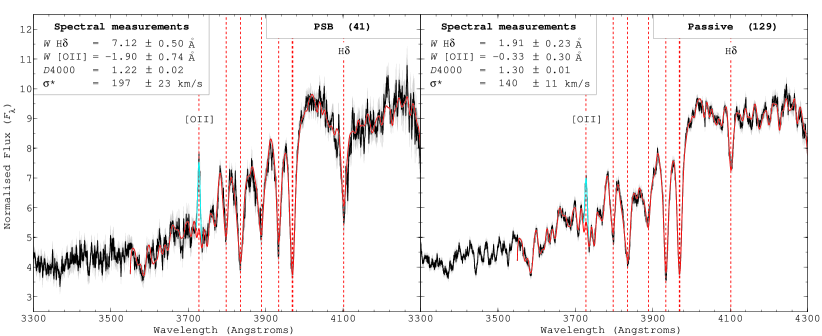
The final red-optimised stacks for both our high- PSB and passive galaxies are shown in Fig. 2. These spectra are used to determine the typical stellar velocity dispersions of their respective galaxy populations in Section 3.1. The blue-optimised stacks are used to determine the presence of outflows in these galaxies and are presented in Section 3.2 (see Fig. 4). The effective spectral resolution of these stacked spectra is Å (). Uncertainties in these spectra are determined from the mean of the standard errors from simulated median-stacks generated via a bootstrap technique.
In this study, we note that while the majority of our individual spectra have a similar spectral resolution (), our sample does include a small number of low-resolution spectra () from UDSz-vimos (see Table 1). These low-resolution spectra are of high S/N and include some of the brightest and most significant PSB spectra within our sample. Consequently, in order to maximise the effective S/N, and prevent biasing our sample against these galaxies, we include these low-resolution spectra in our stacking analysis. However, we note that removing these spectra from our samples has no major impact on our Mg ii analysis or conclusions. Furthermore, a consistent Mg ii profile and PSB outflow velocity is obtained using just these low-resolution spectra. We also obtain consistent results if all spectra are reduced in resolution to .
3 Results and discussion
3.1 Stellar velocity dispersion
To gain insight into our high- PSB and passive galaxies, we perform full spectral fitting on their stacked spectra (red-optimised; Fig. 2) using the penalized pixel-fitting method (ppxf; Cappellari & Emsellem 2004; Cappellari 2017) and the MILES stellar templates (Vazdekis et al., 2010). These fits can be used to determine the typical stellar velocity dispersion of our galaxy populations, provided a suitable estimate for any additional sources of spectral broadening. For example, the effective instrumental response () and the broadening introduced by stacking (). In this study, we assume all broadening functions are Gaussian, consequently can be recovered from the observed dispersion following Cappellari et al. (2009),
| (2) |
However, to determine , ppxf requires the stellar templates used for spectral fitting to have a spectral resolution that matches that of the stacked spectrum. The additional broadening required for the best fit is then used to determine . In this study, we use the MILES stellar library, which is an empirical library of stellar templates covering the optical regime (– Å). These templates have a well-defined spectral resolution of Å (Sánchez-Blázquez et al., 2006; Falcón-Barroso et al., 2011), which is very different to that of our stacked spectra ( Å; see Section 2.3). Consequently, prior to fitting, we broaden these stellar templates to match that of the effective spectral resolution of our stacked spectra (FWHM), where
| (3) |
For each stacked spectrum, we estimate the effective using the median [] of the input spectra, where is the observed-frame instrument response as determined from the resolving power of the respective spectrograph (see Section 2.1)333Note: in our analysis, we retain the small fraction of low-resolution UDSz–vimos spectra () that contribute to our final stacked spectra (see Table 1). However, we note that removing these spectra from our analysis has no significant impact on the measurements for our galaxy populations, or our conclusions.. In this study, we find is typically Å (). The broadening related to stacking spectra, , originates from redshift errors and the error introduced by shifting the individual spectra to their rest-frame. In this study, we use an indicative value for estimated using the variance in , obtained from the redshift measurements of simulated spectra with the same spectral resolution, wavelength sampling and as our observations. From this we determine that Å () and is essentially negligible with respect to the instrumental and intrinsic broadening. Finally, to determine the typical from our stacked spectra, we perform spectral fits with ppxf over the wavelength range – Å, and using a model consisting of the stellar component plus the [O ii] and H emission lines. The final and its respective uncertainty are determined using the median and variance of fits performed on simulated spectra generated via a bootstrap analysis.
For our high- PSB and passive galaxies, the resultant ppxf fits to their stacked spectra are shown in Fig. 2. In all cases, our stacked spectra are well-modelled by the resultant spectral fits, with reduced chi-squared values of . These fits yield high values for both our galaxy populations [; ], as expected for their high stellar masses (median ; see Table 1 and Fig. 3).
| Galaxy | PSB | Passive | ||
|---|---|---|---|---|
| Property | Spec | Spec+PCA | Spec | Spec+PCA |
| (kpc; ) | ||||
| () | ||||
| *Derived using Equation 4. | ||||
From the Scalar Virial Theorem, it is well established that is related to dynamical mass ,
| (4) |
where is the gravitational constant and is the virial coefficient. This coefficient () takes into account projection effects and the structure of the mass distribution. Under the assumption that the mass follows a Sérsic distribution, the virial coefficient has been computed by several authors (e.g. Prugniel & Simien, 1997; Bertin et al., 2002; Cappellari et al., 2006). For example, Bertin et al. (2002) provide a simple analytical approximation,
| (5) |
(see also Taylor et al. 2010 and Zahid & Geller 2017, for useful explanations). Therefore, using the -band structural parameters for our galaxy populations (see Table 1), we can use our measurements to estimate their typical dynamical mass . These estimates confirm that both our PSB and passive galaxies are intrinsically massive in nature (; see Table 2). We note that consistent results are obtained using alternative derivations for the dynamical mass (e.g. Cappellari et al., 2006, 2013, who find that is approximately twice the total mass within ). Finally, we note that the virial coefficient assumed in this work (Bertin et al., 2002) is derived assuming a central measurement (aperture ), while our measurements are likely to be averaged over a much larger aperture. However, based on the aperture corrections from previous studies (e.g. Cappellari et al., 2006), the difference between our measurements and the central is expected to be per cent. Therefore, this issue is not expected to have a significant impact on the results of this work.
| Galaxy | PSB | Passive | ||
|---|---|---|---|---|
| Property | Low | High | Low | High |
| (kpc; ) | ||||
| () | ||||
| *Derived using Equation 4. | ||||
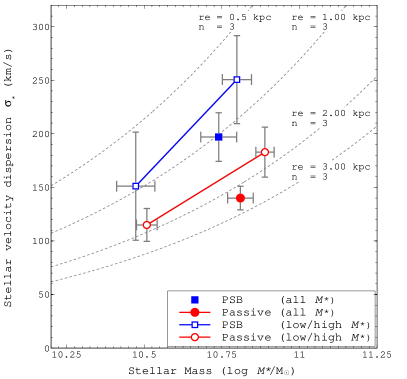
Finally, to expand on our results, we also separate our galaxy populations by stellar mass , and obtain the typical measurements from the resultant stacked spectra (for the distribution of our samples, see Fig. 1). We separate our sample into low mass () and high mass (), and compare the resultant with the median in each sub-sample (see Fig. 3 and Table 3). As expected, we find that increases with for both the PSB and passive galaxy populations. Furthermore, we find that for high- PSBs, there is a tentative indication that they present higher than analogous passive galaxies, particularly at the highest masses (). We compare these results to the dynamical mass (, , ) relations from Equation 4, for various structural configurations (see Fig. 3). Although these relations are only applicable for dynamical mass , they suggest that our – results indicate that high- PSBs are slightly more compact (i.e. smaller ) than passive galaxies, at the same stellar mass. This is consistent with the findings of Almaini et al. (2017) and Maltby et al. (2018) for this galaxy population, who used the photometric PCA (i.e. supercolour) classifications and galaxy structural parameters (, ). Overall, we suggest that these results are consistent with a recent compaction event for high- PSBs, which may have triggered the preceding starburst, potentially high-velocity outflows (see Section 3.2) and subsequent quenching.
3.2 Measuring outflows from Mg ii absorption
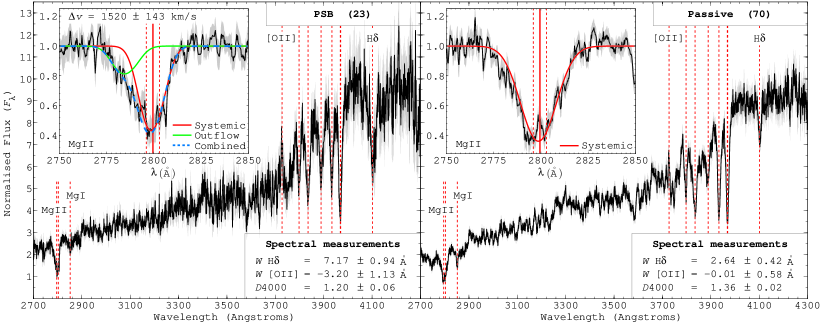
In this section, we determine the prevalence of galaxy-scale outflows in our galaxy populations using their blue-optimised stacked spectra (see Section 2.3 and Fig. 4). To achieve this, we analyse the structure of the Mg ii absorption profile, which is a sensitive tracer of the low-ionisation interstellar medium (ISM). For our high- PSBs, an initial inspection of their stacked spectrum reveals significant asymmetry in the Mg ii profile (see Fig. 4). With respect to the central systemic wavelength of the Mg ii doublet ( Å), there is a clear excess of absorption towards bluer wavelengths. In contrast, for high- passive galaxies, no such asymmetry or excess blue absorption is observed.
To determine the significance of this result, and detect the presence of any outflowing component, we use the following procedure. First, we normalise for the continuum across Mg ii, using a smoothing spline fit to the continuum flux on either side of the Mg ii feature. We then model the Mg ii absorption profile using either one or two components, as follows.
-
1.
One component (systemic absorption): the Mg ii absorption is modelled using a single component, fixed at the rest-frame wavelength for the systemic absorption (ISM + stellar). This component consists of a doublet (, Å), with an intensity ratio of 1.2:1, as observed for massive high- galaxies in the high resolution spectra of Weiner et al. (2009). In the fitting process, each line is given an initial narrow width (Å), and then convolved with a Gaussian to model the spectral broadening, which is necessary since the Mg ii doublet is essentially unresolved in our spectra. In each case, the width of the Gaussian used for convolution is fixed using an initial fit to only the red-side of the Mg ii profile (i.e. Å). This region of the absorption profile is largely unaffected by the potential contamination from any outflowing component, and therefore provides a suitable estimate for the intrinsic width of the absorption line. For our high- PSBs, this model reveals that per cent of the absorption on the blue-side of the Mg ii profile (Å) is not accounted for by the systemic component.
-
2.
Two components (systemic absorption + outflow): the Mg ii absorption is modelled using two components, one fixed at the rest-frame wavelength for the systemic absorption (ISM + stellar), and another with a free centroid to model the outflow. Each component consists of a Gaussian-convolved doublet, as described above.444Note: with this two-component model, we find consistent results are also obtained when using a free-width Gaussian for the convolution. This simple model yields an offset of the outflowing component with respect to the systemic-frame wavelength, which can be used to determine its characteristic velocity offset from the systemic redshift.555Note: here the systemic redshift is defined as the template-fitting from ez. However, entirely consistent offsets are also obtained if a strong stellar absorption line (e.g. Ca ii K) is used to define the systemic redshift. For our stacked spectra, represents an estimate of the typical outflow velocity in the low-ionisation gas for our galaxy populations. However, based on simulations, we note that will likely be an over-estimate of the actual median outflow velocity by (see Appendix A). The uncertainties in these velocity measurements are determined using the variance between analogous fits performed on simulated spectra generated via a bootstrap analysis.
To determine which of these models best describes the Mg ii profile, and therefore determine the presence of an outflowing component, we use an F-test. Formally, the two-component model will always provide the best fit to the data, but an F-test can be used to determine whether the additional outflowing component is statistically required. This F-test yields a -value for accepting the null hypothesis (i.e. that an outflowing component is not required), and rejects the two-component model if .
For our high- PSB and passive galaxies, the relevant fits to the Mg ii profile are presented in Fig. 4. For high- PSBs, the Mg ii profile presents a significant excess of blue-shifted absorption ( per cent). In this case, our best-fitting two-component model yields an outflow component with a large velocity offset (), indicating these galaxies host high-velocity outflows in their interstellar medium (ISM). Based on our simulations, this corresponds to a typical outflow velocity of (see Appendix A). The significance of this outflowing component is , as determined by an F-test ( ). In contrast, for high- passive galaxies, we find that no significant outflow component is required to account for their Mg ii profile, which is also confirmed by an F-test ( ). Furthermore, the weaker Mg i absorption line, which is another tracer of the low-ionisation ISM, also shows no signs of a significant outflowing component.
For our high- PSBs, the outflow velocities we measure depend significantly on the correct modelling of the systemic component. However, an alternative boxcar method can also be used to measure outflow velocities, and this does not suffer from this dependency (see e.g. Rubin et al., 2010; Bordoloi et al., 2014). In this method, the mean outflow velocity is estimated from the global shift of the observed absorption line as follows,
| (6) |
Here and are the equivalent widths of the full Mg ii absorption profile and its outflowing component, respectively, and is the mean absorption weighted velocity of the observed absorption line. To determine , the difference in equivalent width between the red and blue-side of the Mg ii absorption profile is used (see Rubin et al. 2010 and Bordoloi et al. 2014, for further details). For our high- PSBs, we use this method to confirm the presence of high-velocity outflows, obtaining a mean outflow velocity of for this population. The uncertainty in this velocity is determined using the variance between measurements performed on simulated spectra generated via a bootstrap analysis. We note that this outflow velocity is slightly lower than that obtained from our decomposition method, but nonetheless confirms the presence of high-velocity outflows in our high- PSBs.
With respect to the outflowing component, the absorption strength (i.e. equivalent width) can also provide insight into the nature of outflows in our high- PSBs. Since Mg ii absorbing gas is optically thick at low column densities (), if present, the absorption is generally saturated in both the stellar and ISM components (see e.g. Weiner et al., 2009). This is apparent in our high- passive galaxies, where the Mg ii doublet is just resolved in their stacked profile (see Fig. 4). For non-saturated Mg ii absorption the line ratio is 2:1, but in this case it is close to 1:1, indicating near saturated absorption. For our high- PSBs, we note that despite the expected saturation in both the systemic and outflowing components, the Mg ii profile is dominated by the systemic absorption (see Fig. 4). In a stacked spectrum, this could be due to a combination of i) high-velocity outflows being present in only a fraction of the sample; and ii) the typical covering fraction of the outflowing wind, which is the fraction of the stellar distribution it obscures along the line-of-sight (e.g. due to a collimated and/or clumpy outflow). Consequently, for the outflowing component, the Mg ii absorption depth can be defined as and is for our high- PSBs (see Fig. 4). In comparison to the stacked spectra of previous works, we find this absorption depth to be significantly lower than that of massive star-forming/starburst galaxies at (where ; Weiner et al., 2009). This difference could be explained by a lower covering fraction , but we suggest the more likely explanation is due to a lower detection fraction in our PSBs, potentially due to the high-velocity outflows only persisting for the early PSB phase (see Section 3.3). Based on the typical covering fraction of local starbursts ( = –; Rupke et al., 2005), we estimate that for our high- PSB outflows.
With respect to the systemic component, since stellar Mg ii absorption is known to increase in strength for older stellar populations (see e.g. Martin & Bouché, 2009), for our PSB and passive spectra the dominant contribution to the systemic Mg ii is expected to be stellar in origin. In this work, we have modelled the systemic absorption (ISM + stellar) as a single component comprising a Gaussian-convolved doublet. An alternative approach is to use synthetic (i.e. theoretical) stellar libraries (e.g. UVBLUE, Rodríguez-Merino et al., 2005; Coelho, 2014), to estimate and remove the stellar Mg ii component using full spectral fitting. However, we note that while these theoretical stellar libraries cover the UV region ( Å) they are not as robust as the empirical libraries available in the optical regime (e.g. MILES; Vazdekis et al., 2010). For example, it is known that i) various regions of the UV spectrum are poorly reproduced; and ii) the prominent metallic lines in F/G stars (including Mg ii), are always stronger in the synthetic spectra than in observed stars (see Rodríguez-Merino et al., 2005, for further details). This is also true to a lesser extent for A-stars (see fig. 10 from Rodríguez-Merino et al., 2005). Due to these uncertainties, and since A/F stars will be a significant component in our PSB spectra, we have chosen not to adopt this approach for our primary analysis of the Mg ii profile. However, we have explored this issue in detail (see Appendix B), and confirm that consistent outflow velocities are obtained using this alternative approach. Although, for our high- PSBs, we also note that while the significance of the outflowing component remains , the strength (i.e. absorption depth ) is reduced. This is consistent with either a smaller covering fraction or lower detection fraction for these winds than indicated by our two-component Gaussian model (see Appendix B).
3.3 The origin of high-velocity outflows in PSBs
To expand on our results, we use the index, which is a proxy for both the mean age and metallicity of a galaxy’s stellar population (Bruzual, 1983). This index measures the strength of the Å break, and is consequently small for young stellar populations, and larger for both older, and more metal-rich galaxies. In this study,
| (7) |
following the revised definition outlined by Balogh et al. (1999). From the individual spectra, the median value of is for our PSBs, and for our passive galaxies (see Table 1). Using the index to divide our spectral samples, we find a tentative hint that high-velocity outflows are more significant (as determined by an F-test; see Section 3.2) in the stacked spectra of younger PSB galaxies (i.e. ). This potential relationship between high-velocity outflows and star-formation history (SFH) will be explored in more detail in future work. For our passive galaxies, where no outflows are detected, we find that the addition of a condition to their selection criteria, e.g. to select either younger (), or older, more secure passive galaxies (), has no significant effect on the nature of their stacked Mg ii profile or the lack of an outflowing component. If confirmed, these results might suggest that for our PSBs, the high-velocity outflows were launched during, or shortly after, the preceding starburst, and may have ceased by the time the galaxy becomes truly passive. This would suggest an inherent relationship between the high-velocity wind and the quenching of star formation.
In comparison to previous works, we find that for high- PSBs the high-velocity outflows we detect () are much faster than those observed in typical star-forming galaxies at this epoch (e.g. Talia et al., 2012; Bradshaw et al., 2013; Bordoloi et al., 2014). Such high-velocity outflows are only consistent with those of either star-forming AGN (e.g. Hainline et al., 2011; Harrison et al., 2012; Talia et al., 2017) or the massive () starburst/post-starburst galaxies observed at (e.g. Tremonti et al., 2007; Geach et al., 2014; Sell et al., 2014). For our massive high- PSBs (median ; see Table 1), this would be consistent with the high-velocity winds being launched during the preceding starburst, rather than during a phase of more general star-forming activity. In particular, it is interesting that these high- outflows are consistent with those of the luminous, massive, young, but also much rarer PSBs at lower redshift (; Tremonti et al., 2007). This is suggestive of a common quenching mechanism for massive PSBs that is simply more frequent at . This is consistent with a scenario in which rapid quenching, which is required to trigger the PSB phase, becomes more prevalent at (see e.g. Barro et al., 2013; Carnall et al., 2018; Belli et al., 2018).
To establish the potential role of these high-velocity outflows in quenching star formation, it is useful to consider the escape velocity of the host galaxy
| (8) |
For our high- PSBs, we use their dynamical mass estimates (see Section 3.1), and find that is typically (determined at a galactocentric radius ). Since the high-velocity outflows detected in our high- PSBs () will likely correspond to scales (i.e. radii) greater than , we find that for these galaxies. This suggests the outflowing gas will ultimately escape from the galaxy’s gravitational well, or sweep into the surrounding circum-galactic medium (CGM) creating an expanding shell (or bubble) that prevents future gas accretion (see e.g. Lochhaas et al., 2018). For our high- PSBs, estimates of the time elapsed since starburst are typically up to (Wild et al. in preparation). Consequently, if the outflowing winds were launched during the starburst event, they should have reached scales of several hundred kpc by the time of our observations. On these scales, one might expect the outflowing wind to have encountered significant gas in the CGM and slowed down. We make two main comments on this issue below.
-
1.
For our high- PSBs, the stacked Mg ii profile has an outflowing component with an absorption depth that could indicate the high-velocity outflows are only present in per cent of our sample (see Fig. 4 and Section 3.2). If this outflow signal is driven by the youngest PSBs (as tentively indicated by our analysis above), then the detected outflows might not have necessarily reached the scales implied by the typical of the full sample.
-
2.
Recent observations have indicated that both local and intermediate-redshift () PSBs retain a significant molecular gas reservoir following the quenching of star formation (French et al., 2015; Rowlands et al., 2015; Suess et al., 2017). Consequently, if an AGN was triggered during the starburst event, it could linger into the post-starburst phase and continue to drive the high-velocity outflows from the residual ISM, even after the quenching of star formation. It is also possible that the high-velocity wind is maintained during the post-starburst phase by flickering AGN activity, or residual AGN activity that is optically obscured (so not detectable from line emission in our spectra).
With respect to the quenching mechanism, using the -band structural parameters available within the UDS field (Almaini et al., 2017), we find that the high- PSBs in our spectroscopic sample are typically compact and spheroidally-dominated (effective radius and Sérsic index ; see Table 1), with structures similar to that of our high- passive galaxies. This result is consistent with previous studies that use only photometrically selected PSB samples (e.g. Whitaker et al., 2012; Yano et al., 2016; Almaini et al., 2017; Maltby et al., 2018). We note that the -band structural parameters in the UDS are from ground-based imaging, but consistent results are also obtained using the limited fraction ( per cent) of our spectroscopic sample that has structural parameters available from the Hubble Space Telescope (HST) -band imaging of the CANDELS survey (Grogin et al., 2011; Koekemoer et al., 2011; van der Wel et al., 2012). Using the -band structural parameters, we also find a tentative hint that high-velocity outflows are more significant (as determined by an F-test; see Section 3.2) in the stacked spectra of the most compact PSB galaxies (). Larger samples are needed to confirm these findings. Taken together, these results suggest a scenario involving a recent compaction event for high- PSBs, which may have triggered the preceding starburst, high-velocity outflows and subsequent quenching. Such an event could be, for example, a gas-rich major merger (e.g. Hopkins et al., 2009; Wellons et al., 2015) or a dissipative ‘protogalactic disc collapse’ (e.g. Dekel et al., 2009; Zolotov et al., 2015).
To build on this discussion, we also consider a sub-sample of spectroscopic PSBs (Spec+PCA) where photometric PCA class (i.e. supercolour) has been used to identify systems that are likely to have experienced a more significant starburst (see Section 2.2). With respect to their structural parameters, interestingly, we find that these Spec+PCA PSBs are significantly more compact () than those defined from spectroscopy alone, and consistent with previous studies that use only photometric PCA (supercolour) classifications (Almaini et al., 2017; Maltby et al., 2018). This suggests that the addition of photometric-selection criteria isolates PSBs that have undergone a more significant gas-rich dissipative event, which would also result in a more significant starburst, prior to quenching. Interestingly, we also find a tentative hint that high-velocity outflows are more significant in these Spec+PCA PSBs. If confirmed, this would suggest an intrinsic link between the compaction event, subsequent starburst and the launch of high-velocity outflows.
Overall, our results suggest that for massive high- PSBs, high-velocity winds were launched during the preceding starburst, and potentially represent the residual signature of a feedback process that quenched their star formation. These winds could either be caused by the starburst itself, or an AGN that was triggered during the compaction event. Within the optical regime probed by our spectra, several AGN signatures are covered (e.g. [Ne v] , Å; [Ne iii] Å). However, we do not find any evidence for such features in our stacked PSB spectra (see Figs. 2 and 4), or on an individual basis. Although, we note that due to the [O ii] condition used in our PSB criteria ( Å; see Section 2.2), we would likely remove any PSBs with AGN that cause significant optical line emission (Yan et al., 2006). Taken together, this suggests that for our high- PSBs either i) these galaxies were quenched via stellar feedback from the starburst itself; or ii) if AGN feedback is responsible, the AGN episode that triggered quenching does not linger into the post-starburst phase, as required by some models (e.g. Hopkins, 2012). We note, however, that using X-ray data the presence of hidden AGN has been detected in galaxies where no optical AGN signatures are apparent (e.g. Cimatti et al., 2013). Consequently, this issue will be explored in more detail in a forthcoming paper, using the X-ray data available in the UDS field (Almaini et al., in preparation).
4 Conclusions
In this study, we have examined the prevalence of galaxy-scale outflows in post-starburst galaxies at high redshift (), using the deep optical spectra available in the UDS field. Using a stacking analysis, we find that for massive () PSBs at , there is clear evidence for a strong blue-shifted component to the Mg ii absorption feature, indicative of high-velocity outflows () in their interstellar medium. These outflowing winds are likely to have been launched during the preceding starburst, and therefore may represent the residual signature of a feedback event which quenched their star-formation. Using full spectral fitting, we also obtain a typical stellar velocity dispersion for these PSBs of , which confirms they are intrinsically massive in nature (dynamical mass ). Given that these high- PSBs are also exceptionally compact (–) and spheroidal (Sérsic index ), we propose that the outflowing winds may have been launched during a recent compaction event (e.g. major merger or disc collapse) that triggered either a centralised starburst or AGN activity. Furthermore, we find no optical signatures of AGN activity in these galaxies, suggesting they were either rapidly quenched by stellar feedback from the starburst itself, or that if AGN feedback is responsible, the AGN episode that triggered quenching does not linger into the post-starburst phase.
5 Acknowledgements
We thank the anonymous referee for their detailed and insightful comments on the original version of this manuscript, which helped to improve it considerably. We also thank Mike Merrifield and Paula Coelho for useful discussions. This work is based on observations from ESO telescopes at the Paranal Observatory (programmes 094.A-0410, 180.A-0776 and 194.A-2003). AC acknowledges the support from grants PRIN-MIUR 2015, ASI n.I/023/12/0 and ASI n. 2018-23-HH.0.
References
- Almaini et al. (2017) Almaini O., et al., 2017, MNRAS, 472, 1401
- Balogh et al. (1999) Balogh M. L., Morris S. L., Yee H. K. C., Carlberg R. G., Ellingson E., 1999, ApJ, 527, 54
- Barro et al. (2013) Barro G., et al., 2013, ApJ, 765, 104
- Bell et al. (2004) Bell E. F., et al., 2004, ApJ, 608, 752
- Belli et al. (2018) Belli S., Newman A. B., Ellis R. S., 2018, arXiv e-prints,
- Bertin et al. (2002) Bertin G., Ciotti L., Del Principe M., 2002, A&A, 386, 149
- Best et al. (2005) Best P. N., Kauffmann G., Heckman T. M., Brinchmann J., Charlot S., Ivezić Ž., White S. D. M., 2005, MNRAS, 362, 25
- Best et al. (2006) Best P. N., Kaiser C. R., Heckman T. M., Kauffmann G., 2006, MNRAS, 368, L67
- Bordoloi et al. (2014) Bordoloi R., et al., 2014, ApJ, 794, 130
- Bradshaw et al. (2013) Bradshaw E. J., et al., 2013, MNRAS, 433, 194
- Brammer et al. (2011) Brammer G. B., et al., 2011, ApJ, 739, 24
- Bruzual (1983) Bruzual G., 1983, ApJ, 273, 105
- Cappellari (2017) Cappellari M., 2017, MNRAS, 466, 798
- Cappellari & Emsellem (2004) Cappellari M., Emsellem E., 2004, PASP, 116, 138
- Cappellari et al. (2006) Cappellari M., et al., 2006, MNRAS, 366, 1126
- Cappellari et al. (2009) Cappellari M., et al., 2009, ApJ, 704, L34
- Cappellari et al. (2013) Cappellari M., et al., 2013, MNRAS, 432, 1709
- Carnall et al. (2018) Carnall A. C., McLure R. J., Dunlop J. S., Davé R., 2018, MNRAS, 480, 4379
- Cicone et al. (2014) Cicone C., et al., 2014, A&A, 562, A21
- Cimatti et al. (2013) Cimatti A., et al., 2013, ApJ, 779, L13
- Cirasuolo et al. (2007) Cirasuolo M., et al., 2007, MNRAS, 380, 585
- Coelho (2014) Coelho P. R. T., 2014, MNRAS, 440, 1027
- Coil et al. (2011) Coil A. L., Weiner B. J., Holz D. E., Cooper M. C., Yan R., Aird J., 2011, ApJ, 743, 46
- Dekel & Birnboim (2006) Dekel A., Birnboim Y., 2006, MNRAS, 368, 2
- Dekel et al. (2009) Dekel A., et al., 2009, Nature, 457, 451
- Diamond-Stanic et al. (2012) Diamond-Stanic A. M., Moustakas J., Tremonti C. A., Coil A. L., Hickox R. C., Robaina A. R., Rudnick G. H., Sell P. H., 2012, ApJ, 755, L26
- Dressler & Gunn (1983) Dressler A., Gunn J. E., 1983, ApJ, 270, 7
- Du et al. (2018) Du X., et al., 2018, ApJ, 860, 75
- Faber et al. (2007) Faber S. M., et al., 2007, ApJ, 665, 265
- Falcón-Barroso et al. (2011) Falcón-Barroso J., Sánchez-Blázquez P., Vazdekis A., Ricciardelli E., Cardiel N., Cenarro A. J., Gorgas J., Peletier R. F., 2011, A&A, 532, A95
- Fluetsch et al. (2019) Fluetsch A., et al., 2019, MNRAS, 483, 4586
- French et al. (2015) French K. D., Yang Y., Zabludoff A., Narayanan D., Shirley Y., Walter F., Smith J.-D., Tremonti C. A., 2015, ApJ, 801, 1
- Furusawa et al. (2008) Furusawa H., et al., 2008, ApJS, 176, 1
- Garilli et al. (2010) Garilli B., Fumana M., Franzetti P., Paioro L., Scodeggio M., Le Fèvre O., Paltani S., Scaramella R., 2010, PASP, 122, 827
- Geach et al. (2014) Geach J. E., et al., 2014, Nature, 516, 68
- Goto (2007) Goto T., 2007, MNRAS, 381, 187
- Goto et al. (2003) Goto T., et al., 2003, PASJ, 55, 771
- Grogin et al. (2011) Grogin N. A., et al., 2011, ApJS, 197, 35
- Gunn & Gott (1972) Gunn J. E., Gott III J. R., 1972, ApJ, 176, 1
- Hainline et al. (2011) Hainline K. N., Shapley A. E., Greene J. E., Steidel C. C., 2011, ApJ, 733, 31
- Harrison et al. (2012) Harrison C. M., et al., 2012, MNRAS, 426, 1073
- Hartley et al. (2013) Hartley W. G., et al., 2013, MNRAS, 431, 3045
- Heckman & Borthakur (2016) Heckman T. M., Borthakur S., 2016, ApJ, 822, 9
- Heckman et al. (2000) Heckman T. M., Lehnert M. D., Strickland D. K., Armus L., 2000, ApJS, 129, 493
- Heckman et al. (2015) Heckman T. M., Alexandroff R. M., Borthakur S., Overzier R., Leitherer C., 2015, ApJ, 809, 147
- Hopkins (2012) Hopkins P. F., 2012, MNRAS, 420, L8
- Hopkins et al. (2005) Hopkins P. F., Hernquist L., Cox T. J., Di Matteo T., Martini P., Robertson B., Springel V., 2005, ApJ, 630, 705
- Hopkins et al. (2009) Hopkins P. F., Cox T. J., Younger J. D., Hernquist L., 2009, ApJ, 691, 1168
- Ilbert et al. (2013) Ilbert O., et al., 2013, A&A, 556, A55
- Koekemoer et al. (2011) Koekemoer A. M., et al., 2011, ApJS, 197, 36
- Larson et al. (1980) Larson R. B., Tinsley B. M., Caldwell C. N., 1980, ApJ, 237, 692
- Lawrence et al. (2007) Lawrence A., et al., 2007, MNRAS, 379, 1599
- Lochhaas et al. (2018) Lochhaas C., Thompson T. A., Quataert E., Weinberg D. H., 2018, MNRAS, 481, 1873
- Maltby et al. (2016) Maltby D. T., et al., 2016, MNRAS, 459, L114
- Maltby et al. (2018) Maltby D. T., Almaini O., Wild V., Hatch N. A., Hartley W. G., Simpson C., Rowlands K., Socolovsky M., 2018, MNRAS, 480, 381
- Martig et al. (2009) Martig M., Bournaud F., Teyssier R., Dekel A., 2009, ApJ, 707, 250
- Martin (2005) Martin C. L., 2005, ApJ, 621, 227
- Martin & Bouché (2009) Martin C. L., Bouché N., 2009, ApJ, 703, 1394
- McLure et al. (2013) McLure R. J., et al., 2013, MNRAS, 428, 1088
- McLure et al. (2018) McLure R. J., et al., 2018, MNRAS, 479, 25
- Muzzin et al. (2013) Muzzin A., et al., 2013, ApJ, 777, 18
- Paioro & Franzetti (2012) Paioro L., Franzetti P., 2012, SGNAPS: Software for Graphical Navigation, Analysis and Plotting of Spectra, Astrophysics Source Code Library (ascl:1210.005)
- Peng et al. (2015) Peng Y., Maiolino R., Cochrane R., 2015, Nature, 521, 192
- Pentericci et al. (2018) Pentericci L., et al., 2018, A&A, 616, A174
- Poggianti et al. (2009) Poggianti B. M., et al., 2009, ApJ, 693, 112
- Pozzetti et al. (2010) Pozzetti L., et al., 2010, A&A, 523, A13
- Prugniel & Simien (1997) Prugniel P., Simien F., 1997, A&A, 321, 111
- Roberts-Borsani & Saintonge (2019) Roberts-Borsani G. W., Saintonge A., 2019, MNRAS, 482, 4111
- Rodríguez-Merino et al. (2005) Rodríguez-Merino L. H., Chavez M., Bertone E., Buzzoni A., 2005, ApJ, 626, 411
- Rowlands et al. (2015) Rowlands K., Wild V., Nesvadba N., Sibthorpe B., Mortier A., Lehnert M., da Cunha E., 2015, MNRAS, 448, 258
- Rubin et al. (2010) Rubin K. H. R., Weiner B. J., Koo D. C., Martin C. L., Prochaska J. X., Coil A. L., Newman J. A., 2010, ApJ, 719, 1503
- Rubin et al. (2014) Rubin K. H. R., Prochaska J. X., Koo D. C., Phillips A. C., Martin C. L., Winstrom L. O., 2014, ApJ, 794, 156
- Rupke et al. (2005) Rupke D. S., Veilleux S., Sanders D. B., 2005, ApJS, 160, 115
- Sánchez-Blázquez et al. (2006) Sánchez-Blázquez P., et al., 2006, MNRAS, 371, 703
- Schawinski et al. (2014) Schawinski K., et al., 2014, MNRAS, 440, 889
- Sell et al. (2014) Sell P. H., et al., 2014, MNRAS, 441, 3417
- Silk & Rees (1998) Silk J., Rees M. J., 1998, A&A, 331, L1
- Simpson et al. (2012) Simpson C., et al., 2012, MNRAS, 421, 3060
- Simpson et al. (2013) Simpson C., Westoby P., Arumugam V., Ivison R., Hartley W., Almaini O., 2013, MNRAS, 433, 2647
- Sommariva et al. (2012) Sommariva V., Mannucci F., Cresci G., Maiolino R., Marconi A., Nagao T., Baroni A., Grazian A., 2012, A&A, 539, A136
- Strateva et al. (2001) Strateva I., et al., 2001, AJ, 122, 1861
- Suess et al. (2017) Suess K. A., Bezanson R., Spilker J. S., Kriek M., Greene J. E., Feldmann R., Hunt Q., Narayanan D., 2017, ApJ, 846, L14
- Talia et al. (2012) Talia M., et al., 2012, A&A, 539, A61
- Talia et al. (2017) Talia M., et al., 2017, MNRAS, 471, 4527
- Taylor et al. (2010) Taylor E. N., Franx M., Brinchmann J., van der Wel A., van Dokkum P. G., 2010, ApJ, 722, 1
- Tran et al. (2003) Tran K.-V. H., Franx M., Illingworth G., Kelson D. D., van Dokkum P., 2003, ApJ, 599, 865
- Tremonti et al. (2007) Tremonti C. A., Moustakas J., Diamond-Stanic A. M., 2007, ApJ, 663, L77
- Vazdekis et al. (2010) Vazdekis A., Sánchez-Blázquez P., Falcón-Barroso J., Cenarro A. J., Beasley M. A., Cardiel N., Gorgas J., Peletier R. F., 2010, MNRAS, 404, 1639
- Weiner et al. (2009) Weiner B. J., et al., 2009, ApJ, 692, 187
- Wellons et al. (2015) Wellons S., et al., 2015, MNRAS, 449, 361
- Whitaker et al. (2012) Whitaker K. E., Kriek M., van Dokkum P. G., Bezanson R., Brammer G., Franx M., Labbé I., 2012, ApJ, 745, 179
- Wild et al. (2009) Wild V., Walcher C. J., Johansson P. H., Tresse L., Charlot S., Pollo A., Le Fèvre O., de Ravel L., 2009, MNRAS, 395, 144
- Wild et al. (2014) Wild V., et al., 2014, MNRAS, 440, 1880
- Wild et al. (2016) Wild V., Almaini O., Dunlop J., Simpson C., Rowlands K., Bowler R., Maltby D., McLure R., 2016, MNRAS, 463, 832
- Yan et al. (2006) Yan R., Newman J. A., Faber S. M., Konidaris N., Koo D., Davis M., 2006, ApJ, 648, 281
- Yano et al. (2016) Yano M., Kriek M., van der Wel A., Whitaker K. E., 2016, ApJ, 817, L21
- Zahid & Geller (2017) Zahid H. J., Geller M. J., 2017, ApJ, 841, 32
- Zolotov et al. (2015) Zolotov A., et al., 2015, MNRAS, 450, 2327
- van der Wel et al. (2012) van der Wel A., et al., 2012, ApJS, 203, 24
Appendix A Outflow velocity measurements
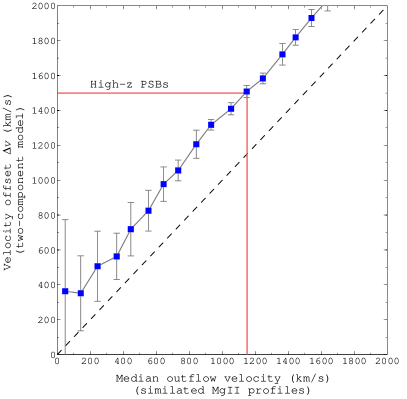
In this Appendix, we provide a simple calibration of the velocity offsets returned by our two-component Mg ii absorption model (i.e. systemic absorption + outflow; see Section 3.2), so we can estimate the typical (i.e. median) outflow velocity for our galaxy populations. To achieve this, we run our fitting procedure on a large number of simulated Mg ii profile stacks, generated with a wide range of typical outflow velocities . To generate our simulated Mg ii profiles, we use the following procedure.
-
1.
We generate Mg ii profiles, each of which is modelled as a Gaussian-convolved doublet, with a fixed intensity ratio of 1.2:1, as observed for massive high- galaxies (Weiner et al., 2009). Each line has an intrinsic width matched to that of our observations (Å). Random noise is then added to these profiles at the required level [ Å; see Section 2.3].
-
2.
We make an assumption on the contribution from both the systemic absorption and the outflowing component to the overall stacked Mg ii profile. In this study, all our stacked spectra have an Mg ii absorption profile that exhibits a dominant systemic component (see Fig. 4), This is the case, even if an outflowing component is detected (e.g. high- PSBs). There are several potential explanations for this observation, e.g. outflows that are not in the line-of-sight and/or stellar Mg ii absorption (see Section 3.2, for further details). Consequently, we require a large fraction of our simulated Mg ii profiles to be centred at the systemic absorption (i.e. non-outflowing) in order to match our observations. We assume that in any stacked Mg ii profile, per cent of the input spectra will have an outflowing Mg ii. For these cases, the relevant is determined from an outflow velocity , which is randomly sampled from a uniform distribution (range –).
-
3.
We then create a median stack of all Mg ii profiles (i.e. both those with systemic and outflowing Mg ii). This simulated stacked Mg ii profile will have an outflowing component with a typical outflow velocity , which is the median() of the input profiles with outflowing Mg ii.
-
4.
We repeat the above procedure for various values of (–), in order to generate simulated Mg ii profiles with a wide range of typical outflow velocities ().
For each simulated Mg ii profile, we use our two-component model (see Section 3.2) in order to estimate the velocity offset of the outflowing component. In Fig. 5, we present a comparison of the median velocity of our simulated Mg ii profiles with the velocity offset returned by our two-component model. This reveals that our two-component model yields outflowing components with a velocity offset that systematically over-estimates the typical (i.e. median) outflow velocity by . For our high- PSBs, our two-component model yields an outflowing component with a velocity offset (see Section 3.2). Therefore, these simulations indicate that, in this case, the true outflow velocity is actually typically . The uncertainty in this estimate has been determined by combining the errors in and those of these simulations, in quadrature.
Appendix B Stellar Mg ii absorption
For PSB and passive galaxies, the dominant contribution to their systemic Mg ii absorption is expected to be stellar in origin. In this work, we have modelled the systemic absorption (ISM + stellar) as a single component comprising a Gaussian-convolved doublet (see Section 3.2). An alternative approach is to use synthetic stellar libraries, to estimate and remove the stellar Mg ii component using full spectral fitting. In this Appendix, we explore this alternative approach and its impact on our results.
To obtain spectral fits covering the Mg ii region ( Å), it is necessary to use synthetic (i.e. theoretical) stellar libraries. We note that these libraries are not as robust as the empirical libraries available in the optical regime (e.g. MILES; Vazdekis et al., 2010), but are nonetheless useful to estimate the UV stellar continuum. One well-established library is UVBLUE (Rodríguez-Merino et al., 2005), a high-resolution () theoretical stellar library of stars, which covers all spectral types and spans a wide range in temperature, metallicity and surface gravity. For our stacked spectra (blue-optimised; Fig. 4), we use the UVBLUE library to perform full spectral fitting via ppxf (Cappellari & Emsellem, 2004; Cappellari, 2017). These fits are performed over a wide wavelength range (– Å) and assume solar metallicity, as expected for the stellar metallicity of massive galaxies at (e.g. Sommariva et al., 2012). In the fitting, we also include an additive polynomial correction to amend the continuum shape for e.g. dust effects, mismatches between the model and data, and spectrophotometric inaccruacies. This is necessary in order to obtain an adequate fit to the continuum on either side of the Mg ii feature. For the fits presented below, this correction is a Legendre polynomial of degree . We note, however, that consistent conclusions are also obtained using a correction with degree (i.e. a linear correction).
For our high- PSBs, we use a full spectral fit to normalise the stacked spectrum with respect to the stellar component, and hence determine the Mg ii profile of the ISM absorption (see Fig. 6). Depending on the nature of the spectral fit used, we then model the ISM component with one or two components, as required (see details below). In the following, we compare two resultant models for the Mg ii profile with that of our original two-component model (see Section 3.2). We define the three different models as follows:
- 1.
-
2.
Model B: a two-component model (stellar + outflowing ISM), with a full spectral fit used to determine the stellar component. To avoid the influence of the outflowing ISM absorption on the fit, the blue-side of the Mg ii profile is masked ( Å). The red-side of the Mg ii profile ( Å) is unmasked, which essentially forces the fit to account for all the systemic absorption with the stellar component. In this case, only a single outflowing component (i.e. Gaussian-convolved doublet) is required to account for the ISM absorption.
-
3.
Model C: a three-component model (stellar + systemic ISM + outflowing ISM). In this case, a full spectral fit is used to determine the stellar component, but in the fitting the entire Mg ii profile is masked ( Å). Since our PSBs are expected to retain a significant residual ISM component (see Section 3.3), we do expect some ISM contribution to the systemic absorption. Therefore, masking the entire Mg ii profile avoids forcing the fit to account for all the systemic absorption with the stellar component. In this case, we require two components to account for the ISM absorption (systemic + outflowing), each of which consists of a Gaussian-convolved doublet.
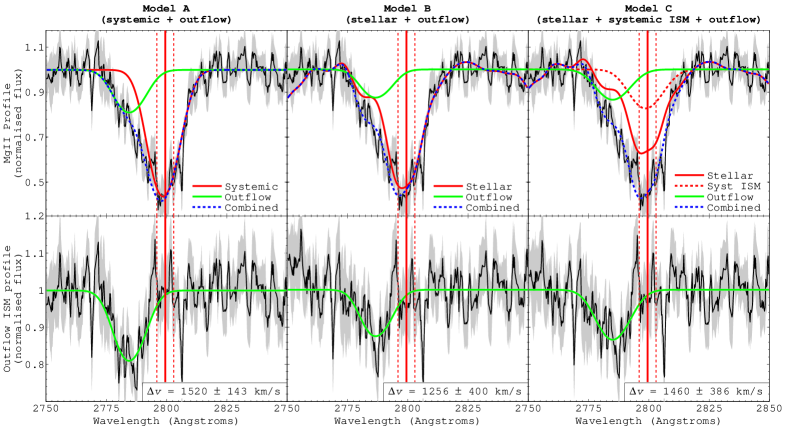
In Fig. 6, we present and compare the results of each model for the stacked Mg ii profile of our high- PSB galaxies. In the full spectral fits to the stellar component (Models B and C), we note that the stellar continuum has revealed a potential weak feature blue-ward of Mg ii, that could potentially account for some of the asymmetric nature. We have thoroughly explored this issue in the UVBLUE stellar models and found that this feature is only important in the atmospheres of F-stars, potentially due to a weak molecular absorption line that becomes significant at those effective temperatures ( K). Similar results are also found using an alternative synthetic stellar library provided by Coelho (2014). Nonetheless, despite this issue, we find that for both models explored (Models B and C) the Mg ii profile still presents a significant excess of blue-shifted absorption with respect to the stellar component. Furthermore, in comparison to our original two-component model (Model A), we find that i) although weakened, the significance of an outflowing ISM component remains (as determined by an F-test); and ii) consistent velocity offsets for the outflow are obtained ().
With respect to our stellar continuum fits, we note that the synthetic stellar libraries used are based on theoretical models that are known to suffer from various issues. For example, it is known that i) various regions of the UV spectrum are poorly reproduced; and ii) the prominent metallic lines in F/G stars (including Mg ii), are always stronger in the synthetic spectra than in observed stars (see Rodríguez-Merino et al., 2005, for further details). This is also true to a lesser extent for A-stars (see fig. 10 from Rodríguez-Merino et al., 2005). We also note that in our models, the strength of the stellar Mg ii absorption differs depending on the nature of the Mg ii mask used in the fit. This implies that the Mg ii feature is essentially unconstrained in our fits from other features in the blue-optical spectrum (– Å). Due to these issues, it is likely that the unknown weak feature on the blue-side of Mg ii is also unconstrained and therefore uncertain in nature. These issues require further exploration in order to ascertain the true importance of this feature in the stellar models. Nonetheless, even in the case where the entire systemic absorption is accounted for by the stellar component (Model B), an outflowing ISM component is still required to account for the stacked Mg ii profile. Therefore, we conclude that our detection of high-velocity outflows in high- PSBs is robust to the nature of the stellar Mg ii component.