Inter-Plasmoid Compton Scattering and the Compton Dominance of BL Lacs
Abstract
Blazar emission models based on magnetic reconnection succeed in reproducing many observed spectral and temporal features, including the short-duration luminous flaring events. Plasmoids, a self-consistent by-product of the tearing instability in the reconnection layer, can be the main source of blazar emission. Kinetic simulations of relativistic reconnection have demonstrated that plasmoids are characterized by rough energy equipartition between their radiating particles and magnetic fields. This is the main reason behind the apparent shortcoming of plasmoid-dominated emission models to explain the observed Compton ratios of BL Lac objects. Here, we demonstrate that the radiative interactions among plasmoids, which have been neglected so far, can assist in alleviating this contradiction. We show that photons emitted by large, slow-moving plasmoids can be a potentially important source of soft photons to be then up-scattered, via inverse Compton, by small fast-moving, neighboring plasmoids. This inter-plasmoid Compton scattering process can naturally occur throughout the reconnection layer, imprinting itself as an increase in the observed Compton ratios from those short and luminous plasmoid-powered flares within BL Lac sources, while maintaining energy equipartition between radiating particles and magnetic fields.
keywords:
magnetic reconnection — galaxies: jets — radiation mechanisms: non-thermal1 Introduction
Blazars constitute a small subclass of active galactic nuclei (AGN) in which their relativistic jets are pointed towards our line of sight (Blandford & Rees, 1978). They are well-known for the double-humped appearance of their spectral energy distribution (SED; Urry & Padovani, 1995), their multi-timescale (i.e. from minutes to months) and multi-wavelength variability (e.g. Maraschi et al., 1999; Fossati et al., 2008; Albert et al., 2007; Aharonian et al., 2007; Ackermann et al., 2015; Ahnen et al., 2016, 2017). BL Lac sources, which are traditionally distinguished from other AGN subclasses by their weak or even absent optical emission lines, in particular, are observed to have Compton ratios (i.e. luminosity ratio of the high-to-low energy components, hereafter denoted as ) in the range of (Ghisellini et al., 2010; Finke, 2013; Nalewajko & Gupta, 2017; Padovani et al., 2017).
Spherical blobs of plasma containing magnetic fields and relativistic non-thermal particles have been invoked to explain the spectral and temporal features observed from many blazars in flaring and non-flaring states (Dermer et al., 1992; Sikora et al., 1994; Mastichiadis & Kirk, 1995; Bloom & Marscher, 1996; Chiaberge & Ghisellini, 1999; Celotti & Ghisellini, 2008; Ghisellini et al., 2010). This modeling offers a probe of the physical conditions in the emitting regions and, in particular, of the relative energy densities of radiating particles and magnetic fields. For one-zone emission models (i.e. in which only a single region is responsible for the production of the observed multi-frequency emission) of BL Lac sources, studies have shown that the energy density of the electrons in the blazar zone typically exceeds that of the magnetic field by a factor of (Tavecchio et al., 2010; Tavecchio & Ghisellini, 2016). To combat this discrepancy, anisotropies in the relativistic non-thermal particle distribution within the emitting regions have also been invoked (Sobacchi & Lyubarsky, 2019; Tavecchio & Sobacchi, 2019).
This apparent dominance of particles over magnetic fields is at odds with the jet composition at its base. Relativistic jets in AGN are believed to be launched as Poynting-flux dominated flows (Blandford & Znajek, 1977; Tchekhovskoy et al., 2009, 2011) with magnetization111Plasma magnetization is the ratio of magnetic to particle energy density: for a cold pre-reconnection plasma, , where and are the magnetic field and particle mass density. . The presence of emitting regions within the magnetically dominated relativistic blazar jet has since motivated numerical and analytical studies of magnetic reconnection (e.g. Spruit et al., 2001; Giannios & Spruit, 2006; Giannios et al., 2009; Nalewajko et al., 2011, 2018), a process which imparts a fraction of the jet’s magnetic energy to energetic particles. In the relativistic regime of reconnection (i.e. ), most applicable to blazar jets, quasi-spherical magnetized plasma structures containing magnetic fields and non-thermal particles – the so-called plasmoids – naturally form and move relativistically within the reconnection layer (e.g. Uzdensky et al., 2010; Sironi & Spitkovsky, 2014; Guo et al., 2014, 2015; Sironi et al., 2016; Werner et al., 2016, 2018). The reconnection-generated plasmoids are promising physical candidates for the blobs invoked to power the blazar emission (Giannios, 2013; Petropoulou et al., 2016; Christie et al., 2019, hereafter, the latter two will be denoted as PGS16 and C19, respectively). In the absence of a strong non-reconnecting magnetic field component (the so-called “guide field”), relativistic particles and magnetic fields within plasmoids are in rough energy equipartition (e.g. Sironi et al., 2015; Werner et al., 2018; Petropoulou et al., 2019), even though the magnetic field largely dominates (i.e. ) in the unreconnected plasma.
The dynamics and properties of plasmoids formed during the reconnection process can be studied from first principles with particle-in-cell (PIC) simulations. We have recently incorporated the results of two-dimensional (2D) PIC simulations of reconnection into radiative models of blazar emission (PGS16, C19). One of the major findings of these studies is that numerous plasmoids forming during a single reconnection event can naturally produce multi-wavelength and multi-timescale variability, including extreme flares of short durations (min timescales, see e.g. Aharonian et al., 2007). In addition, the cumulative emission of several plasmoids, at any given time, exhibits the usual two-hump structure observed in blazar SEDs.
Despite the success in reproducing the global features of blazar emission, plasmoid-based emission models for BL Lac sources result in , namely they have difficulty in reproducing the observed Compton ratios (see Figs. 10 and 12 in PGS16, Figs. 6 and 8 in C19, and Morris et al. (2019)). This apparent shortcoming of the models comes mainly from the combination of two factors: (i) the adoption of equipartition between relativistic particles and magnetic fields within plasmoids, as informed by PIC simulations of reconnection; and (ii) the assumption that no photon fields are available for inverse Compton up-scattering other than the synchrotron photons produced by the plasmoid itself (photon sources external to the jet are negligible in BL Lac objects). If, however, other photon sources were to be available for up-scattering, then it would be possible to obtain larger Compton ratios without invoking deviations from equipartition.
In this work, we study for the first time the radiative interactions among plasmoids within the same reconnection layer. In particular, we demonstrate that most small and mid-sized plasmoids trail behind and eventually coalesce with a larger slow-moving plasmoid. Their relative motions can be relativistic, thus making the Doppler-boosted synchrotron radiation of large plasmoids a potential source of soft photons for Compton scattering by the pairs in smaller trailing plasmoids (see also discussion in Appendix C of PGS16). To describe this process, we coin the term “inter-plasmoid Compton scattering” (IPCS). Using results from simulations of relativistic reconnection and radiative transfer calculations, we demonstrate that the photons produced by a large plasmoid can increase the observed Compton dominance and high-energy emission from neighboring plasmoids by a factor of few. Our model predicts larger Compton ratios in several flares from BL-Lac like sources, which fall comfortably within the observed range, without requiring particle-dominated emission regions.
2 Reconnection-Driven Plasmoids
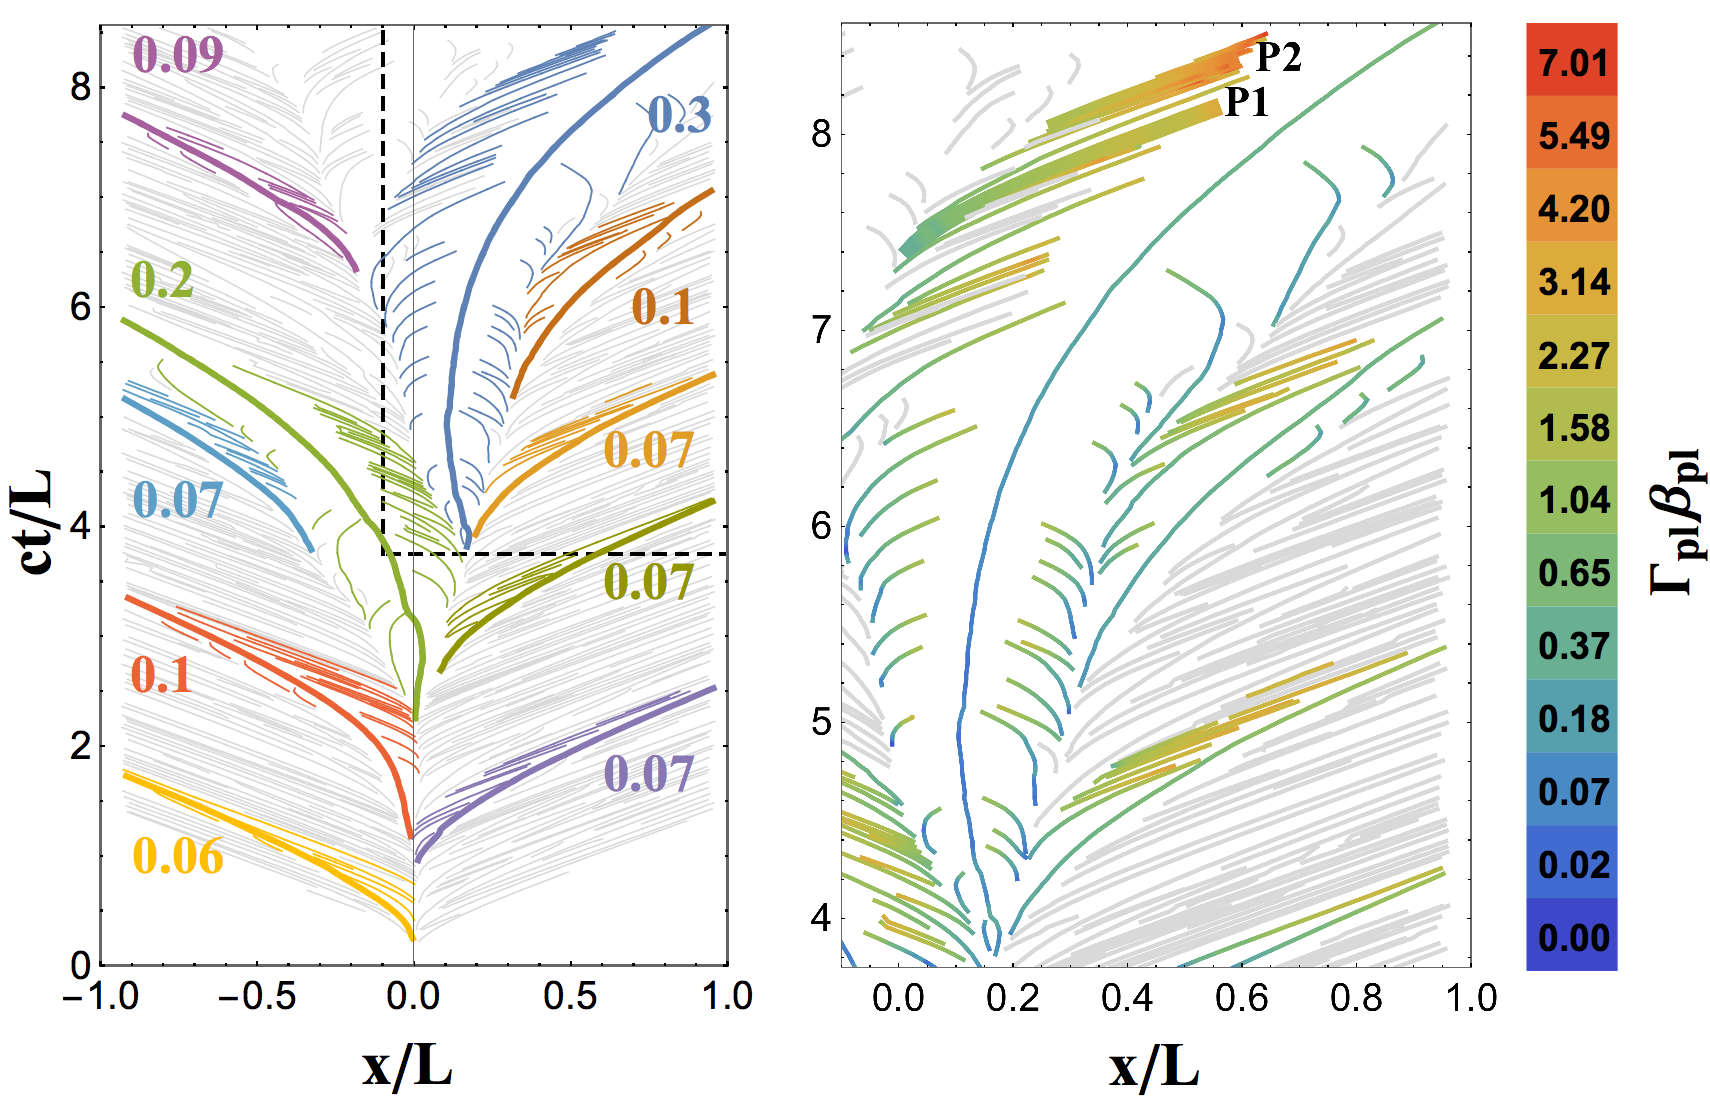
A plasmoid chain is composed of a large number of plasmoids with self-similar properties. A large majority of these plasmoids have sizes of , where is the plasmoid’s transverse size (perpendicular to the reconnection layer and their direction of motion) and is the half-length of the reconnection layer, while only a few plasmoids obtain large sizes of (Uzdensky et al., 2010). Large plasmoids move slowly (with non-relativistic speeds) in the reconnection layer, grow from the coalescence with smaller plasmoids and direct accretion from the current sheet, and are long-lived with lifetimes equal to several light-crossing times of the layer (i.e. several ), as shown in Fig. 1 (thick lines). In this figure, and in what follows, we adopt the results from a 2D PIC simulation of reconnection in pair plasmas with (Sironi et al., 2016).
2.1 Relative Motion of Plasmoids
Small plasmoids accelerate in the layer, reaching final speeds up to or exceeding222Small plasmoids which form in the vicinity of a large plasmoid can obtain dimensionless bulk four-velocities since the local Alfvén speed is larger (Petropoulou et al., 2018). the Alfvén velocity . On the contrary, larger plasmoids move sub-relativistically with Lorentz factors . As a result, the relative motion of smaller plasmoids trailing a larger plasmoid can be relativistic with dimensionless velocity (i.e. normalized to the speed of light) and Lorentz factor , where the subscripts and refer to quantities of the small and large plasmoid, respectively. This is illustrated in the right panel of Fig. 1, where the dimensionless four-velocity for each plasmoid in which IPCS is relevant is displayed in color.
2.2 Photon Energy Density of Plasmoids
In what follows, we demonstrate that large plasmoids can be an additional source of soft photons to be up-scattered by smaller, fast, neighboring plasmoids.
Each plasmoid emits isotropically in its co-moving frame with luminosity and photon energy density , where the photon escape timescale is and is the plasmoid’s co-moving volume333We assume that the plasmoid’s shape in three dimensions is an ellipsoid with the third dimension being (C19). However, all radiative calculations performed in Sec. 3 assume spherical geometry., giving .
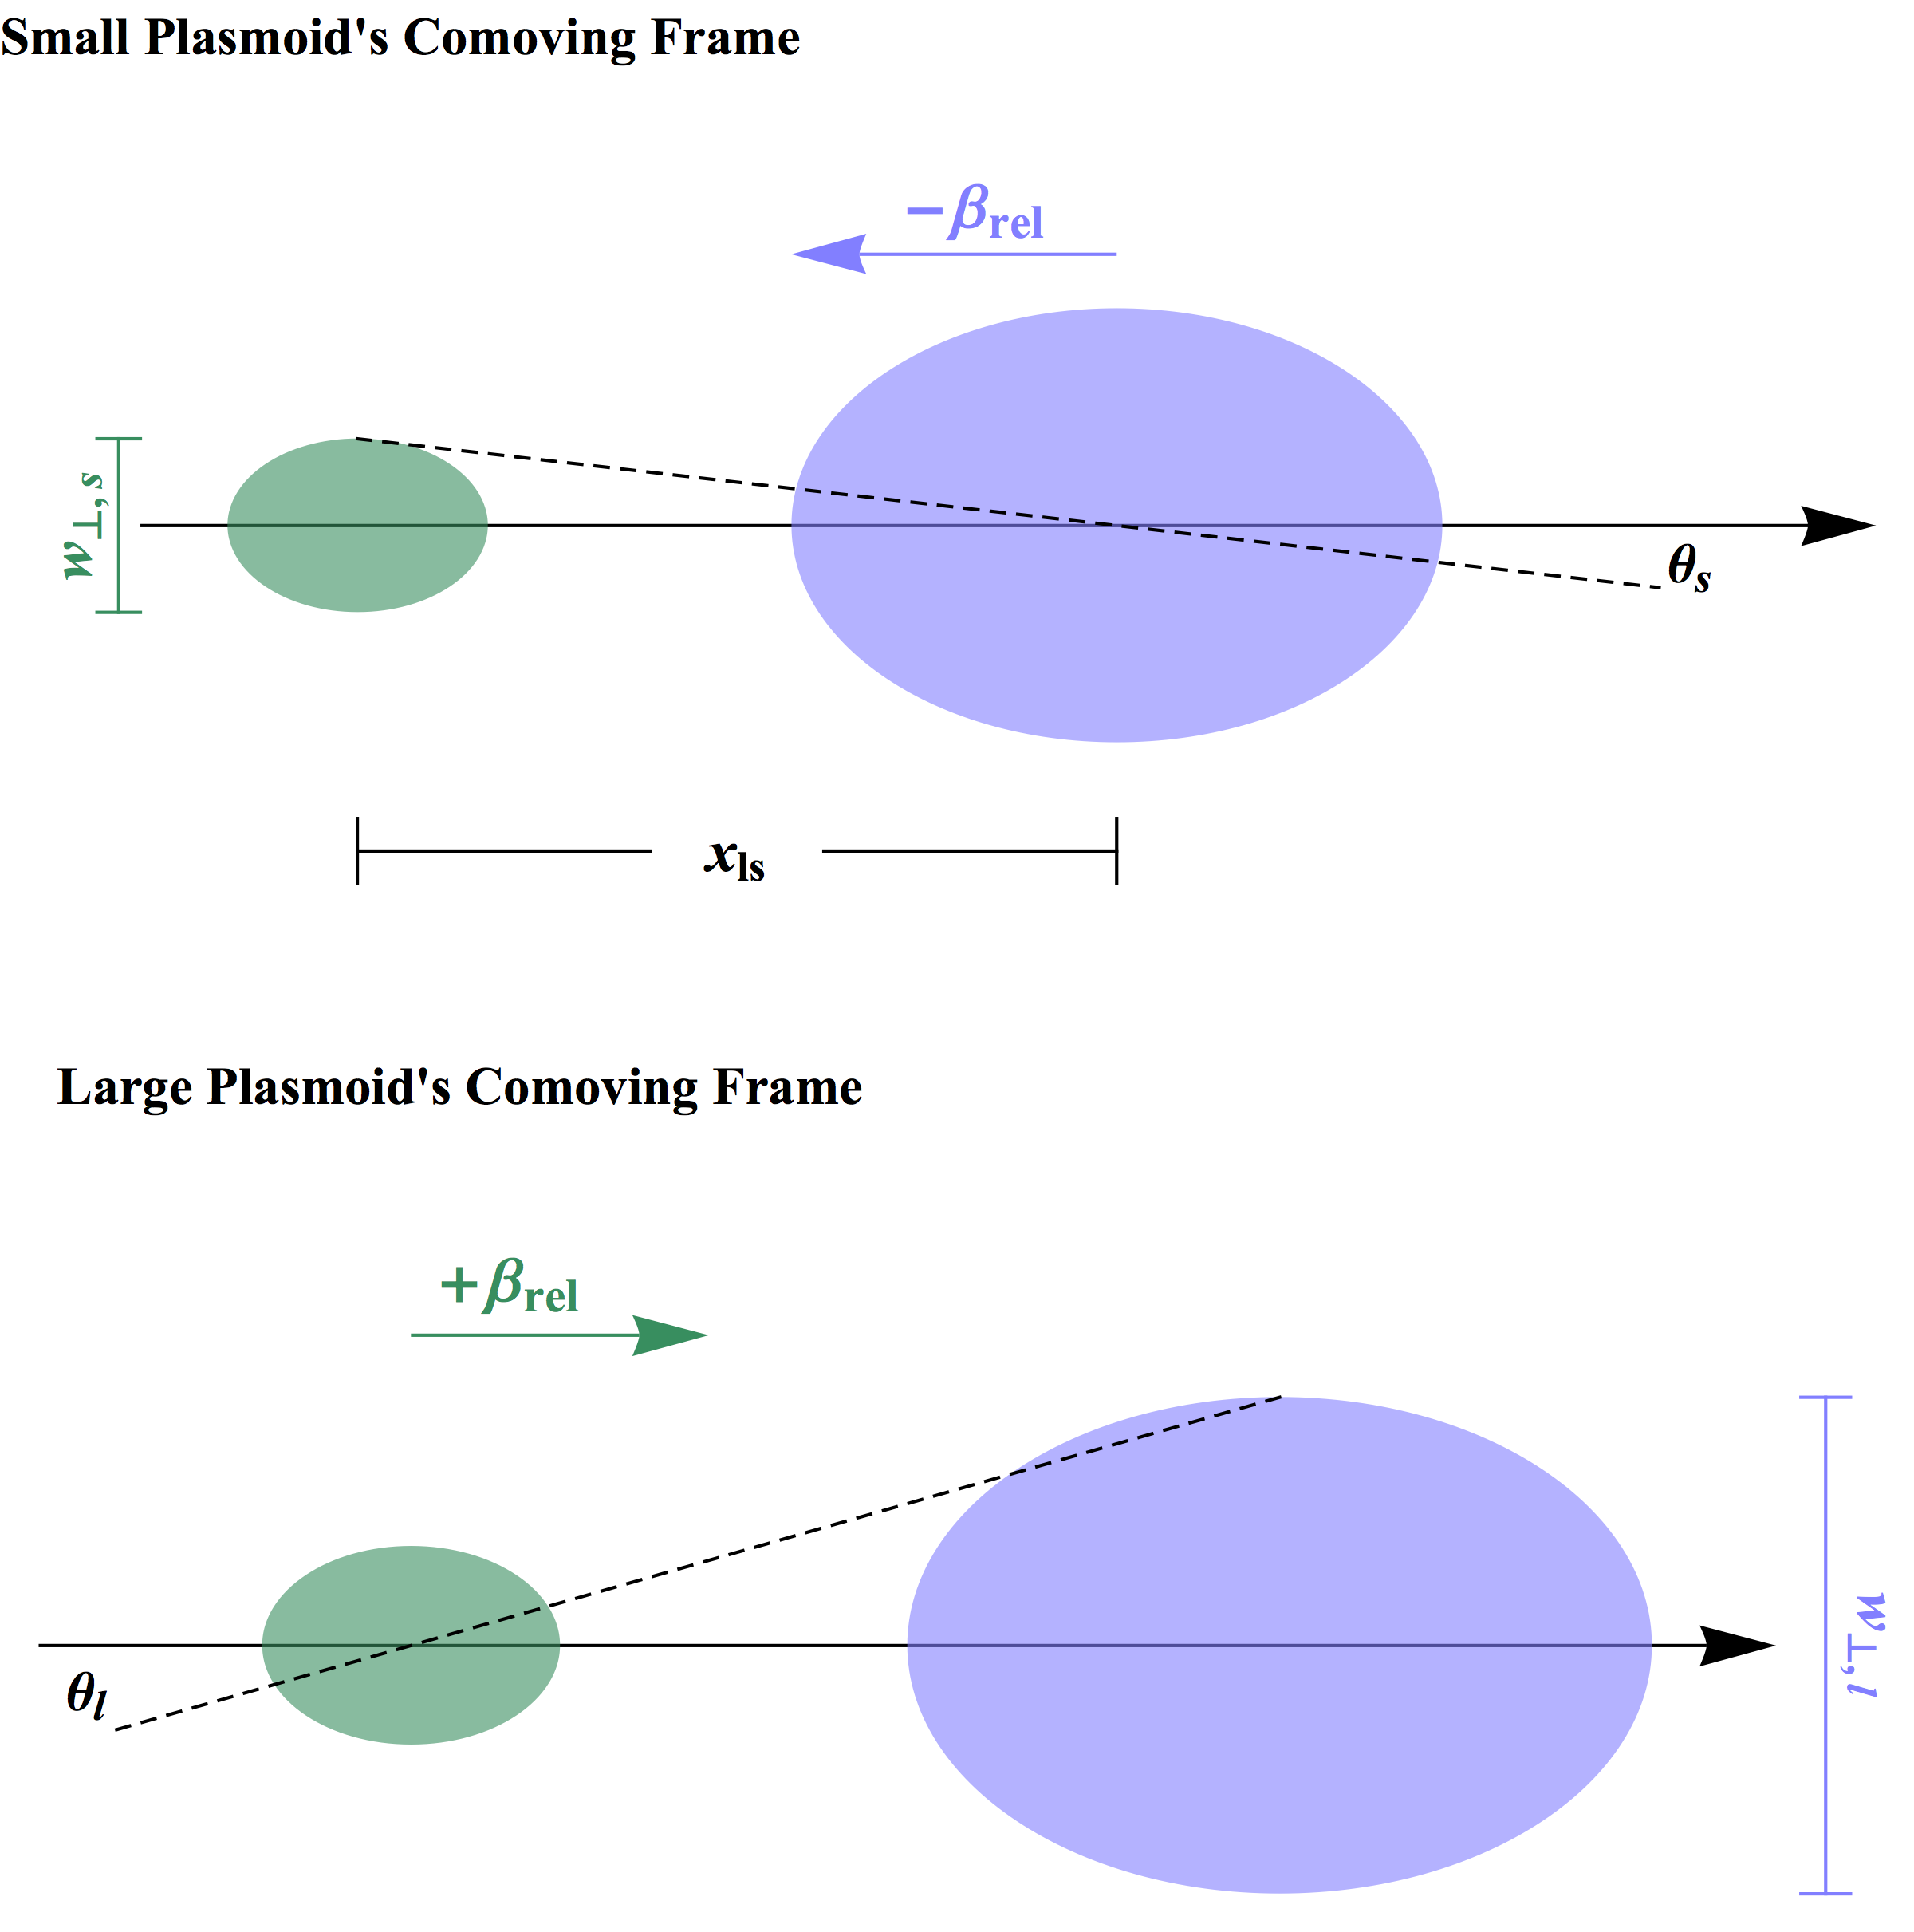
Here, we compute the contribution of a plasmoid’s photon field in the frame of its neighboring plasmoid. More specifically, we i) determine the photon energy density of the small plasmoid as measured in the co-moving frame of the larger one and ii) compute the energy density of the larger one in the co-moving frame of the small one. In what follows, we denote all quantities measured in the co-moving frame of the small (large) plasmoid with a single (double) prime. We also adopt the subscripts and to denote quantities of the small and large plasmoid, respectively. A sketch of two neighboring plasmoids, in two reference frames used in the calculations that follow, is displayed in Fig. 2.
To compute the energy density of the smaller plasmoid () as measured in the co-moving frame of the larger one (), we begin with the invariance of the quantity (Rybicki & Lightman, 1986; Dermer & Schlickeiser, 1994):
where we used the transformation of the angle and energy, namely and . Here, , where is the angle between the direction of plasmoid motion and that of photons emitted by the small plasmoid (see top panel in Fig. 2), , and is the separation distance of the plasmoid centers. We chose to perform the integration in the small plasmoid’s rest frame where the photon field is assumed to be isotropic, i.e. (Dermer & Schlickeiser, 1994). An additional factor of , which cancels the factor from the isotropy of the radiation field, comes from the integration over angle (i.e. from to ), which considers the radiation from both sides of the plasmoid (see Fig. 2 for reference). The integral in eqn. 2.2 results in , where
| (2) |
In the limit of no relative motion (i.e. and ) and of large separation distance (i.e. ), the expression above simplifies to the expression for the energy density of a point source at distance , namely . Similarly, the energy density of the large plasmoid () as measured in the co-moving frame of the smaller one () can be determined as
where (see bottom panel in Fig. 2). The integral in eqn. 2.2 then leads to , where
| (4) |
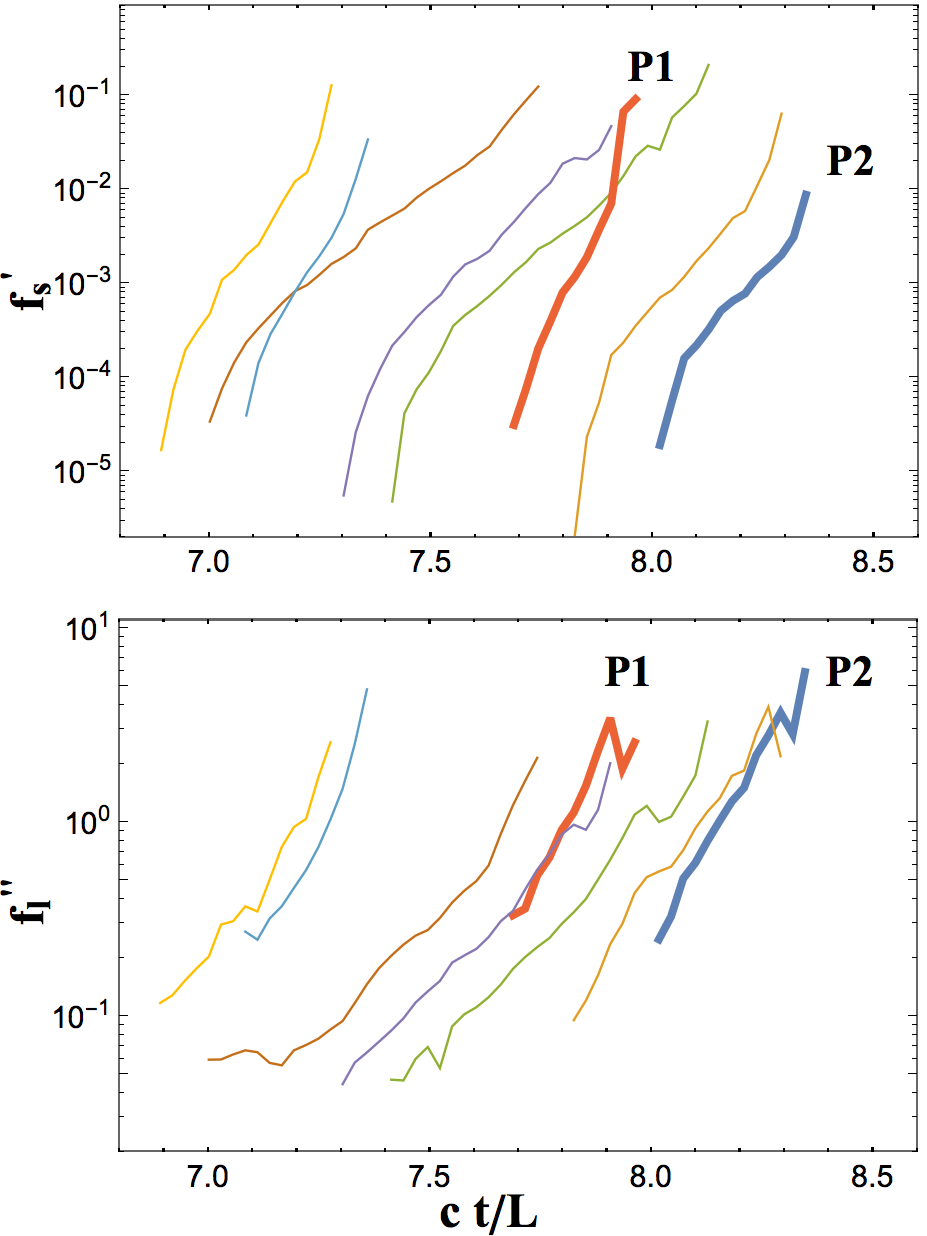
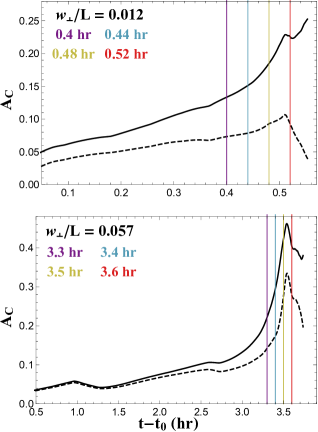
The two geometrical quantities and are displayed in Fig. 3 for a small subset of plasmoids within the reconnection layer (see right panel of Fig. 1 for reference). Both quantities show a similar temporal trend in which they gradually increase with time. This stems from the fact that , and thereby , continually increases with time until the small plasmoid merges with the large plasmoid lying ahead of it. The large difference in the values of and , spanning several orders of magnitude, originates from the large difference between the two plasmoid sizes, with respect to the distance between their centers . Here, the large plasmoid has size while the small plasmoids typically have . Moreover, the distance between the plasmoid centers is (see right panel of Fig. 1). This leads to for the majority of the small plasmoid’s lifetime, whereas quickly deviates from unity as grows larger than . Only when the two plasmoids sizes become similar, and will become roughly equal.
For any small plasmoid that trails a larger one, there is a competition between the synchrotron photons produced by the electrons in that plasmoid and the non-thermal radiation from neighboring larger plasmoids for the dominant source of seed photons for Compton scattering. Here, and in what follows, we consider only the synchrotron radiation of the large plasmoid as an additional source of seed photons for Compton scattering by particles residing in neighboring plasmoids. Higher energy photons produced in the large plasmoid through synchrotron self-Compton (SSC) would be up-scattered by particles in nearby plasmoids deep in the Klein-Nishina regime, where the Compton emissivity is suppressed.
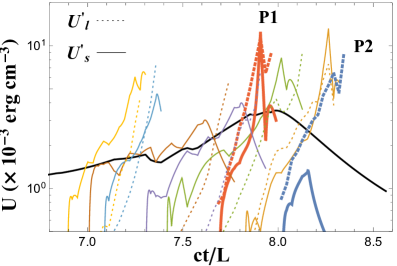
Fig. 4 displays and (denoted as the solid and dashed colored lines, respectively) for a subset of plasmoids (see right panel of Fig. 1 and Fig. 3 for reference). For one plasmoid in Fig. 4 (e.g. thick blue curves), we find that for the entirety of the small plasmoid’s lifetime. For this plasmoid, the IPCS process becomes relevant, as the large plasmoid provides an important source of soft photons to be upscattered within the smaller plasmoid. For other plasmoids displayed in Fig. 4 (e.g. thin yellow and green curves), , since for the majority of a plasmoid’s lifetime (see bottom panel of Fig. 3). In these cases, IPCS can be neglected and these small plasmoids may well be considered as isolated objects. Lastly, there are several plasmoids (e.g. thin orange curves and thick red curves in Fig. 4) with at early times of their lifetime, but with at later times. This transition in the importance of the IPCS process will directly imprint itself on the radiative signatures of small plasmoids (for P1, see also Fig. 5).
3 Results
As discussed in the previous section, synchrotron photons from a large plasmoid can be an additional source of particle cooling for smaller trailing plasmoids. This can be imprinted on the observed spectra of smaller plasmoids. To study the effects of the time-dependent photon fields from large plasmoids on the particle cooling and emission from smaller plasmoids, we perform numerical calculations using the radiative code described in C19, which includes all the relevant physical processes.
3.1 Inter-Plasmoid Compton Scattering
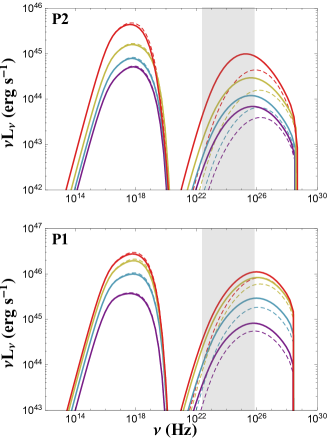
We compute the emission from two representative plasmoids that form in the layer and move behind a larger plasmoid (see lines marked with an asterisk in the right panel of Fig. 1 and with thick lines in Figs. 3 and 4). We use the same parameters as in the BL10 model presented in C19 (for model parameters, see fourth row in Table 1 therein), except for the magnetic field strength within plasmoids, which is now G. Our results on the broadband photon emission from each plasmoid are presented in Fig. 5, with the left column displaying the temporal evolution of the SEDs and the right column displaying the Compton ratios444Here, is determined as the ratio of the peak luminosities of the high-energy to low-energy components (i.e. Compton and synchrotron, respectively) in a plasmoid’s SED. . Solid and dashed lines denote the results with and without IPCS, respectively. A few things that are worth commenting on Fig. 5 follow:
-
1.
The inclusion of the photons from the large plasmoid results in a higher Compton dominance (see right panel). For the two representative plasmoids, we find that within their lifetimes. The largest value during the lifetime of a plasmoid is obtained around the time when its luminosity peaks, namely at the peak time of a flare. This time is also associated with roughly the time at which a plasmoid’s Lorentz factor reaches its peak before it merges (see also Fig. 3). Without IPCS, many small plasmoids, such as the one shown in the top row of Fig. 5, can only reach low peak Compton ratios, e.g., (see also PGS16 and C19). Such low values are the combined result of the assumed equipartition between particles and magnetic fields (as dictated by PIC simulations of reconnection) and of the slow cooling555This refers to the regime where the cooling timescale of electrons (with typical energy) is longer than the dynamical timescale of the plasmoid. of electrons in, usually small, plasmoids666Particles within small plasmoids typically reside in the slow-cooling regime, resulting in a low (i.e. ) peak Compton ratios (C19).. The IPCS process is important for plasmoids in which (see e.g., P2 in Fig. 4). Due to the additional source of photons provided by the large neighboring plasmoid, the Compton ratio of the smaller plasmoid can increase by a factor of , as shown in the top panel of Fig. 5. However, IPCS can be less important for other plasmoids in the layer, as exemplified in the bottom row of Fig. 5. In this case, the presence of the larger plasmoid does not affect the high-energy emission of the trailing smaller plasmoid until late times within its lifetime (i.e., hr), when (see see times for the thick red lines in Fig. 4). Inclusion of the IPCS process results in an increase of the Compton ratio by a factor of at and after the peak time of the flare (see lower right panel in Fig. 5).
-
2.
The inclusion of the synchrotron radiation from the large plasmoid as a seed for Compton scattering leads not only to an effective increase of the high-energy flux by a factor of (see Fermi-LAT band, denoted as the gray band in Fig. 5), but also to a broadening of the high-energy spectrum (see left column of Fig. 5). The former is due to an increase in the available photon energy density while the latter is caused by the fact that the larger plasmoid, whose photons serve as seeds for IPCS, has a broader synchrotron spectrum than the smaller plasmoids (i.e. the large plasmoid has a lower minimum Lorentz factor in its particle distribution, see eqn. A4 in C19).
3.2 Application to BL Lac Sources
As discussed in Sec. 3.1, the IPCS process can naturally increase the Compton ratio and luminosity of the high-energy component within the SEDs of fast moving plasmoids. An application of IPCS that is of particular importance is that of emission models of BL Lac sources. Typical BL Lacs have Compton ratios between (see distributions provided in Finke, 2013; Nalewajko & Gupta, 2017). When adopting single-zone emission models under the assumption of equipartition, as is expected for reconnection driven blazar flares, BL Lac-like models are found to have Compton ratios of . More recently, the BL Lac plasmoid-emission models of PGS16, C19, and Morris et al. (2019), showed that the average is , which falls near the lower bound of what is typically observed.
A first step solution in alleviating this contradiction is including the IPCS process within the radiative calculations of small fast-moving plasmoids. By including this naturally occurring process, there can be a general increase in the Compton ratios of many plasmoids to values which fall within the general continuum of observations. However, some plasmoids (e.g. yellow curve in Fig. 4) which trail behind, and eventually merge with, a larger one do not show any significant changes within their emission when including the IPCS process. For these small plasmoids, their own synchrotron phootn energy density is greater than that of the large plasmoid’s photon energy density. As such, their Compton ratios will remain unaffected by IPCS and these plasmoids can largely be considered as isolated objects within the relativistic blazar jet, an assumption taken in all previous plasmoid emission models. As all plasmoids in Fig. 4 will produce short duration, luminous flares, one could expect variations in the observed Compton ratios between different flaring states. This is a common feature observed in many blazar sources when transitioning between different flaring states (see Acciari et al., 2011, for variations in Mrk 421). This can be a combination of the radiative efficiency of particle cooling via synchrotron emission and the relevance of IPCS through the plasmoid’s relative motion with respect to large plasmoids.
4 Discussion and conclusions
Equipartition between magnetic fields and the radiating particles within plasmoids is a fundamental result of plasmoid-dominated relativistic reconnection. When invoking reconnection, and with it equipartition, very small Compton ratios are found for BL Lac sources (i.e. ), in apparent contradiction with observations. We have shown that the non-thermal emission from a large plasmoid can serve as an additional seed photon field for Compton scattering by particles residing in its neighboring, smaller plasmoids which eventually merge with it. This inter-plasmoid Compton scattering (IPCS) process can lead to an increase of the high-energy flux emitted by smaller plasmoids and to Compton ratios as is typically observed in BL Lac sources (see Fig. 5 for two representative plasmoids).
Here, we have mostly focused on a small subset of plasmoids trailing behind the largest plasmoid formed in the layer. However, within a single reconnection event, there can be numerous sets of plasmoids (see left panel of Fig. 1), each consisting of a single large plasmoid with smaller plasmoids trailing and eventually merging with it. Thus, the IPCS process may be relevant for a large fraction of the small plasmoids formed in the layer. To obtain better statistics of IPCS importance within the layer, we can compare for each of these subsets the ratios and (see Sec. 2.2 for derivation). If particles within plasmoids are cooling efficiently through synchrotron radiation, then , where is the energy density of injected relativistic electrons (PGS16, see also eqn. 6 in C19). The latter is found to be almost time-independent and approximately constant among plasmoids, regardless of their sizes (see also Fig. 5 of Sironi et al., 2016). Thus, the photon energy densities of the small and large plasmoids are similar in their respective co-moving frames (, see solid lines in Fig. 4 for reference) and the comparison of the ratios and is mapped to a comparison of the parameters and . For those plasmoids which have sufficiently large (i.e. values greater than a factor of a few), one could expect that IPCS is important. For example, of the eight small plasmoids presented in Figs. 3 and 4, half of them have large values of , and therefore at some point within their lifetimes. By applying this same argument to plasmoids of those shown in the left panel of Fig. 1, we find that roughly half have sufficiently large values of (i.e. ) and therefore . This signifies that for half of these small plasmoids, the IPCS process is an important mechanism for the high-energy emission, increasing the peak Compton ratios by a factor of , such that their values fall within the observed distribution.
Here, we discussed the role of IPCS within plasmoid emission models of BL Lac sources. Although plasmoids are also invoked to explain flaring episodes from other blazar subclasses, such as flat spectrum radio quasars (FSRQs, see C19 for a more detailed application), IPCS can be considered as a negligible process for small plasmoids. Emission models of FSRQs often adopt photon sources external to the jet (e.g. broad line region) to explain the observed large Compton ratios (typically, ). However, the photon energy densities of these external fields are much greater that those produced even by the largest plasmoids in the layer. Thus, plasmoids in FSRQ emission models can be well considered as isolated objects within the jet and the radiative interactions between plasmoids can be ignored.
We conclude by stating a few simplifying assumptions that entered our calculations. First, we neglect the fact that the photons from the large plasmoid are expected to induce Compton drag on the smaller plasmoids. As shown in Beloborodov (2017), this effect is of secondary importance with respect to the cooling of electrons within small plasmoids. In other words, the removal of the plasmoid internal energy due to Compton cooling is expected to happen faster than the removal of its bulk energy due to Compton dragging. Second, we have neglected effects related to the inhomogeneous structure of plasmoids in regard to the plasmoid properties (e.g. magnetic field and particle density) as well as to the properties of the illuminating photon field (i.e. its intensity and spectrum do not depend on the location within the plasmoid). We also consider that the plasmoid is moving as a rigid body even during mergers, which is likely a rough approximation. Lastly, we neglect the finite light propagation time between the large, illuminating plasmoid and the smaller ones. This correction is of minor importance since the intrinsic properties of the large plasmoid (including its overall emission spectrum and intensity) do not change much as the smaller plasmoids approach it.
When modeling blazar emission, the standard assumption for explaining the high-energy component of the spectrum is to invoke Compton processes seeded by synchrotron photons in the same emission region (SSC) or by photons external to the jet (external Compton). In the magnetic reconnection scenario for blazar emission, we have demonstrated the potential of another process that can naturally occur throughout the reconnection layer, namely the inter-plasmoid Compton scattering (IPCS). This process relies on the synchrotron photons produced by large plasmoids serving as seed photons for Compton scattering by particles in neighboring, smaller plasmoids. The inclusion of this effect can naturally lead to an increase in the Compton ratios during flares from BL-Lac like sources without requiring particle-dominated emission regions.
Acknowledgements
The authors would like to thank the anonymous referee for their constructive report. IC, MP, and DG acknowledge support from the Fermi Guest Investigation grant 80NSSC18K1745. MP also acknowledges support from the Lyman Jr. Spitzer Postdoctoral Fellowship. LS acknowledges support from DoE DE-SC0016542, NASA ATP NNX-17AG21G, and NSF ACI-1657507. DG acknowledges support from the NASA ATP NNX17AG21G, the NSF AST-1910451 and the NSF AST-1816136 grants.
References
- Acciari et al. (2011) Acciari V. A., et al., 2011, ApJ, 738, 25
- Ackermann et al. (2015) Ackermann M., et al., 2015, ApJ, 810, 14
- Aharonian et al. (2007) Aharonian F., et al., 2007, ApJ, 664, L71
- Ahnen et al. (2016) Ahnen M. L., et al., 2016, A&A, 593, A91
- Ahnen et al. (2017) Ahnen M. L., et al., 2017, A&A, 603, A31
- Albert et al. (2007) Albert J., et al., 2007, ApJ, 669, 862
- Beloborodov (2017) Beloborodov A. M., 2017, ApJ, 850, 141
- Blandford & Rees (1978) Blandford R. D., Rees M. J., 1978, Phys. Scr., 17, 265
- Blandford & Znajek (1977) Blandford R. D., Znajek R. L., 1977, MNRAS, 179, 433
- Bloom & Marscher (1996) Bloom S. D., Marscher A. P., 1996, ApJ, 461, 657
- Celotti & Ghisellini (2008) Celotti A., Ghisellini G., 2008, MNRAS, 385, 283
- Chiaberge & Ghisellini (1999) Chiaberge M., Ghisellini G., 1999, MNRAS, 306, 551
- Christie et al. (2019) Christie I. M., Petropoulou M., Sironi L., Giannios D., 2019, MNRAS, 482, 65
- Dermer & Schlickeiser (1994) Dermer C. D., Schlickeiser R., 1994, ApJS, 90, 945
- Dermer et al. (1992) Dermer C. D., Schlickeiser R., Mastichiadis A., 1992, A&A, 256, L27
- Finke (2013) Finke J. D., 2013, ApJ, 763, 134
- Fossati et al. (2008) Fossati G., et al., 2008, ApJ, 677, 906
- Ghisellini et al. (2010) Ghisellini G., Tavecchio F., Foschini L., Ghirlanda G., Maraschi L., Celotti A., 2010, MNRAS, 402, 497
- Giannios (2013) Giannios D., 2013, MNRAS, 431, 355
- Giannios & Spruit (2006) Giannios D., Spruit H. C., 2006, A&A, 450, 887
- Giannios et al. (2009) Giannios D., Uzdensky D. A., Begelman M. C., 2009, MNRAS, 395, L29
- Guo et al. (2014) Guo F., Li H., Daughton W., Liu Y.-H., 2014, Physical Review Letters, 113, 155005
- Guo et al. (2015) Guo F., Liu Y.-H., Daughton W., Li H., 2015, ApJ, 806, 167
- Maraschi et al. (1999) Maraschi L., et al., 1999, Astroparticle Physics, 11, 189
- Mastichiadis & Kirk (1995) Mastichiadis A., Kirk J. G., 1995, A&A, 295, 613
- Morris et al. (2019) Morris P. J., Potter W. J., Cotter G., 2019, MNRAS, 486, 1548
- Nalewajko & Gupta (2017) Nalewajko K., Gupta M., 2017, A&A, 606, A44
- Nalewajko et al. (2011) Nalewajko K., Giannios D., Begelman M. C., Uzdensky D. A., Sikora M., 2011, MNRAS, 413, 333
- Nalewajko et al. (2018) Nalewajko K., Yuan Y., Chruślińska M., 2018, Journal of Plasma Physics, 84, 755840301
- Padovani et al. (2017) Padovani P., et al., 2017, A&ARv, 25, 2
- Petropoulou et al. (2016) Petropoulou M., Giannios D., Sironi L., 2016, MNRAS, 462, 3325
- Petropoulou et al. (2018) Petropoulou M., Christie I. M., Sironi L., Giannios D., 2018, MNRAS, 475, 3797
- Petropoulou et al. (2019) Petropoulou M., Sironi L., Spitkovsky A., Giannios D., 2019, arXiv e-prints, p. arXiv:1906.03297
- Rybicki & Lightman (1986) Rybicki G. B., Lightman A. P., 1986, Radiative Processes in Astrophysics
- Sikora et al. (1994) Sikora M., Begelman M. C., Rees M. J., 1994, ApJ, 421, 153
- Sironi & Spitkovsky (2014) Sironi L., Spitkovsky A., 2014, ApJ, 783, L21
- Sironi et al. (2015) Sironi L., Petropoulou M., Giannios D., 2015, MNRAS, 450, 183
- Sironi et al. (2016) Sironi L., Giannios D., Petropoulou M., 2016, MNRAS, 462, 48
- Sobacchi & Lyubarsky (2019) Sobacchi E., Lyubarsky Y. E., 2019, MNRAS, 484, 1192
- Spruit et al. (2001) Spruit H. C., Daigne F., Drenkhahn G., 2001, A&A, 369, 694
- Tavecchio & Ghisellini (2016) Tavecchio F., Ghisellini G., 2016, MNRAS, 456, 2374
- Tavecchio & Sobacchi (2019) Tavecchio F., Sobacchi E., 2019, arXiv e-prints, p. arXiv:1908.02183
- Tavecchio et al. (2010) Tavecchio F., Ghisellini G., Ghirlanda G., Foschini L., Maraschi L., 2010, MNRAS, 401, 1570
- Tchekhovskoy et al. (2009) Tchekhovskoy A., McKinney J. C., Narayan R., 2009, ApJ, 699, 1789
- Tchekhovskoy et al. (2011) Tchekhovskoy A., Narayan R., McKinney J. C., 2011, MNRAS, 418, L79
- Urry & Padovani (1995) Urry C. M., Padovani P., 1995, PASP, 107, 803
- Uzdensky et al. (2010) Uzdensky D. A., Loureiro N. F., Schekochihin A. A., 2010, Physical Review Letters, 105, 235002
- Werner et al. (2016) Werner G. R., Uzdensky D. A., Cerutti B., Nalewajko K., Begelman M. C., 2016, ApJ, 816, L8
- Werner et al. (2018) Werner G. R., Uzdensky D. A., Begelman M. C., Cerutti B., Nalewajko K., 2018, MNRAS, 473, 4840