A2 Collaboration at MAMI
Cross Section for measured at Mainz/A2
Abstract
The differential cross section evaluated for 27 energy bins span the photon-energy range 290–813 MeV ( = 1.195 – 1.553 GeV) and the pion c.m. polar production angles, ranging from 18∘ to 162∘, making use of model-dependent nuclear corrections to extract production data on the neutron from measurements on the deuteron target. Additionally, the total photoabsorption cross section was measured. The tagged photon beam produced by the 883-MeV electron beam of the Mainz Microtron MAMI was used for the -meson production. Our accumulation of events allowed a detailed study of the reaction dynamics. Our data are in reasonable agreement with previous A2 measurements and extend them to lower energies. The data are compared to predictions of previous SAID, MAID, and BnGa partial-wave analyses and to the latest SAID fit MA19 that included our data. Selected photon decay amplitudes at the resonance poles are determined for the first time.
I Introduction
The and families of nucleon resonances have many well-established members Tanabashi:2018oca , several of which overlap, having very similar masses and widths but different JP spin-parity values. There are two closely spaced states above the famous (1232) resonance: N(1520) and N(1535).
| Resonance | ||||||
|---|---|---|---|---|---|---|
| 12322 | 1173 | -2557 | -1356 | |||
| N(1440) | 144030 | 350100 | -6515 | +4510 | ||
| N(1520) | 151515 | 11010 | +1405 | -258 | -1158 | -508 |
| N(1535) | 153015 | 15025 | +10515 | -7520 |
One critical issue in the study of meson photoproduction on the nucleon comes from isospin. While isospin can change at the photon vertex, it must be conserved at the final hadronic vertex. The isospin amplitudes for the reactions are decomposed into three distinct (proton and neutron) and isospin components, and (see Ref. Drechsel:1992pn ). This expression indicates that the multipoles can be entirely determined from proton target data. However, measurements from datasets with both neutron and proton targets are required to determine the isospin amplitudes and to separate the and photon couplings. Only with good data on both proton and neutron targets one can hope to disentangle the isoscalar and isovector electromagnetic (EM) couplings of the various and resonances Watson:1954uc ; Walker:1968xu , as well as the isospin properties of the non-resonant background amplitudes. The lack of and data SAID does not allow us to be as confident about the determination of neutron couplings compared to those of the proton. Some of the -baryons (, for instance) have stronger EM couplings to the neutron relative to the proton, while others (for instance the nearby ) have weaker EM couplings to the neutron relative to the proton. However, the resonance parameters of both these states are very uncertain, see Table 1.
In the SAID partial-wave analysis (PWA), one can determine amplitudes by fitting the elastic data (up to = 2.5 GeV) Arndt:2006bf ; Workman:2012hx . Resonances are then found through a search for poles in the complex energy plane. The SAID group considers mainly poles which are not far away from the physical axis. It is important to emphasize that these resonances are not put in by hand, contrary to the Breit-Wigner (BW) parametrization. The poles arise, in a sense, dynamically as a result of the enforced (quasi-) two-body unitarity cuts and the fit to the observable on the real energy axis. The photoproduction multipoles can be parametrized using a form containing the Born terms (with no free parameters), phenomenological pieces maintaining the correct threshold behavior, and Migdal-Watson’s theorem Migdal:1955 ; Watson:1952ji below the two-pion production threshold. The matrix connects each multipole to structure found in the elastic scattering analysis. The parametrization above the two-pion production threshold is based on a unitary -matrix approach, with no strong constraints on the energy dependence apart from correct threshold properties.
Knowledge of the and resonance decay amplitudes into nucleons and photons is largely restricted to charged states. Apart from the lower-energy inverse reaction measurements, the extraction of the two-body and observables requires the use of a model-dependent nuclear correction, which mainly comes from final-state interaction (FSI) effects within the deuteron. Most data are unpolarized and cover fairly narrow energy ranges. Of these, only about 500 measurement data points exist, spanning the limited nucleon resonance region SAID .
A FSI correction factor was defined as the ratio between a sum of leading diagrams and an impulse-approximation (IA) that the GWU-ITEP group then applied to the experimental data to get a two-body cross section for Tarasov:2011ec and Tarasov:2015sta . The GWU SAID phenomenological amplitudes for and elastic scattering and were used as inputs to calculate the leading diagrams for the GWU-ITEP FSI code. The full Bonn potential was used for the deuteron description. Recently, the GWU-ITEP group determined differential cross sections from measurements made by the CLAS Chen:2012yv ; Mattione:2017fxc and MAMI/A2 Briscoe:2012ni Collaborations. In this way, we succeeded in the first determination of neutron couplings at the pole positions for a number of baryons, such as , , , and , significantly improving the world data Mattione:2017fxc .
The measurement on the deuteron target is much more complicated than because the can come from both and initial states. The GWU-ITEP studies have shown that photoproduction cross sections off the protons and neutrons are generally not equal Tarasov:2015sta :
| (1) |
where and are isovector and isoscalar amplitudes, respectively, and . However, in the special case, in the region of the and , the FSI corrections for and cross sections are equal due to the isospin structure of the amplitudes.
Recently, the A2 Collaboration at MAMI published high-quality unpolarized and polarized measurements for photoproduction on a proton target below = 2 GeV Gardner:2016irh ; Annand:2016ppc ; Schumann:2015ypa ; Adlarson:2015byy ; Sikora:2013vfa ; Hornidge:2012ca while one study was carried out for photoproduction on the neutron Dieterle:2018adj ; Dieterle:2017myg . This last study focuses on neutral pion photoproduction off the neutron using a deuteron target.
In the present paper new, precise, differential cross sections for = 290 to 813 MeV in laboratory photon energy, corresponding to center-of-mass (c.m.) energy range from = 1.195 to 1.553 GeV, are reported. Pion c.m. polar production angles, ranging from = 18∘ to 162∘, have been measured by the A2 Collaboration at MAMI. These new cross section data have almost doubled the world database below = 2.7 GeV SAID .
The organization of this paper is as follows. In Sec. II, details of the A2 experiment and the A2 detector are given. Section III outlines the event selection and Sec. IV reviews the approach for determining the final state interaction corrections. Section V presents and discusses the measured differential cross sections for the reaction . Section VI and L+P fit of the multipoles with determination of pole positions and residues. Finally, Sec. VII provides a summary of this work and the conclusions.
II Experimental Setup
The process was measured using the Crystal Ball (CB) Starostin:2001zz as the central spectrometer (Fig. 1). Our study shown that there is a marginal contribution from TAPS for the reaction below 800 MeV. For that reason, we did not use TAPS in our analysis. The CB was installed in the tagged bremsstrahlung photon beam of the Mainz Microtron (MAMI) Herminghaus:1983nv ; Kaiser:2008zza , with the photon energies determined by the Glasgow tagging spectrometer Anthony:1991eq ; Hall:1996gh ; McGeorge:2007tg .
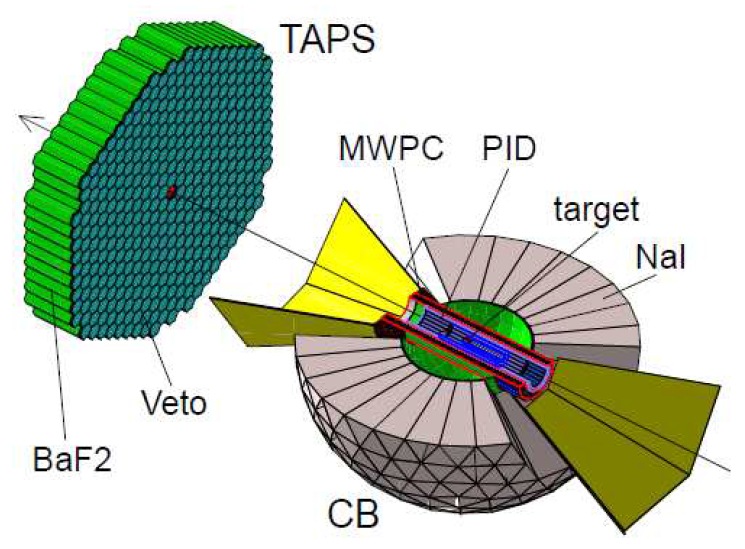
The CB spectrometer is a sphere consisting of 672 optically isolated NaI(Tl) crystals, shaped as truncated triangular pyramids, which point toward the center of the sphere. Each crystal is 41 cm long, which corresponds to 15.7 radiation lengths. The crystals are arranged in two hemispheres that cover 93% of sr, sitting outside a central spherical cavity with a radius of 25 cm, which is designed to hold the target and inner detectors. The CB calorimeter covers polar angles from 20∘ to 160∘ with full azimuthal coverage. The energy resolution for EM showers in the CB can be described as Starostin:2001zz . Shower directions are determined with a resolution in , the polar angle with respect to the beam axis, of , under the assumption that the photons are produced in the center of the CB. The resolution in the azimuthal angle is . That is an intrinsic CB resolution, while in the experiment, angular resolution in is mainly defined by the target length. The CB calorimeter is well suited for detection of both charged particles and -quanta. Simultaneously, CB can be used to detect neutrons in a wide range of energies Stanislaus:2001xk ; Bulychjov:2018mar .
The Mainz Microtron, MAMI, is a four-stage accelerator, and its latest addition (the fourth stage) is a harmonic double-sided electron accelerator Kaiser:2008zza . In this experiment, only the first three accelerator stages were used to produce an 883 MeV electron beam. Bremsstrahlung photons, produced by electrons in a 10-m Cu radiator and collimated by a 4-mm-diameter Pb collimator, were incident on a 10-cm-long and 4-cm-diameter liquid deuterium target (LD2) located in the center of the CB. The energies of the incident photons were analyzed up to 813 MeV by detecting the post-bremsstrahlung electrons in the Glasgow Tagger Anthony:1991eq ; Hall:1996gh ; McGeorge:2007tg .
The Tagger is a broad-momentum-band, magnetic-dipole spectrometer that focuses post-bremsstrahlung electrons onto a focal-plane detector, consisting of 352 half-overlapping plastic scintillators. The energy resolution of the tagged photons, which is about 1 MeV, is largely defined by the overlap region of two adjacent scintillation counters (a tagger channel) and the electron-beam energy used McGeorge:2007tg . For a beam energy of 883 MeV, a tagger channel has a width of about 2 MeV for a photon energy 707 MeV McGeorge:2007tg . Tagged photons are selected in the analysis by examining the correlation in time between a tagger channel and the experimental trigger derived from CB signals.
The LD2 target is surrounded by a particle identification detector (PID) Watts:2005ei , which is a cylinder of length 50 cm and diameter 12 cm, built from 24 identical plastic scintillator segments, of thickness 0.4 cm. Outside the PID, there are two multi-wire proportional chambers (MWPC), which measure the three-dimensional coordinates of a charged track.
The experimental trigger had one main requirement - the sum of the pulse amplitudes from the CB crystals had to exceed a hardware threshold that corresponded to an energy deposit larger than 40 MeV. To select the reaction , we require that the final and neutron were detected by the CB. In this case, the number of clusters which fire, i.e., groups of adjacent crystals in which energy is deposited by a particle’s interaction with the calorimeter, is equal to three.
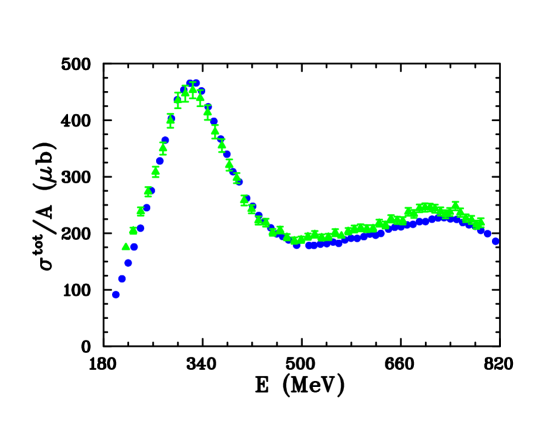
In order to provide a check on the performance of the CB detector, and to evaluate the efficiency of the trigger, a comparison of the total measured cross section, after the empty target background was subtracted, was made with the previously published total photoabsorption cross section measured by the DAPHNE experiment at MAMI MacCormick:1996jz ; MacCormick:1997ek . This comparison is shown in Fig. 2 for photon energies from 180 MeV to 820 MeV. In the region, the new and previous data are in agreement within the systematic uncertainties of the DAPHNE experiment (2.5% – 3.0%) and the new measurements (6%). Above 500 MeV, our cross section data fall slightly below the previous measurements. The difference reaches 6% at 700 MeV. We do not apply any correction for the acceptance of the CB detector, but both the CB and DAPHNE detectors do have a similar inefficient region at forward angles. The correction for this inefficiency has been extensively studied in Ref. Watts:2005ei , where it is shown that the dominant contribution comes from single charged pion production, and the value of this correction is 6%. Taking this into account, our data are in satisfactory agreement with the DAPHNE total photon absorption cross sections over the full photon energy range. This result demonstrates a high efficiency of the Crystal Ball detector for registering secondary particles and that the background present in the current measurement is small.
III Data Handling
The collected data allowed a detailed study of the reaction dynamics. The differential cross sections were determined for 27 energy bins and the full range of production angles using model-dependent nuclear corrections to determine data from measurements on the liquid deuterium target.
The main source of the background for our neutral channel is the reaction , where the high-energy proton was recorded by the PID detector, and such events were discarded from further analysis. Then the selection of the neutral pion is based on the search for two photons with an effective mass , close to the nominal mass of in the mass interval of 50 to 200 MeV. Reconstructed neutral pion and additional clusters in the CB calorimeter, to determine the direction of neutron emission, give complete reaction kinematics for .
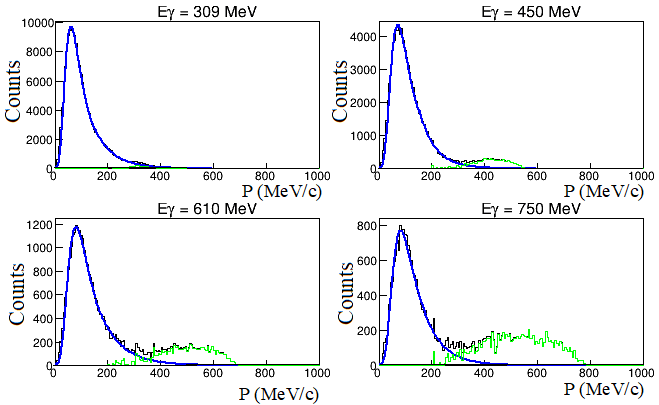
Analysis of the shape of the proton momentum spectrum allows us to determine the background contribution arising rom the production of two or more neutral pions. The distribution of the proton momentum spectrum is shown in Fig. 3, where the low momentum component, corresponding to the Fermi-momentum of nucleons in the deuteron Cool:1970fn , can be seen. It can be well described by the superposition of the Landau-function Landau:1944if in the peak region and an exponential to the right of the peak. Thus, the background can be removed for the component located in the high-momentum region on the right side of the distribution. The background significantly increases with the initial photon energy and reaches up to 40% at 800 MeV while it is almost zero at 200 MeV.
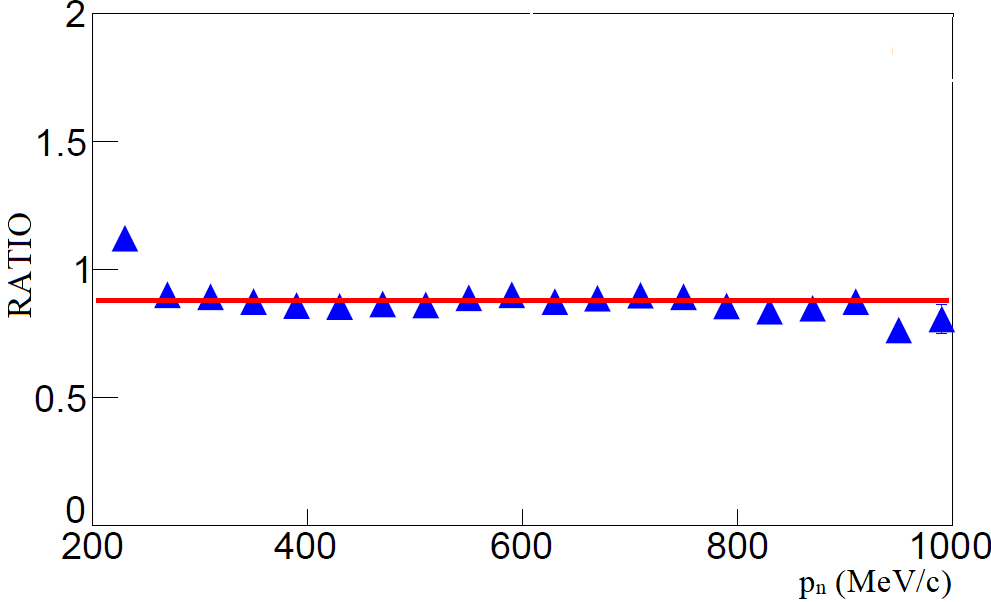
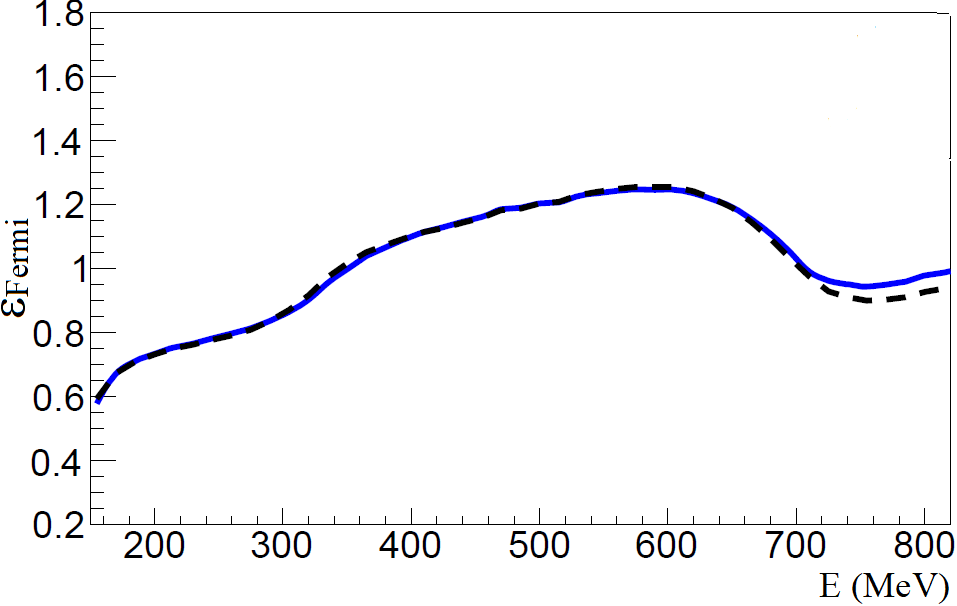
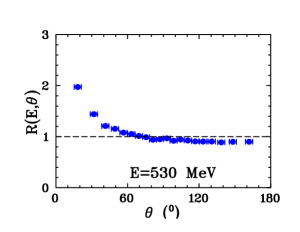
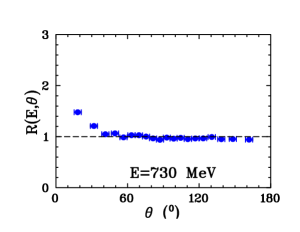
In this work, much attention was paid to the efficiency of neutron detection, knowledge of which is necessary to determine reaction cross sections. The thickness of CB crystals is one interaction length only, so it is impossible to measure neutron energy, however, it is possible to determine the location of the neutron interaction in CB. This is enough for neutron detection efficiency measurements using the same data. It has been done in Ref. Martemianov:2015oua by searching for the point of neutron interaction in the CB within a predicted direction from the kinematics of pion photoproduction on the deuteron with known kinematic parameters of a neutral pion and proton. It should be noted that the analysis of data at low photon energies is a rather difficult task. In this case, the neutron detection efficiency decreases with decreasing photon and neutron energies and is only a few percent at 20 – 30 MeV neutron energies, which can lead to inaccuracy in the analysis of experimental data. In addition to the CB calorimeter, the neutron detection threshold per cluster affects the efficiency of neutron detection. The ratio of the efficiency of neutron detection to simulation is shown in Fig. 4 (left) as a function of neutron momentum. To determine a full reaction efficiency, the software package Geant4 Allison:2016lfl was used in the simulation of the experiment. The event generator used a theoretical model based on a detailed description of the deuteron structure, taking into account the Fermi motion of nucleons in the deuteron and NN-FSI effects. To compare the results for the cross sections with the PWA predictions of SAID Mattione:2017fxc and MAID Drechsel:2007if , where the cross sections are given for the free neutron and neutron at rest (Fig. 4 (right)), it is necessary to take into account the corresponding corrections Bulychev:2018yjy . The calculations used corrections determined from the MAID2007 analysis. Corrections for the interaction effect in the final-state depending on the production angle in c.m. for different values of the incident photon energy are presented in Fig. 5. The effect of the FSI correction becomes significant especially, at low photon energies.
The photon flux is defined by counting the scattered electrons in the focal plane of the tagging system and correcting for the emitted photons lost in the collimator. The probability for bremsstrahlung photons to reach the target is measured periodically during data taking by a total-absorption lead glass counter, which is moved into the photon beam line at reduced photon intensity. Using this method, the tagging efficiency for an 883 MeV electron beam was determined to be approximately 35% with an accuracy of about 5%.
One of the main contributions to systematic uncertainties is the definition of the photon flux, which is based on the calculation of tagging efficiency. Another source of uncertainty is the background subtraction due to the empty target. This contribution is not large and has an order of 1%. The systematic uncertainty of the total photoabsorbtion cross section was defined by these two factors.
The analysis cuts and Monte Carlo simulations, used to obtain the total cross section, introduced a further uncertainty of the order of 1% – 2%. Furthermore, the accuracy of the neutron detection efficiency leads to an additional uncertainty at low energies of 3%. So, the total overall uncertainty for the total cross section is about 6%.
In the case of the differential cross sections, the largest systematic uncertainties appear at forward and backward pion angles, where the statistical errors increase. This effect is actually due to the low efficiency of neutron detection. The typical systematic uncertaintes at these forward and backward pion angles are estimated to be 10%.
IV Final-State Interaction
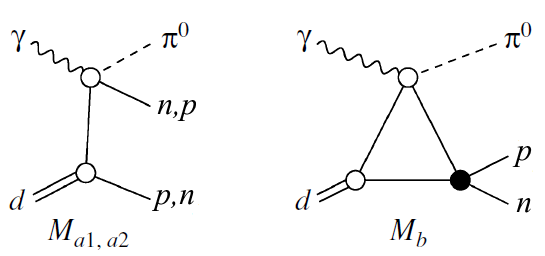
Exact determinations of the differential pion photoproduction cross sections on the neutron, based on experimental data for , can not be implemented without a reliable theoretical reaction model. This model was developed, taking into account the contribution not only of IA (Fig. 6 (left)), but also effects of and interactions in the final state. A detailed description of FSI effects is given in Refs. Tarasov:2011ec ; Tarasov:2015sta . The SAID phenomenological amplitudes, from Arndt:2007qn and Arndt:2006bf elastic with Dugger:2007bt PWAs, were used as input for the GWU-ITEP code. The full Bonn potential Machleidt:2000ge was used for the deuteron description and Fermi motion of nucleons in the deuteron was taken into account. In this paper, to speed up numerical calculations the model has been simplified. The contribution from -FSI, which is important close to the threshold, does not play a significant role above = 200 MeV, as claimed in Ref. Levchuk:2006vm , and so was neglected here. The effect of NN-FSI was taken into account in the S-wave approximation which makes the dominant contribution. The parameters of the -scattering -wave amplitudes with isospins and were taken from Ref. Landau:1991wop . Thus, the amplitude of the reaction (Fig. 6) is given as
| (2) |
where is a leading IA diagram with the fast neutron and is a correction that takes into account the -FSI () and IA diagram with regrouped nucleons (). The expressions for these amplitudes are given in detail in Appendix A of Ref. Tarasov:2015sta (Note that we did not include the off-shell factor for the amplitude, introduced in Ref. Tarasov:2015sta , Eq. (18)). Calculating such a correction for the analysis of the experimental data means taking into account each event with a weight as
| (3) |
where and are amplitude squares averaged over spins and calculated for the kinematics of the events. Furthermore, event handling was carried out under the assumption that the reaction mechanism is determined by the diagram .

So, we will determine the differential cross sections of the reaction from the measurements on the deuteron using the theoretical model, which describes the reaction .
V Experimental Results
The differential cross section for the reaction is defined by the formula:
| (4) |
where = () is the nuclear density of the liquid deuterium target; is the number of the events in , where is the neutral pion production angle in c.m. relative to the beam axis; is the number of counts in the tagger scalers; is the tagging efficiency (fraction of photons impinging on the target); is the selection efficiency obtained from the simulated data, which also includes neutron detection efficiency incorporated into the Monte-Carlo. The neutron detection efficiency is defined directly from data by the method proposed in Ref. Martemianov:2015oua ; is the background extraction efficiency, which included the empty target correction and the correction for random photons in the beam; is the correction factor for the PID inefficiency, this value was estimated on the experimental data from CB and MWPC and required to select a neutral decay channel; is the FSI-effect correction to get the cross section from the deuteron measurements, (see above).
Since our results for the differential cross sections consist of 492 experimental points, they are not tabulated in this publication but are available in the SAID database SAID along with their uncertainties and the energy binning.
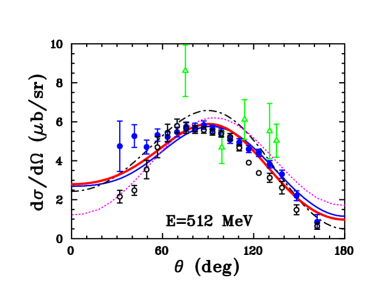
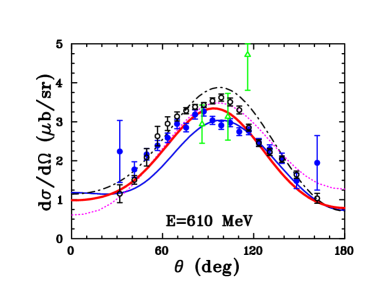
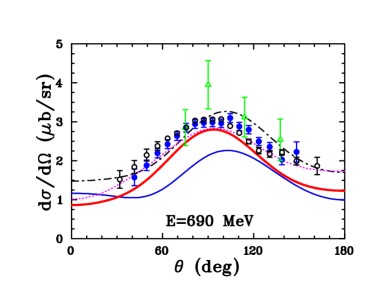
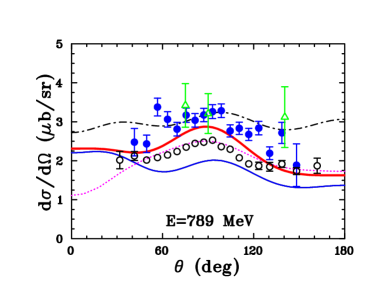
In Fig. 7, our differential cross sections for four incident photon energies are compared with previous measurements made at similar energies SAID . Some of these measurements Dieterle:2018adj are quite recent while most of them were performed in the 1970s at Tokyo and Frascati bremsstrahlung facilities, demonstrating the general desire of the resonance-physics community to obtain new data, which are needed for a better determination of the properties of the states. As seen in Fig. 7, all our results are in reasonable agreement with the previous measurements and significantly extend down to lower energies the previously published A2 data Dieterle:2018adj , covering the -isobar resonance peak region. Some discrepancies are observed between the data obtained at forward production angles, but this can be explained by the difference in the energy binning of the data sets, bearing in mind the rapidly falling cross section close to the forward direction where the FSI correction increases (Fig. 5).
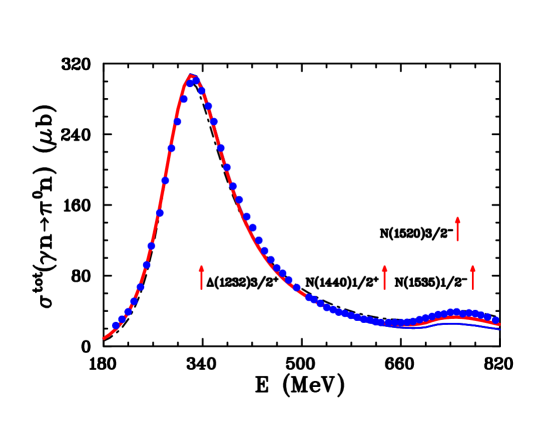
Presented in Fig. 8 are total cross sections for , compared with PWA fits. There are two structures visible here, the first associated with the , while a small structure is connected to the and .
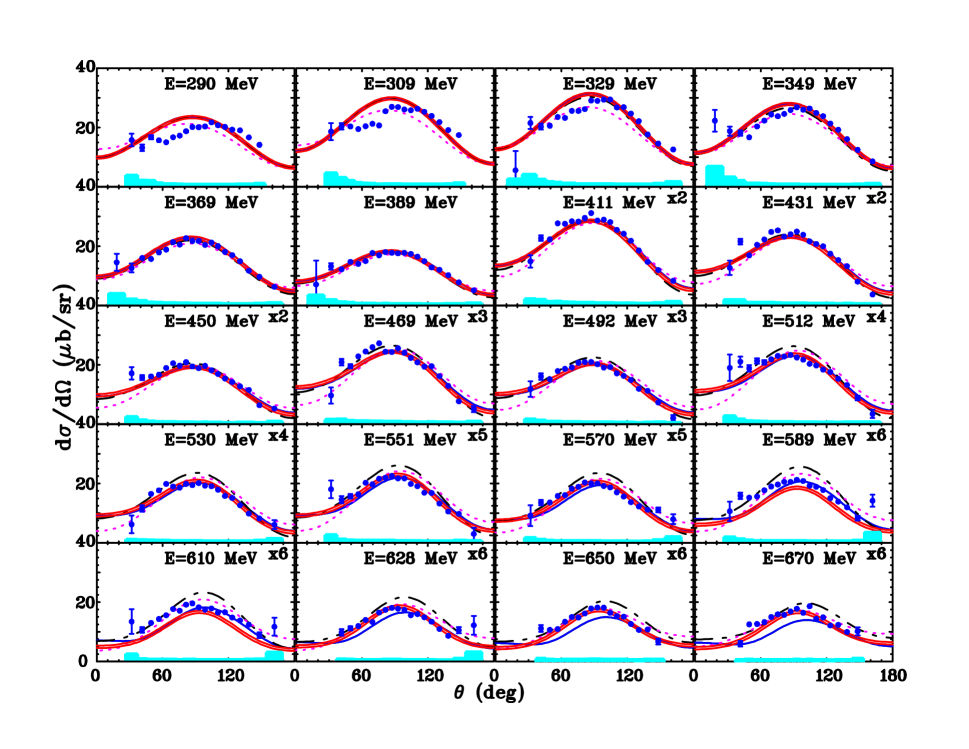
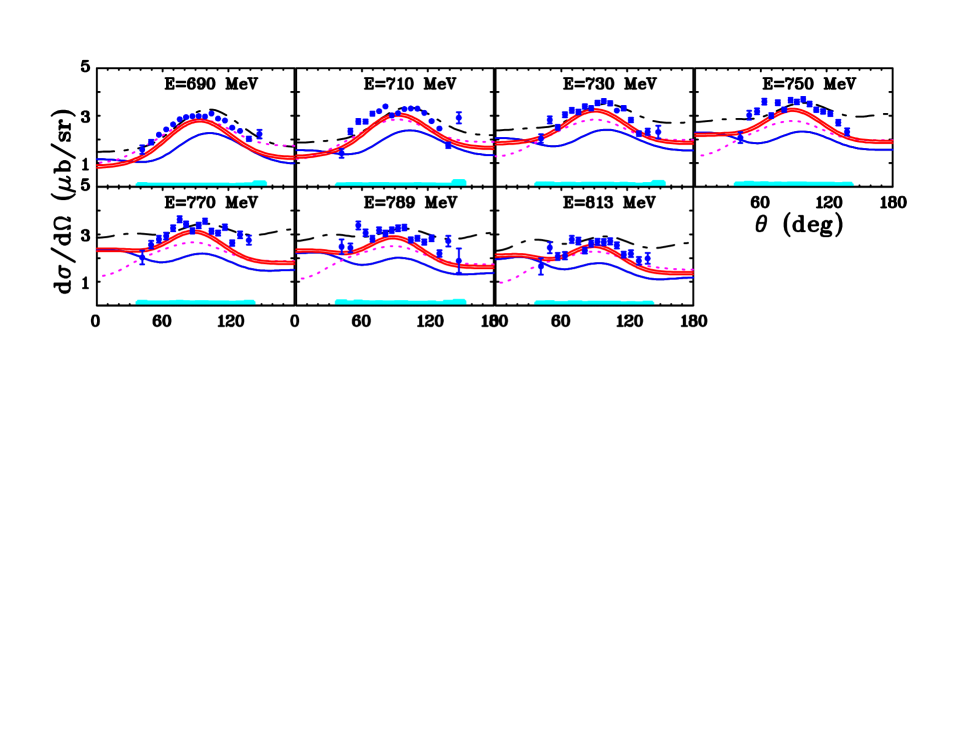
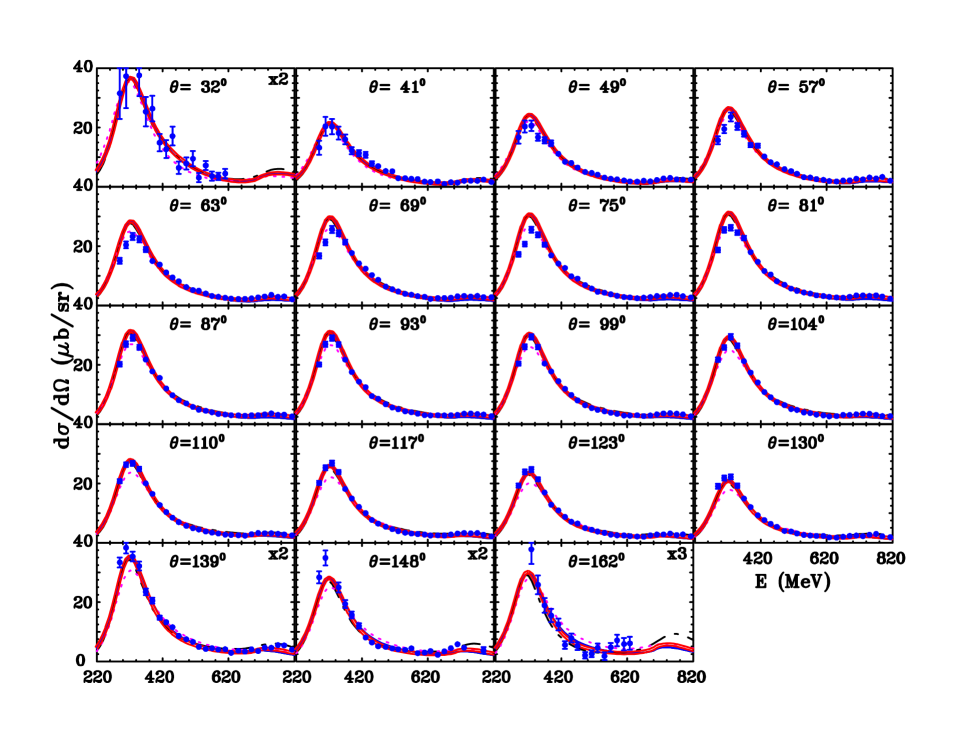
The new SAID best fit results MA19 are in satisfactory agreement with the data at energies exceeding 300 MeV (Figs. 9 - 11), and have visible discrepancies at lower energies (Fig. 9). Two reasons for this disagreement can be noted. Firstly, this is due to the possible underestimation of the interaction effect in the final state, which becomes important in this particular energy range. The simplified FSI code, for example, does not take into account the contribution of the -FSI effects which, as a result, may lead to distortion of the shape of the spectra of differential cross sections. Secondly, the neutron detection efficiency varies with energy. It decreases with decreasing particle momentum and is only a few percent (see, for instance, Fig. 9 of Ref. Martemianov:2015oua ), which can lead to large systematic errors.
VI Impact of the Present Data on Partial-Wave Analysis
The SAID parametrization of the transition amplitude used in the hadronic fits to the scattering data is given as
| (5) |
where , , and are channel indices for the , , , and channels. Here are the Chew-Mandelstam -matrices, which are parametrized as polynomials in the scattering energy. is the Chew-Mandelstam function, an element of a diagonal matrix in channel space, which is expressed as a dispersion integral with an imaginary part equal to the two-body phase space Arndt:1985vj .
In Ref. Workman:2012jf , it was shown that this form could be extended to to include the electromagnetic channel as
| (6) |
Here, the Chew-Mandelstam -matrix elements associated with the hadronic channels are kept fixed from the previous SAID solution SP06 Arndt:2006bf , and only the EM elements are varied. The resonance pole and cut structures are also fixed from hadronic scattering. This provides a minimal description of the photoproduction process, where only the and states present in the SAID scattering amplitudes are included in this multipole analysis.
With each angular distribution, a normalization constant and its uncertainty were assigned Arndt:2002xv . The quantity is generally associated with the systematic uncertainty (if known). The modified function to be minimized is given by
| (7) |
where the subscript labels the data points within the distribution, is an individual measurement, is the corresponding calculated value, and represents the total angle-dependent uncertainty. The total is then found by summing over all measurements. This renormalization freedom often significantly reduces the overall but may over-renormalize cross sections significantly beyond limits indicated by the systematic errors. This effect is evident when comparing the MA27 curve to the higher-energy data. By increasing the weight of the second term in our modified function, this problem was avoided. The weight was increased until the fitted renormalization factors remained inside limits suggested by the systematic errors. For other data analyzed in the fit, such as excitation data, the statistical and systematic uncertainties were combined in quadrature and no renormalization was allowed.
In the previous fits to the differential cross sections, the unrestricted best fit gave renormalization constants significantly different from unity. As can be seen from Eq. (7), if an angular distribution contains many measurements with small statistical uncertainties, a change in the renormalization may improve the fit with only a modest penalty. Here, however, the weight of the second term in Eq. (7) has been adjusted by the fit for each dataset to keep the renormalization constants approximately within of unity. This was possible without degrading the overall fit , as can be seen in Fig. 12.
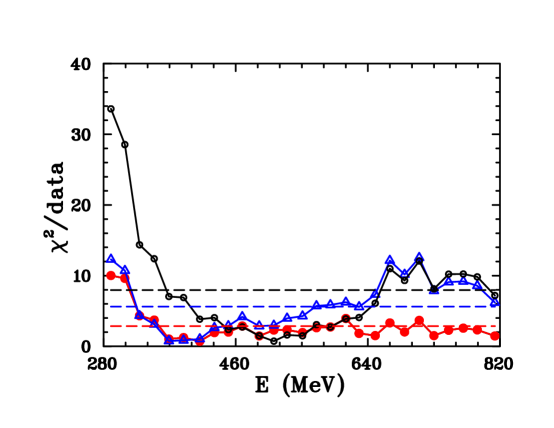
With the new high-precision cross sections from the present MAMI dataset, a new SAID multipole analysis has been completed. This new global energy-dependent (ED) solution has been labeled as MA19. The overall fit quality of the present MA19 and previous SAID MA27 solutions are compared in Table 2. The inclusion of the present dataset shows significant improvement in the comparisons between the SAID MA27 and MA19 solutions as shown in Fig. 12 and Table 2. This demonstrates the power of these cross section measurements with their small uncertainties. The overall comparison of the SAID MA19 and MA27 solutions in Table 2 shows that the fit /data values are essentially unchanged for pion photoproduction channels. The /data = 3.77 for MAID2007 vs new present A2 measurements is understandable since many recent datasets were not included in this analysis.
| Reaction | MAID2007 | SAID MA27 | SAID MA19 |
|---|---|---|---|
| Present | |||
| 1855/492=3.77 | 2765/492=5.62 | 1405/492=2.86 | |
| Previous | |||
| 156700/13988=11.20 | 25856/13988=1.85 | 23954/13988=1.71 | |
| 121150/5225=23.19 | 10785/5225=2.06 | 10371/5225=1.99 | |
| 49471/4142=11.94 | 7087/4142=1.71 | 6530/4142=1.58 | |
| 27060/515=52.54 | 2958/515=5.74 | 2320/515=4.51 | |
| Total | 354373/23870=14.85 | 46686/23870=1.96 | 43174/23870=1.81 |
Our next step is to extract the photon decay amplitude at the pole. We do this by extracting all the pole positions and residues of the relevant partial waves and then we use the residues to obtain the final result, as described in Ref. Workman:2013rca .
Similarly as in Ref. Mattione:2017fxc , the Laurent+Pietarinen (L+P) method has been applied to determine the pole positions and residues from the pion photoproduction multipoles Svarc:2014sqa . The driving concept behind the method is to replace the complexity of solving an elaborate theoretical model and analytically continuing its solution into the complex energy plane by using a local power-series representation of partial wave amplitudes that only exploits analyticity and unitarity. The L+P approach separates pole and regular parts in the form of a Laurent expansion, and instead of modeling the regular part using some physical model it uses the conformal-mapping-generated, rapidly converging power series with well-defined analytic properties called a Pietarinen expansion to represent it effectively. In other words, the method replaces the regular part, calculated in a model with the simplest analytic function that has the correct analytic properties of the analyzed partial wave (multipole), and which fits the given input. In such an approach, the model dependence is minimized, and is reduced to the choice of the number and location of L+P branch-points used in the model.
So, we expand the multipoles, , in terms of a sum over all poles and with a Pietarinen series representing the energy-dependent regular (non-pole) part as:
| (8) |
Here , , and are complex numbers representing the c.m. energy, residues, and pole positions for the ith pole, respectively, and is a regular function in the whole complex plane. As shown in Ref. Svarc:2013laa , a general unknown analytic function with branch-points in , , and can be expanded into a power series of Pietarinen functions as
| (9) | |||||
where , , and , , are real numbers that represent tuning parameters and coefficients of the Pietarinen functions , , and , respectively. A variable number of coefficients in three series of Eq. (9) were used, depending on the structure of the non-pole part of each amplitude.
When the input data statistically satisfies the normal distribution (meaning that they are acquired in a non-correlated procedure), the estimation of the errors of all resulting pole parameters can be obtained directly from any standard minimization routine. However, in our case, the nearby energy points of the input multipoles are correlated through analyticity of the energy-dependent partial wave of MA19 solution, so the standard error analysis cannot be used as the standardly defined becomes extremely small () regardless of which error is attributed to the input. So, the error analysis of resulting parameters cannot be reliably performed.
In this paper, we improve this aspect of our model, and introduce a procedure that creates completely realistic errors for pole parameters extracted from ED MA19 partial waves. First, we have to attribute realistic errors to MA19 ED solutions. We do it by using MA19 single-energy (SE) analysis as the measure of how good an ED analysis actually is. We perform SE PWA at energies where we have an abundance of experimental data, and constrain it to an ED MA19 partial wave strong enough to achieve the continuity in energy, and weak enough to give enough freedom for the fit to move away as much as possible from the ED MA19 solution in coming maximally close to the experiment. In that way at each energy the SE solution maximally reproduces the available experimental data base, so we are definitely closer to experiment than the ED MA19 solution is. The probability that the true value lies inside the interval which is defined by the difference between partial wave values in the ED and SE points dif = is, therefore, close to 100 %, so we define the standard deviation of the partial wave ED value as .
The next step is eliminating the correlations between neighboring energy points in the ED PW, which is introduced by the analyticity of the fitting function. This is done by randomizing central values of the ED solution with PW standard deviation , and assigning the error of the source ED error of the randomized point. In this way, we generate 1000 ensembles of randomized ED, which then independently fitted, and an ensemble of 1000 pole parameters for the investigated partial waves was obtained. We confirm that the obtained ensemble corresponds to the normal distribution by generating the probability density function of the ensemble, and verifying that the shape of the obtained histogram is well reproduced with this, properly normalized, function. If this is the case, we then make a standard normal distribution error analysis of the generated ensemble, and pole parameters with realistic errors are obtained. In cases where this criterion is not matched, we have to modify the obtained ensemble by cutting out the points which erroneously enter this ensemble, and which belong to the nearby local minimum of the L+P minimization procedure. When the new ensemble matches the criterion, we are free to make the desired error analysis. Once the pole position and residue were determined, the photon decay amplitude at the pole could be constructed, as described in Ref. Workman:2013rca . The residue of the corresponding elastic scattering amplitude, required in this construction, was taken from the SAID analysis of elastic scattering data Arndt:2006bf . The spread of determinations found in Ref. Tanabashi:2018oca was used to estimate its uncertainty.
Final results for the photon-decay amplitudes are listed in Table 3. Here comparisons are made with the Bonn-Gatchina (BnGa) and Kent State University (KSU) values and with an earlier SAID determination. For the , the PDG2018 lists only BW values. This being the first determination of pole values, we compared at the level of moduli, finding good agreement. The agreement between BW and pole values is not as good for the Roper resonance, where the complicated pole-cut structure may invalidate this simple comparison of pole and BW quantities.
| Resonance | Coupling | SAID MA19 | SAID MA27 | BnGa | KSU |
|---|---|---|---|---|---|
| N(1440)1/2+ | A1/2(n) | 8010, 92∘ | 655, 53∘ | 4312† | 1312† |
| N(1520)3/2- | A3/2(n) | -1308, 206∘ | -11312† | -1236† | |
| N(1520)1/2- | A1/2(n) | -474, 12∘ | -498† | -723† | |
| N(1535)1/2- | A1/2(n) | -7010, 25∘ | -555, 52∘ | -884, 54∘ | -556† |
| N(1650)1/2- | A1/2(n) | 134, -5015∘ | 142, -3010∘ | 164, -2810∘ | 16† |
VII Summary and Conclusion
The differential cross sections have been measured at the tagged photon facility of the Mainz Microtron MAMI using the Crystal Ball spectrometer. The data span the photon-energy range 290–813 MeV ( = 1.195 – 1.553 GeV) and from 18∘ to 162∘ c.m. angular range. The accumulation of events allows fine binning of the data in energy and angle, which will enable the reaction dynamics to be studied in greater detail. The present differential cross section data are in reasonable agreement with the previous measurements, but the energy binning much finer, we covered much low energies and something for the very low energy range in the maximum of the -isobar, and we used FSI corrections. Additionally, the total photoabsorption cross section was measured.
Differential cross sections have visible discrepancies when compared to the predictions from SAID, MAID, and BnGa at energies below 300 MeV and are in satisfactory agreement with PWA results at higher-energies.
A comparison of determinations for photon-decay amplitudes at the pole shows reasonably good agreement. The only noticeable exception is seen in the Roper photon-decay amplitude. Here, the difference may be due to the comparison of BW and pole-valued quantities. It will be interesting to see updated BnGa results at the pole once these data have been incorporated into new fits.
VIII Acknowledgements
This work was supported in part by the U.S. Department of Energy, Office of Science, Office of Nuclear Physics, under Awards No. DE–FG02–01ER41194, DE–SC0016583, DE–SC0016582, and DE–SC0014323. We would like to thank all the technical and non-technical staff of MAMI for their support. This work was supported by Schweizerischer Nationalfonds (Grant No. 200020- 132799, 121781, 117601, 113511), Deutsche Forschungsgemeinschaft (SFB Grant No. 443, SFB/TR 16, SFB 1044), DFG-RFBR (Grant No. 05–02–04014), UK Science and Techology Facilities Council (STFC Grant No. 57071/1, 50727/1), Russian Foundation for Basic Research (RFBR Grant No. 16–02–00767–a), European Community Research Infrastructure Activity (FP6), the U. S. DOE, U. S. NSF, and NSERC (Grant No. SAPPJ–2018–00020) Canada.
References
- (1) M. Tanabashi et al. [Particle Data Group], Phys. Rev. D 98, no. 3, 030001 (2018).
- (2) D. Drechsel and L. Tiator, J. Phys. G 18, 449 (1992).
- (3) K. M. Watson, Phys. Rev. 95, 228 (1954).
- (4) R. L. Walker, Phys. Rev. 182, 1729 (1969).
- (5) W. J. Briscoe, M. Döring, H. Haberzettl, I. I. Strakovsky, and R. L. Workman, Institute of Nuclear Studies of The George Washington University Database; http://gwdac.phys.gwu.edu/ .
- (6) R. A. Arndt, W. J. Briscoe, I. I. Strakovsky, and R. L. Workman, Phys. Rev. C 74, 045205 (2006).
- (7) R. L. Workman, R. A. Arndt, W. J. Briscoe, M. W. Paris, and I. I. Strakovsky, Phys. Rev. C 86, 035202 (2012).
- (8) A. B. Migdal, Sov. Phys. JETP 1, 2 (1955).
- (9) K. M. Watson, Phys. Rev. 88, 1163 (1952).
- (10) V. E. Tarasov, W. J. Briscoe, H. Gao, A. E. Kudryavtsev, and I. I. Strakovsky, Phys. Rev. C 84, 035203 (2011).
- (11) V. E. Tarasov, W. J. Briscoe, M. Dieterle, B. Krusche, A. E. Kudryavtsev, M. Ostrick, and I. I. Strakovsky, Phys. Atom. Nucl. 79, no. 2, 216 (2016).
- (12) W. Chen et al., Phys. Rev. C 86, 015206 (2012).
- (13) P. T. Mattione et al. [CLAS Collaboration], Phys. Rev. C 96, no. 3, 035204 (2017).
- (14) W. J. Briscoe, A. E. Kudryavtsev, P. Pedroni, I. I. Strakovsky, V. E. Tarasov, and R. L. Workman, Phys. Rev. C 86, 065207 (2012).
- (15) S. Gardner et al. [A2 Collaboration at MAMI], Eur. Phys. J. A 52, no. 11, 333 (2016).
- (16) J. R. M. Annand et al. [A2 Collaboration at MAMI], Phys. Rev. C 93, no. 5, 055209 (2016).
- (17) S. Schumann et al. [A2 Collaboration at MAMI], Phys. Lett. B 750, 252 (2015).
- (18) P. Adlarson et al. [A2 Collaboration at MAMI], Phys. Rev. C 92, no. 2, 024617 (2015).
- (19) M. H. Sikora et al. [A2 Collaboration at MAMI], Phys. Rev. Lett. 112, no. 2, 022501 (2014).
- (20) D. Hornidge et al. [A2 and CB-TAPS Collaborations], Phys. Rev. Lett. 111, no. 6, 062004 (2013).
- (21) M. Dieterle et al. [A2 Collaboration at MAMI], Phys. Rev. C 97, 065205 (2018).
- (22) M. Dieterle et al. [A2 Collaboration at MAMI], Phys. Lett. B 770, 523 (2017).
- (23) A. Starostin et al. [Crystal Ball Collaboration], Phys. Rev. C 64, 055205 (2001).
- (24) K. H. Kaiser et al., Nucl. Instrum. Meth. A 593, 159 (2008).
- (25) H. Herminghaus et al., IEEE Trans. Nucl. Sci. 30, 3274 (1983).
- (26) I. Anthony, J. D. Kellie, S. J. Hall, G. J. Miller, and J. Ahrens, Nucl. Instrum. Meth. A 301, 230 (1991).
- (27) S. J. Hall, G. J. Miller, R. Beck, and P. Jennewein, Nucl. Instrum. Meth. A 368, 698 (1996).
- (28) J. C. McGeorge et al., Eur. Phys. J. A 37, 129 (2008).
- (29) T. D. S. Stanislaus et al., Nucl. Instrum. Meth. A 462, 463 (2001).
- (30) S. A. Bulychjov, A. E. Kudryavtsev, V. V. Kulikov, M. A. Martemianov, V. E. Tarasov, M. A. Lizunova, W. J. Briscoe, and I. I. Strakovsky, KnE Energ. Phys. 3, 51 (2018).
- (31) D. P. Watts [for Crystal Ball@MAMI Collaboration], Proceedings of the 11th International Conference on Calorimetry in Particle Physics, Perugia, Italy, 2004 (World Scientific, 2005), p. 560.
- (32) M. MacCormick et al., Phys. Rev. C 53, 41 (1996).
- (33) M. MacCormick et al., Phys. Rev. C 55, 1033 (1997).
- (34) R. L. Cool, G. Giacomelli, T. F. Kycia, B. A. Leontic, K. K. Li, A. Lundby, J. Teiger, and C. Wilkin, Phys. Rev. D 1, 1887 (1970).
- (35) L. Landau, J. Phys. (USSR) 8, 201 (1944).
- (36) M. Martemianov et al. [A2 Collaboration at MAMI], JINST 10, no. 04, T04001 (2015).
- (37) J. Allison et al., Nucl. Instrum. Meth. A 835, 186 (2016).
- (38) D. Drechsel, S. S. Kamalov, and L. Tiator, Eur. Phys. J. A 34, 69 (2007); the MAID analyses are available through the Mainz website: http://maid.kph.uni-mainz.de/ .
- (39) S. A. Bulychev, A. E. Kudryavtsev, V. V. Kulikov, M. A. Martem’yanov, V. E. Tarasov, W. J. Briscoe, and I. I. Strakovsky, Phys. Atom. Nucl. 80, no. 9, 1549 (2017); [Yad. Fiz. 7, no. 4, 374 (2016)].
- (40) R. A. Arndt, W. J. Briscoe, I. I. Strakovsky, and R. L. Workman, Phys. Rev. C 76, 025209 (2007).
- (41) M. Dugger et al. [CLAS Collaboration], Phys. Rev. C 76, 025211 (2007).
- (42) R. Machleidt, Phys. Rev. C 63, 024001 (2001).
- (43) M. I. Levchuk, A. Y. Loginov, A. A. Sidorov, V. N. Stibunov, and M. Schumacher, Phys. Rev. C 74, 014004 (2006).
- (44) L. D. Landau and E. M. Lifshits, “Quantum Mechanics: Non-Relativistic Theory,” (Pergamon Press, 1958).
- (45) D. Werthmüller et al., Phys. Rev. C 90, no. 1, 015205 (2014); the Bonn-Gatchina analyses are available through the Bonn website: http://pwa.hiskp.uni-bonn.de/ .
- (46) Y. Wunderlich, F. Afzal, A. Thiel, and R. Beck, Eur. Phys. J. A 53, no. 5, 86 (2017).
- (47) M. Dugger et al. [CLAS Collaboration], Phys. Rev. C 88, no. 6, 065203 (2013); Addendum: [Phys. Rev. C 89, no. 2, 029901 (2014)].
- (48) R. A. Arndt, J. M. Ford, and L. D. Roper, Phys. Rev. D 32, 1085 (1985).
- (49) R. L. Workman, M. W. Paris, W. J. Briscoe, and I. I. Strakovsky, Phys. Rev. C 86, 015202 (2012).
- (50) R. A. Arndt, W. J. Briscoe, I. I. Strakovsky, and R. L. Workman, Phys. Rev. C 66, 055213 (2002).
- (51) R. L. Workman, L. Tiator, and A. Sarantsev, Phys. Rev. C 87, no. 6, 068201 (2013).
- (52) A. Švarc, M. Hadžimehmedović, H. Osmanović, J. Stahov, L. Tiator, and R. L. Workman, Phys. Rev. C 89, no. 6, 065208 (2014).
- (53) A. Švarc, M. Hadžimehmedović, H. Osmanović, J. Stahov, L. Tiator, and R. L. Workman, Phys. Rev. C 88, no. 3, 035206 (2013).
- (54) A. V. Anisovich, V. Burkert, E. Klempt, V. A. Nikonov, A. V. Sarantsev, and U. Thoma, Phys. Rev. C 95, no. 3, 035211 (2017).
- (55) A. V. Anisovich, V. Burkert, E. Klempt, V. A. Nikonov, A. V. Sarantsev, and U. Thoma, Eur. Phys. J. A 49, 67 (2013).
- (56) B. C. Hunt and D. M. Manley, Phys. Rev. C 99, no. 5, 055205 (2019).