Migrant mobility flows characterized with digital data
Abstract
Monitoring migration flows is crucial to respond to humanitarian crisis and to design efficient policies. This information usually comes from surveys and border controls, but timely accessibility and methodological concerns reduce its usefulness. Here, we propose a method to detect migration flows worldwide using geolocated Twitter data. We focus on the migration crisis in Venezuela and show that the calculated flows are consistent with official statistics at country level. Our method is versatile and far-reaching, as it can be used to study different features of migration as preferred routes, settlement areas, mobility through several countries, spatial integration in cities, etc. It provides finer geographical and temporal resolutions, allowing the exploration of issues not contemplated in official records. It is our hope that these new sources of information can complement official ones, helping authorities and humanitarian organizations to better assess when and where to intervene on the ground.
Introduction
Migration is an ubiquitous phenomenon in human history. People move to improve living conditions or, simply, to escape social distress jones2015 and natural disasters lopez2015 . The collection of data on migration flows dates back at least to , when the United Kingdom registered the difference of inhabitants in a period of a decade ravenstein1885 . The data showed that the population changes could not be explained by the number of births and deaths alone, hence another reason had to be involved in the process: migration. Official data on migration flows relies on the comparison of heterogeneous records across countries, which usually have different time scales and time coverage abel2014 . Data sources include national census, which are released every 10 years, specific surveys, border control and residence permits requests. Surveys and census records are helpful tools for estimating migratory statistics, but the information is not provided at a multinational scale, they are costly and, consequently, the update times tend to be long. Looking at a single country, the net population variation, besides changes due to births and deaths, can be calculated as the difference between the number of immigrants and emigrants. Migrants’ mobility, however, can involve several countries biasing the single-country statistics. There can be multiple entrances in a country by the same individual or several countries along the trajectory of migrants. This adds inconsistencies to the information at the local perspective, e.g., recurring and returning migrants can affect the number of border crossing events. To capture the complexity of the migratory phenomenon, the concept of interregional flows must be introduced rogers1986 . In this context, another potential data source could be air traffic records that allow to estimate human mobility worldwide barrat2004 . However, they only capture one transportation mode, long or medium distance movements and there exist a bias toward wealthier individuals.
Given this situation, there has been recent calls for new sources providing reliable data on the mobility of migrants and, especially, refugees willekens2016 ; editorial2017 ; butler2017 ; dijstelbloem2017 . Data associated to the use of information and communication technologies (ICT) has experienced a large growth in the last decade. ICT data contains temporal and spatial records and it is a useful, fast and inexpensive information source to characterize human mobility at different scales jose2018 . For example, mobile phone records have been employed to study human mobility with promising results at urban kang2012 ; calabrese2013 ; louail2014 ; Yang2018 and inter-urban level gonzalez2008 ; krings2009 ; kung2014 . They have been also used to analyze migrant communities distribution and integration in cities bajardi2015 ; alfeo2019 . Yet the phone sector is too fragmented to cover a global scale since the data is usually restricted to a single country, making cross-border movements hard to observe. Other examples with similar, yet even more reduced geographical scope, are the GPS tracks left by cars gallotti2016 .
To expand the focus beyond national borders, we need data coming from services that are genuinely transnational. The widespread adoption of online social networks has finally introduced such global dimension. For instance, the advertising tool of Facebook has been used as a source of migration data although the internal user classification of the platform is not very transparent zagheni2017 . In a more open context, data from Twitter has been used to uncover worldwide patterns of human mobility hawelka2014 ; lenormand2015 ; dredze2016 , infer international migration flows zagheni2014 ; aswad2018 ; hausman2018 , estimate cross-border movements blanford2015 and study immigrant integration arribas2015 ; lamanna2018 . Twitter data is also available in countries where census data is unaccessible, outdated or only attainable in the local language stepanova2011 . Furthermore, Twitter data has been shown to bear mobility information compatible with the one provided by cell phone records in cities lenormand2014 . On the other hand, the data is sparse (i.e., users are not continuously active) and there are biases towards younger and richer individuals lenormand2014 ; mislove2011 ; bokanyi2016 ; sloan2017 . This implies that, when taking into account smaller scales, a thorough validation exercise is necessary. Although geolocated Twitter data is sparser than census, surveys and mobile phone records, the observed level of correlation allows for the interchangeability of these sources to study population density and mobility lenormand2014 ; lenormand2014b ; mazzoli2019 .
In this work, we introduce a method to uncover migration flows using Twitter data. As a proof of concept, we focus on the current Venezuelan migration crisis. At country level, the flows obtained from Twitter have been validated against official estimations released by the International Organization for Migration (IOM) in September 2018, the Federal Police (Policia Federal) of Brazil and by the United Nations High Commissioner for Refugees (UNHCR or ACNUR) in November 2018 and January 2019. Furthermore, our method provides information at finer geographical and temporal resolutions. It also allows the exploration of other issues not contemplated in official records, such as mobility across multiple countries, routes taken by the migrants, as well as the places where they settle down.
Materials and methods
Classical data sources
Traditionally, official statistics come from census surveys, household or labor surveys, population registers, administrative records and border control. For sake of completeness, we briefly summarize the characteristics of these sources and offer references for further information. In terms of surveys and starting by census, surveys of census focus on migrant stocks or migrant flows including socio-economic features like the country of birth, citizenship, age, sex, education, occupation and time of arrival of migrants in the new country bilsborrow1997 ; united2008 . Spatial information in census surveys is typically given at regional scale but modern censuses provide information even at finer scales. The typical limitations of censuses on migration data are their cost, the slow updating (usually every 5 or 10 years), which decreases the information validity since it gets outdated fast, and the fact that they do not capture illegal immigration. Secondly, household surveys, apart from measuring migrant stocks or migrant flows, focus on the drivers and the impact of migration, internal displacement, emigration and immigration of a given country. A third source comes from labor force surveys which produce statistics on migrant stocks in the labor market of the country. These data allow for country by country comparability and they offer detailed data on small population groups. However, many countries do not include crucial migration questions in their census surveys such as citizenship, country of birth and year of immigration of the person, they may be infrequent or costly and can also present issues with sample size and coverage.
Population registers are held by local authorities and, as the surveys, provide information on the people living in the area. However, there are differences on how the registers are designed, how they define residence, on the population coverage sometimes excluding foreigners, e.g. citizens of some countries are not required to register inside EU states and sometimes leaving migrants are not required to unregister. As a result, they lack of comparability from country to country. Other important and classical sources of migrant flows and stocks gathered in a different way comes from administrative records, which can include records of citizens changing their usual residence, tourist visas, work visas, study permits, residence permits and work permits. Even if these records are continuous and comprehensive, they lack compatible definitions among different countries, moreover they often lack coverage and availability in some countries. Further issues may come from the fact that this data often does not cover naturalized or illegal residents who overstay their visas. Data may not represent the total number of immigrants in the country, e.g., if the visa granted to the head of the family covers his or her dependents and, as a further example, authorities may not track renewals or changes of citizenship. Lastly, border post records of leaving or entering people keep track of flows between countries. These records often do not discern between migration flows and other kinds of mobility, such as tourism. Moreover, in places where the possibility of evading the border control is high, the records become highly unreliable. A review on these classical methods can be found at hughes2016 ; UNmigport . In particular, here we employ official data from border control, permits statistics and registers gathered by the UNHCR unhcr2018 ; unhcr2019 , the IOM iom2018 and the Federal Police of Brazil pfb2018 to validate the information obtained from Twitter.
Twitter data for mobility information
Classical data sources have major caveats in terms of comparability, coverage and immediacy of the furnished information willekens2016 ; editorial2017 ; butler2017 ; dijstelbloem2017 ; cesare2018 . ICT data has the potential to complement classical sources by generating estimates of socio-economic phenomena such as transport, mobility, urbanism and migration. Of all the possible ICT data like mobile phone records, social networks, etc., Twitter is one of the most accessible since the data is openly distributed. Twitter data is not safe from biases, several studies demonstrated that people tweeting are mostly young, wealthy and tend to live in cities mislove2011 ; sloan2015 . However, more recent studies show that the relevance of some of these biases like those related to age or geographical origin are slowly decreasing bokanyi2016 ; sloan2015 .
Beyond demographics, the impact of biases in the study of aggregated mobility from geolocated tweets has been addressed in lenormand2014 ; lenormand2014b . Origin-destination (OD) matrices obtained from Twitter, mobile phone records and mobility surveys were found to be equivalent at scales larger than one square kilometer. This is due to the fact that mobility patterns are not strongly dissimilar across age groups and gender lenormand2015t and the demographic biases do not influence so strongly the OD matrices extracted. A similar effect could be expected in refugees and migrant displacements that may be carried out in groups, and thus detecting some members could be enough to describe the mobility patterns.
Accessing and filtering Twitter data
The data was accessed using the publicly available Twitter Streaming API API , selecting tweets with geographical information (a description of the script employed is included in Availability of data and materials). We have collected data from January 2015 to April 2019. The location has to be provided at the level of place with a bounding box smaller than on the longest side, otherwise the tweets are not included in the spatial analysis but we still use them to count country-level flows (using the country identification in the tweet). A minimal filter for bots is implemented by neglecting users tweeting more than twenty times per hour on average in their tweeting life span. Multi-thread tweets are counted as a single one. The analysis focuses on South and Central America and Caribbean, where over of the Venezuelan migration is concentrated, according to the UN UN70 . We divided this extensive territory in a grid of cells of side, which became our basic spatial units. The position of the users is approximated by the centroid of the cells where they tweet from. With this information, we calculate the radius of gyration of each user trips:
| (1) |
where is the number of tweets, the cell centroid and stands for the center of mass of each user movements. We disregard users with (see the distribution of in the Supporting Information) because this implies all the trips are long distance. These accounts are typically multiuser, institutional or company, and cannot offer any mobility information.
Ethics statement
As a final comment, we adhere to strict data responsibility and ethics principles, ensuring that no personally identifiable information is kept. The meta-data of the tweets, which can be considered personal, are deleted before storage and the user ID is irreversibly encrypted using a SHA-512 algorithm. We do not track individuals, all the spatial analyses are performed using aggregated trips and number of residents at a minimal scale of and in most of the cases over . All the figures and tables show aggregated data and only when the number of individuals is larger than three in a cell.
Resident classification
There is no unique definition of resident applicable to a situation with sparse data as ours. Given the lack of clear definition, we provide several definitions and check if they bear differences in the outcomes of the analyses. Every tweet has an associated country code reference. Users tweeting from Venezuela less then five times in the period 2015-18 or with all the tweets posted in a time window shorter than three months were excluded from the study as non-representative data. After that for each user we identified the most common country of origin of the tweets posted every month. By doing so, we created the users’ history as a sequence of country flags, with one flag for each month. In particular, if the most common country was Venezuela, we labeled the corresponding month as ”Ven”. If, for a given month, there were no tweets posted or there was a draw between Venezuela and another country, we labeled the month as ”Und” (for ’undetermined’). Then we considered the following criteria to discern Twitter Users which are Venezuelan residents (TUVs) based on filters with a gradual level of restriction:
-
•
The first criterion is the most restrictive one. We considered TUVs the users appearing to be flagged Venezuela three months in a row at least once in our database. In this way, we obtained approximately TUVs.
-
•
The second criterion is slightly less restrictive. It included the users identified before and those with a sub-sequence Ven-Und-Ven. With this method we estimated around TUVs.
-
•
The third criterion is similar to the previous one. We included all the users coming from the first criterion and added those with a sequence Und-Ven-Ven or Ven-Ven-Und. This yielded around TUVs.
-
•
The fourth criterion is comprehensive of all of the above. With this method, we obtained around TUVs.
Determining the number of TUVs is crucial not only to measure the displacement flows but also to infer the upscaling factors as discussed in the subsection on upscaling factors. These factors allow us to translate the observed TUV numbers into the total flows. We estimated them as the ratio between the population of the country projected from the census and the number of TUVs, updated every year in terms of empirical flows recorded.
Definition of migrants
The UN definition of long-term migrant requires the person to stay in the new country for at least 12 months migrant_UN . The number of migrants estimated by UN agencies in a single country often relies on records referring to residence permits or flows observed at the border. The objective in this work is to capture flows of people leaving a country in a humanitarian crisis. Definitions based on long-time scales are not adequate for describing population mobility under these circumstances and it does not exist a universal definition of migrant migrant_UN . Therefore, abusing the term, we consider here as migrant any individual leaving Venezuela during the time window of observation.
Results
Upscaling factors
The number of TUVs identified with the four criteria and detected as active (posting tweets) every year is shown in Table 1. As shown in the Table, independently of the criteria used the number of TUVs is relatively stable in 2015 and 2016, and then we found a decline of over in 2017 and almost in 2018. The migration crisis had the first peak in the last months of 2016, so there is a combination of factors that can explain the drop in the number of TUVs. The first one is migration to other countries –estimating this is our target–, which can dissuade users from using geolocated social networks, but this factor alone does not explain the entire complexity of the change. We see a drop of TUVs with criterion 4 between 2016 and 2017, while the observed TUVs leaving the country with the same criterion 4 in 2016 is TUVs. Other factors such as the general use of geolocated Twitter, as well as economic and social stress, must have contributed to such a systematic decline. This impression is further confirmed when, as a proof of concept, the number of geolocated users residing in Colombia is analyzed using the corresponding criterion 4 for this country. We observe a drop in the same years from 2016 to 2017, from to . A general drop in the use of geolocated Twitter seems to be happening in the South American region. The population of Venezuela in 2011, according to the census, was million inhabitants censo_ve . The United Nations Population Division projects the Venezuelan population at around million for 2015 UNpop . As a simplifying assumption, we neglect the population changes due to the difference between natality and mortality. Given the short period of time considered, its effects on the total population are much weaker than those introduced by migration. The number of active TUVs that same year according to criterion 4 was . This gives us an upscaling factor of . For the following year, we have a number TUVs leaving the country according to the same criterion 4. This implies a population decrease given by . In general, we can write a recurrent formula for the upscaling factor associated to criterion ():
| (2) |
where the first year corresponds to with , as stated before. Applying these calculations for a given criterion , we obtain an upscaling factor per year. These factors are the inverse of the population fraction tweeting with geolocation during the corresponding year and, with all the needed cautions on possible biases, one can assume that for criterion one TUV leaving the country represents actual migrants. Measuring the TUVs detected abroad in and upscaling the flows according to the first exit year, we obtain the numbers shown in Table 2 and in Figure 1.
| Year | ||||
|---|---|---|---|---|
| 2015 | 106 K | 129 K | 134 K | 157.5 K |
| 2016 | 110 K | 132 K | 137 K | 159.5 K |
| 2017 | 82 K | 98 K | 100 K | 116 K |
| 2018 | 51 K | 60 K | 62 K | 71 K |
Validation of external flows
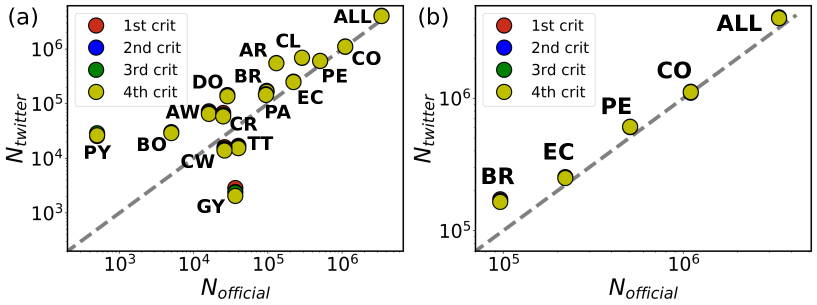
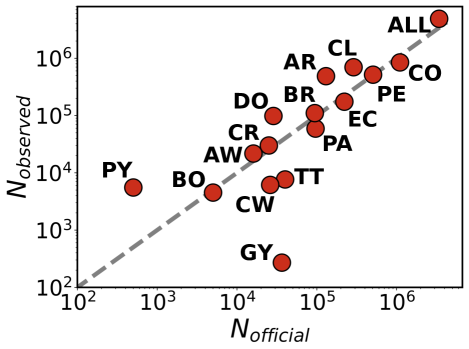
We are interested in estimating the number of Venezuelan migrants in each country because these are the numbers reflected in the statistics of entries and registers, and constitute the basis for the records used by national and international authorities. Note that the official sources are highly heterogeneous in nature and vary from country to country. For this purpose, we count for each year the number of TUVs appearing for the first time in a different country and determine the migrant flows by upscaling as discussed before. Some of the TUVs can be passing through and continue the travel to third countries, where in turn, they will be counted as well. The comparison of the flows obtained in Table 2 with the numbers provided by the international and national agencies shows a good alignment with our estimation. An impression further confirmed in Figure 1 for the UNHCR data in most of the countries in the area with over . The main outlier in the Table 2 is Brazil, where the IOM and UNHCR give values well below our estimations. However, the Federal Police of Brazil registered a total number of entries over from January 2017 until December 2018 (even though half of them end up returning to Venezuela pfb2018 ). Our numbers lay within the range provided by the different sources of information. Given the similarity across the upscaled flows obtained with the different criteria, we continued our analysis with criterion 4, which provides the largest statistics.
Migration routes
| 2018 | |||||
|---|---|---|---|---|---|
| Data(1st) | 168K | 589K | 247K | 1,080K | 3,970K |
| Data(2nd) | 163K | 588K | 242K | 1,070K | 3,920K |
| Data(3rd) | 163K | 593K | 246K | 1,090K | 3,960K |
| Data(4th) | 160K | 590K | 243K | 1,080K | 3,920K |
| IOM Sep18 | 75K | 414K | 209K | 935K | 2,600K |
| UNHCR Nov18 | 85K | 500K | 220K | 1,000K | 3,000K |
| UNHCR Jan19 | 96K | 506K | 221K | 1,100K | 3,400K |
| PFB Dec18 | 199K | – | – | – | – |
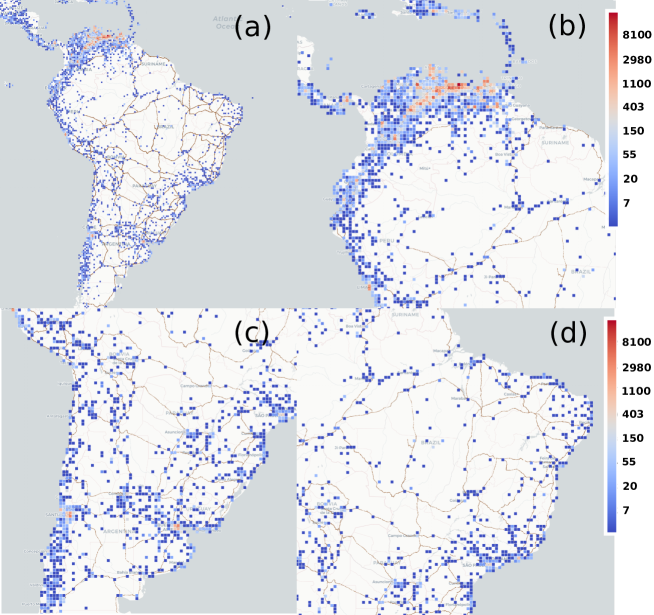
Beyond flow estimations, it is important to identify the preferred routes taken by migrants in order to better provide targeted humanitarian assistance. As mentioned, we took as geographical basis a grid of cells of km side covering the full South American continent, the Caribbean and part of Center America. We counted the cumulative number of TUVs posting messages in each cell. The number of distinct TUVs in the whole period (2015-2018) is plotted as a heat map in Fig. 2. The densest areas are located in Venezuela, specifically near Caracas. The relevant users for the analysis are those classified as residents (TUV) and who have been detected abroad. The beginning of most of their trips are in Venezuela and the density matches population distribution. Once in other countries, the routes concentrate also in the large cities like Buenos Aires, Santiago, São Paulo, Rio de Janeiro and Lima (which can be temporary stops or travel destinations) and around the principal roads and rivers. For example, following a preferred route from Venezuela to Manaus, a split occurs: some TUVs take the ferry navigating the Amazon to the Brazilian city of Belem and subsequently travel along the coast to the cities of Fortaleza and Salvador; while other TUVs travel from Manaus through the forest via the BR-319 highway towards the border with Peru and Bolivia. Overall, the preferred migration route in South America is the Pan-American highway, passing through Colombia, Ecuador, Peru and all the way to Chile and Argentina. Other minor routes are also detected, such as the one from La Paz in Bolivia to Cordoba in Argentina.
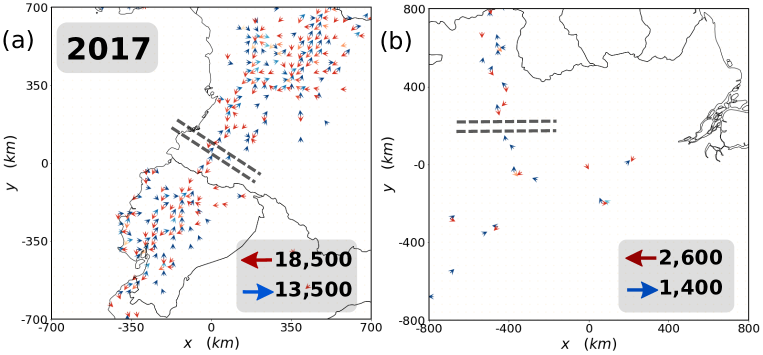
To better understand the potential application of our method, we built a vector representation in each cell. For every TUV tweeting from the cell, we built a unit vector pointing from the present location to the cell with the consecutive tweet with the condition that it must be closer than km to exclude as much as possible air traveling and noise coming from infrequent users. We separated the unit vectors in those pointing towards or away from Venezuela, and we added those in every cell in each category. The resulting outgoing vectors are displayed in red in Figure 3, while the in-going ones are in blue. These maps provide information on the main ground exiting routes from Venezuela and also on the total flow observed in both directions. To go further, we can establish a line intersecting the routes (center of the parallel dashed lines in Figure 3) and consider the upscaled number of TUVs to calculate the number of people crossing the line per year and the direction they are going. The results for 2017 are shown in the right-bottom corner of the maps, while the information collected year by year is included in Table 3. It is important to note that the numbers are relatively small. This is due to the fact that we need to see two consecutive tweets: one above and another below the line to identify a user. However, not all TUVs have these two tweets, as some may travel directly from Venezuela by plane or simply do not tweet so often during their trips. These numbers are, therefore, underestimations although they are proportional to the total flow. We would need to further upscale them according to the fraction of TUVs active enough to be detected on both sides of the lines. Without further processing, we can, nevertheless, compare results obtained on the same route year by year and between routes with the same methodology. In Table 3, we observe a clear domain of the outflows over the inflows to Venezuela. In the Pan-American highway, there is an important grow in the flows year by year, almost doubling in the last period between 2017 and 2018. The route entering in Roraima has, in turn, a flow that is close to a factor below the Pan-American one, with an initial increase until 2017 followed by a strong decline in the following year.
| Year | 2015 | 2016 | 2017 | 2018 | |
|---|---|---|---|---|---|
| Pan-American road | away () | 6,550 | 11,300 | 18,500 | 36,200 |
| toward () | 5,500 | 9,300 | 13,500 | 23,700 | |
| Roraima | away () | 1,200 | 1,490 | 2,600 | 1,070 |
| toward () | 1,200 | 1,300 | 1,400 | 720 |
Recurrence
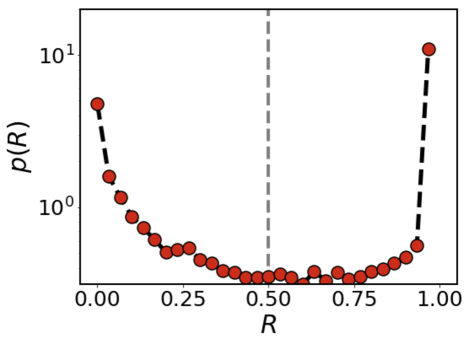
Note that of the migrant TUVs travel back and forth from Venezuela (recurrent travelers) as we will show below, while the remaining stay most of the time abroad. To estimate the time spent in a location, we take the following convention: the time between consecutive tweets is assigned to the location of the first one. Applied to countries, this allows us to define the cumulative time spent abroad for each TUV after his/her first travel to other country, . Additionally, we can calculate the time span between the first tweet abroad and the last tweet of the user, . In this way, we define a ratio between the time spent abroad and the total after the first exit from Venezuela for each TUV, . There is a wide range of behaviors as can be seen in the distribution of Figure 4. TUVs detected abroad for the first time in their last tweet are not considered. Note that the precision is limited by the heterogeneity in the user inter-event time distribution and the total time window that we are able to analyze. Some TUVs correspond the canonical view of migrants, leaving the country and coming back only seldom, while others go back and forth. More recent migrant TUVs may be classified as not recurrent, even though they might be correctly classified if observed for longer time periods. Even so, we need to establish a criterion to discern between frequent returners and those staying mostly abroad. The distribution of shows two clear peaks at the extreme values of the domain with a valley in the region between and , so the threshold is set at . Results are similar for other values of the threshold provided that they are in the range . We find TUVs classified as recurrent and as non recurrent.
Recurrent TUVs stay most of the time in Venezuela, so it can be assumed that they still reside somewhere in the country. Similarly, non recurrent individuals are likely to have a residence place abroad. We define as residence place/country the location from which they tweet most in the last month of activity. Out of the non recurrent TUVs, have a place of residence assigned in the geographical area of our analysis out of Venezuela. To upscale these numbers in each of the countries, we apply the same technique as in previous sections, see Eq. (2). The factor is calculated as the ratio between the updated Venezuelan population and the number of TUVs in each year. The number of migrant TUVs in every country is upscaled according to the factor corresponding to their first year of exit. The results per country are shown in Table 4 and compared with the official estimations from international agencies. The numbers of Table 2 refer to entries across the border, a single individual can contribute to more than one country. In contrast, the records in Table 4 assign one country to each migrant and the numbers contain only distinct individuals in the full study area. Our method provides numbers below the official statistics in Brazil, Ecuador and Colombia, while in Peru it is slightly higher. We see that the new settlement places concentrate in Argentina, Chile, Colombia and Peru, while the flows get through other countries such as Brazil but the fraction of migrant fixation is lower. We have performed as well a systematic comparison between the number of Venezuelan residents in each country provided by our method and by that of international agencies. The result is displayed in Figure 5, where one can see an acceptable agreement with a over .
| 2018 | ||||
|---|---|---|---|---|
| Data(4th) | 58K | 504K | 170K | 826K |
| IOM Sep18 | 75K | 414K | 209K | 935K |
| UNHCR Nov18 | 85K | 500K | 220K | 1,000K |
| UNHCR Jan19 | 96K | 506K | 221K | 1,100K |
Spatial integration of migrants
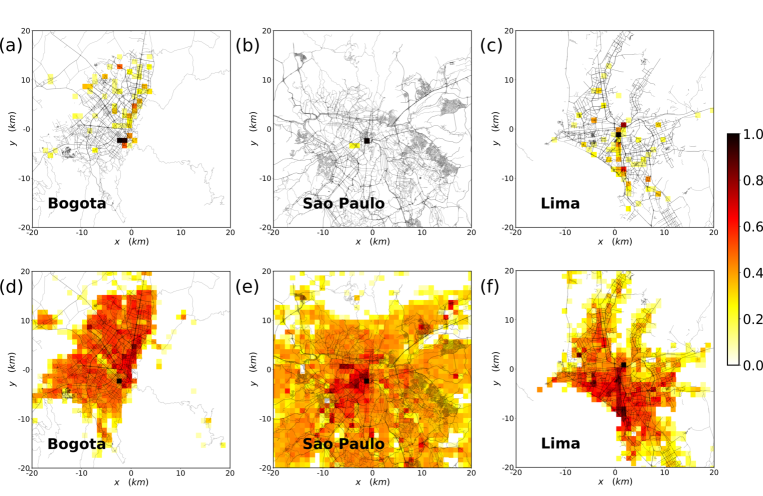
In addition to large-scale numbers, the data also allows for a local study on the place of residence of the migrant population. As example, we look at three of the main cities in South America: Bogotá in Colombia, São Paulo in Brazil and Lima in Peru, where the statistics are more reliable. The urban space is divided in a grid of cells with km2 area where we assign to migrants the most common place from which they tweet during night hours (between 8PM and 8AM local time). The resulting heatmaps are displayed in Fig. 6. Below, we also show the distribution of the local population obtained from local twitter users to have a comparison basis. Besides a visual inspection, we have calculated the segregation index proposed in lamanna2018 called . This metric is the ratio between the entropy of the spatial distribution of the migrant community and that for the local population with a correction to take into account finite size effects. If , both populations are similarly distributed, while smaller indicates segregation. As a complement, we also calculate the normalized mutual information NMI between the distribution of migrants and locals. The NMI is a way to compare the distribution of two variables and it ranges between 0 (the variables are independent) to 1 (they come from the same distribution) mckay2003 . When applied to the former Venezuelan residents, the results are shown in Table 5. All the values of and NMI are low. In these cities, Venezuelan migrants are far from being well integrated from a spatial point of view. There are many causes behind this behavior, ranging from housing prices and availability to the presence of migrant communities from the same country. Moreover, the distribution of locals says nothing on migrants’ residence places. Hence it is not to be considered a proxy for migrant distribution in the three cities. Specifically, in the case of São Paulo, both metrics are very low, although this must be taken with certain caution because only users were detected there against in Bogotá and in Lima.
| Bogotá | Lima | São Paulo | |
|---|---|---|---|
| h | 0.59 | 0.62 | 0.27 |
| NMI | 0.05 | 0.07 | 0.04 |
Temporal distribution of upscaled outflows
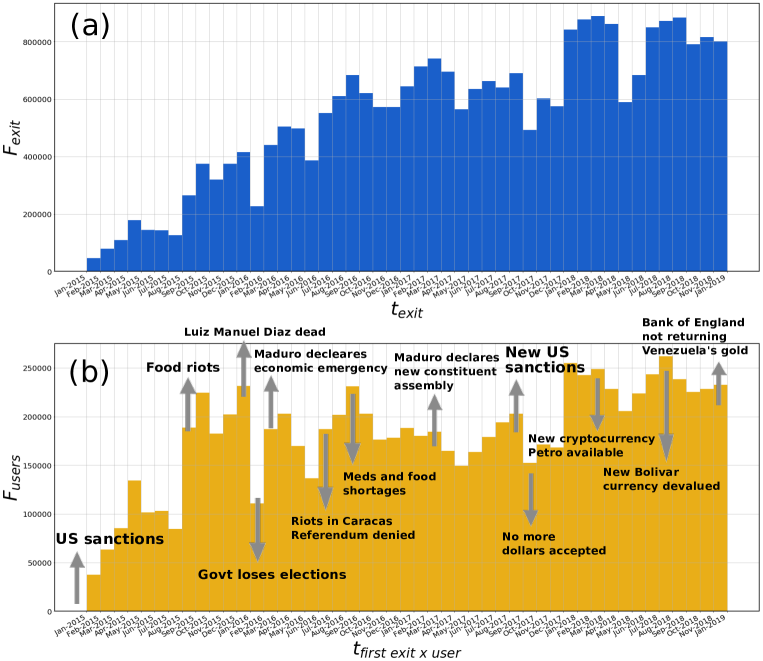
Considering only outflow from Venezuela, we can unfold a time series of the upscaled number of exits per month. The results are shown in Fig.7a. The monthly numbers start to increase in 2015, peaked in late 2016, and increases later until the end of our time window in January 2019. The histogram shows some peaks and valleys that can be correlated with special events during the crisis. This can be seen in the lower panel Fig.7b, where we consider the first exit from Venezuela per TUV. In this version, the impact of the events is more clearly appreciated since they correlate better with outflow. In all cases, we are only showing the upscaled outflows. As discussed for the recurrent TUVs, there exists an inflow that partially compensates the exits.
Discussion
According to five UN agencies, massive gaps in data covering refugees, asylum seekers, migrants and internally displaced populations threaten the lives and wellbeing of millions of children on the move. Through a joint Call to Action call , the agencies confirm the critical need to improve the availability, reliability, timeliness and accessibility of data and evidence to better understand how migration and forcible displacement affect the wellbeing of people. In this work, we have developed a method to contribute to filling these glaring data and knowledge gaps by extracting migrant mobility flows from geolocated Twitter data. We focus on the current crisis in Venezuela, although the method is universal and can be translated to other contexts conditioned only to the data coverage.
With this data, we have obtained estimations of migration flows, which we have validated at country level with official statistics, and added additional information on preferred routes and settlement places. This work has proved useful for humanitarian agencies, such as UNICEF, in better understanding the magnitude of the Venezuelan crisis in a country of continental proportions, such as Brazil, shaping the design of broader interventions beyond the border-crossing in the North of the country. In addition, the method simplicity, coupled with the open availability and pervasiveness of the Twitter data, can bring a new generation of studies to explore migratory crises from a multidisciplinary point of view. Authorities and humanitarian organizations can thus count with this extra data source to implement more informed protocols of response in humanitarian contexts.
List of Abbreviations
The abbreviations included in the main text are:
-
•
UNHCR: United Nations High Commissioner for Refugees;
-
•
IOM: International Organization for Migration;
-
•
UNICEF: United Nations International Children’s Emergency Fund (now, United Nations Children’s Fund);
-
•
NMI: Normalized mutual information;
-
•
TUV: Twitter users classified as Venezuelan residents.
Data and materials
In this work, we use several data sources: Geolocated Twitter, UNHCR, IOM and Federal Police of Brazil. The access links are included as references in the manuscript. In particular, the Twitter API in Ref. API , the UNHCR in Refs. unhcr2018 ; unhcr2019 ; UN70 , the UN population division DESA UNpop , the IOM at iom2018 , the Federal Police of Brazil at pfb2018 and the Venezuelan census censo_ve . For Twitter, the data is downloaded using the streaming API. An updated user guide on the usage of the Twitter streaming API can be found at https://developer.twitter.com/en/docs
Acknownledgments
We thank Riccardo Gallotti and Daniela Paolotti for their useful comments and suggestions. M.M. is funded by the Conselleria d’Innovació, Recerca i Turisme of the Government of the Balearic Islands and the European Social Fund with grant code FPI/2090/2018. A.T. acknowledges financial support from the AEI, Spanish National Research Agency, with grant code PTA2017-13872-I and the Government of the Balearic Islands. M.M., A.T., P.C. and J.J.R. also acknowledge funding from the Spanish Ministry of Science, Innovation and Universities, the AEI and FEDER (EU) under the grant PACSS (RTI2018-093732-B-C22) and the Maria de Maeztu program for Units of Excellence in R&D (MDM-2017-0711).
References
- (1) Jones, D. Conflict resolution: Wars without end. Nature 519, 148 (2015).
- (2) López-Carr, D. and Marter-Kenyon, J. Human adaptation: Manage climate-induced resettlement. Nature 517, 265 (2015).
- (3) Ravenstein, E. G. The laws of migration. Journal of the Statistical Society of London 48, 167–235 (1885).
- (4) Abel, G. J. and Sander, N. Quantifying global international migration flows. Science 343, 1520–1522 (2014).
- (5) Rogers, A., Willekens, F., and Ledent, J. Migration and settlement: a multiregional comparative study. Environment and planning A 15, 1585–1612 (1983).
- (6) Barrat, A., Barthelemy, M., Pastor-Satorras, R., and Vespignani, A. The architecture of complex weighted networks. Proceedings of the National Academy of Sciences of the U.S.A. 101, 3747–3752 (2004).
- (7) Willekens, F., Massey, D., Raymer, J., and Beauchemin, C. International migration under the microscope. Science 352, 897–899 (2016).
- (8) Editorial article. Data on movements of refugees and migrants are flawed. Nature 543, 5–6 (2017).
- (9) Butler, D. What the numbers say about refugees. Nature 543, 22–23 (2017).
- (10) Dijstelbloem, H. Migration tracking is a mess. Nature 543, 32 (2017).
- (11) Barbosa, H., Barthelemy, M., Ghoshal, G., James, C. R., Lenormand, M., Louail, T., Menezes, R., Ramasco, J. J., Simini, F., and Tomasini, M. Human mobility: Models and applications. Physics Reports 734, 1–74 (2018).
- (12) Kang, C., Ma, X., Tong, D., and Liu, Y. Intra-urban human mobility patterns: An urban morphology perspective. Physica A: Statistical Mechanics and its Applications 391(4), 1702–1717 (2012).
- (13) Calabrese, F., Diao, M., Di Lorenzo, G., Ferreira Jr, J., and Ratti, C. Understanding individual mobility patterns from urban sensing data: A mobile phone trace example. Transportation Research Part C: Emerging Technologies 26, 301–313 (2013).
- (14) Louail, T., Lenormand, M., Ros, O. G. C., Picornell, M., Herranz, R., Frias-Martinez, E., Ramasco, J. J., and Barthelemy, M. From mobile phone data to the spatial structure of cities. Scientific Reports 4, 5276 (2014).
- (15) Yang, Y., Tan, C., Liu, Z., Wu, F., and Zhuang, Y. Urban dreams of migrants: A case study of migrant integration in shanghai. In Procs. of The Thirty-Second AAAI Conference on Artificial Intelligence (AAAI-2018). AAAI, (2018).
- (16) Gonzalez, M. C., Hidalgo, C. A., and Barabasi, A.-L. Understanding individual human mobility patterns. Nature 453, 779–782 (2008).
- (17) Krings, G., Calabrese, F., Ratti, C., and Blondel, V. D. Urban gravity: a model for inter-city telecommunication flows. Journal of Statistical Mechanics: Theory and Experiment 2009, L07003 (2009).
- (18) Kung, K. S., Greco, K., Sobolevsky, S., and Ratti, C. Exploring universal patterns in human home-work commuting from mobile phone data. PLoS ONE 9, e96180 (2014).
- (19) Bajardi, P., Delfino, M., Panisson, A., Petri, G., and Tizzoni, M. Unveiling patterns of international communities in a global city using mobile phone data. EPJ Data Science 4, 3 (2015).
- (20) Alfeo, A., Cimino, M. G. C. A., Lepri, B., Pentland, A. S., and Vaglini, G. Assessing refugees’ integration via spatio-temporal similarities of mobility and calling behaviors. IEEE Transactions on Computational Social Systems ( Early Access ) , 1–13 (2019).
- (21) Gallotti, R., Bazzani, A., Rambaldi, S., and Barthelemy, M. A stochastic model of randomly accelerated walkers for human mobility. Nature Communications 7, 12600 (2016).
- (22) Zagheni, E., Weber, I., Gummadi, K., et al. Leveraging facebook’s advertising platform to monitor stocks of migrants. Population and Development Review 43, 721–734 (2017).
- (23) Hawelka, B., Sitko, I., Beinat, E., Sobolevsky, S., Kazakopoulos, P., and Ratti, C. Geo-located twitter as proxy for global mobility patterns. Cartography and Geographic Information Science 41, 260–271 (2014).
- (24) Lenormand, M., Gonçalves, B., Tugores, A., and Ramasco, J. J. Human diffusion and city influence. Journal of The Royal Society Interface 12, 20150473 (2015).
- (25) Dredze, M., García-Herranz, M., Rutherford, A., and Mann, G. Twitter as a source of global mobility patterns for social good. arXiv preprint arXiv:1606.06343 (2016).
- (26) Zagheni, E., Garimella, V. R. K., Weber, I., et al. Inferring international and internal migration patterns from twitter data. In Proceedings of the 23rd International Conference on World Wide Web, 439–444. ACM, (2014).
- (27) Aswad, F. and Menezes, R. Refugee and immigration:twitter as a proxy for reality. In The Thirty-First International Florida Artificial Intelligence Research Society Conference (FLAIRS-31), 17627. AAAI Publications, (2018).
- (28) Hausman, R., Hinz, J., and Yildirim, M. A. Measuring venezuelan emigration with twitter. Technical report, Kiel Working Paper, No. 2106, Kiel Institute for the World Economy (IfW), Kiel, (2018).
- (29) Blanford, J. I., Huang, Z., Savelyev, A., and MacEachren, A. M. Geo-located tweets. Enhancing mobility maps and capturing cross-border movement. PLoS ONE 10, e0129202 (2015).
- (30) Arribas-Bel, D. The spoken postcodes. Regional Studies, Regional Science 2, 458–461 (2015).
- (31) Lamanna, F., Lenormand, M., Salas-Olmedo, M. H., Romanillos, G., Gonçalves, B., and Ramasco, J. J. Immigrant community integration in world cities. PLoS ONE 13, e0191612 (2018).
- (32) Stepanova, E. The role of information communication technologies in the “arab spring”. Ponars Eurasia 15, 1–6 (2011).
- (33) Lenormand, M., Picornell, M., Cantú-Ros, O. G., Tugores, A., Louail, T., Herranz, R., Barthelemy, M., Frias-Martinez, E., and Ramasco, J. J. Cross-checking different sources of mobility information. PLoS One 9, e105184 (2014).
- (34) Mislove, A., Lehmann, S., Ahn, Y.-Y., Onnela, J.-P., and Rosenquist, J. N. Understanding the demographics of twitter users. In Fifth international AAAI conference on weblogs and social media, (2011).
- (35) Bokányi, E., Kondor, D., Dobos, L., Sebők, T., Stéger, J., Csabai, I., and Vattay, G. Race, religion and the city: twitter word frequency patterns reveal dominant demographic dimensions in the United States. Palgrave Communications 2, 16010 (2016).
- (36) Sloan, L. Who tweets in the United Kingdom? profiling the Twitter population using the british social attitudes survey 2015. Social Media & Society 3, 2056305117698981 (2017).
- (37) Lenormand, M., Tugores, A., Colet, P., and Ramasco, J. J. Tweets on the road. PLoS ONE 9, e105407 (2014).
- (38) Mazzoli, M., Molas, A., Bassolas, A., Lenormand, M., Colet, P., and Ramasco, J. J. Field theory for recurrent mobility. in press XX, XX (2019).
- (39) Bilsborrow, R. E., Hugo, G., Oberai, A. S., et al. International migration statistics: Guidelines for improving data collection systems. International Labour Organization, Geneva, Switzerland, (1997).
- (40) United Nations, Economic Commission for Europe, Committee on Environmental Policy. Principles and Recommendations for Population and Housing Censuses, Revision 2. United Nations Publications, Geneva, Switzerland, (2008).
- (41) Hughes, C., Zagheni, E., Abel, G. J., Sorichetta, A., Wiśniowski, A., Weber, I., and Tatem, A. J. Inferring migrations: Traditional methods and new approaches based on mobile phone, social media, and other big data: Feasibility study on inferring (labour) mobility and migration in the european union from big data and social media data. (2016).
- (42) Migration Data Portal, . Migration data sources. https://migrationdataportal.org/themes/migration-data-sources, (2019). Accessed: 2019-07-17.
- (43) UNHCR website, . Number of refugees and migrants from venezuela reaches 3 million. https://www.unhcr.org/news/press/2018/11/5be4192b4/number-refugees-migrants-venezuela-reaches-3-million.html?query=venezuela, (2018). Accessed: 2019-05-20.
- (44) UNHCR website, . R4v américa latina y el caribe, refugiados y migrantes venezolanos en la región - enero 2019. https://data2.unhcr.org/es/documents/details/68070, (2019). Accessed: 2019-05-20.
- (45) IOM website, . Migration trends in the americas. https://www.iom.int/venezuela-migration-trends-americas-september-2018, (2018). Accessed: 2019-05-20.
- (46) Federal Police of Brazil 2018. http://www.casacivil.gov.br/central-de-conteudos/ noticias/2018/dezembro/comite-federal-apresenta-balanco- de-acoes-de-acolhimento-de-venezuelanos, (2018). Accessed: 2019-05-20.
- (47) Cesare, N., Lee, H., McCormick, T., Spiro, E., and Zagheni, E. Promises and pitfalls of using digital traces for demographic research. Demography 55, 1979–1999 (2018).
- (48) Sloan, L. and Morgan, J. Who tweets with their location? understanding the relationship between demographic characteristics and the use of geoservices and geotagging on twitter. PloS one 10, e0142209 (2015).
- (49) Lenormand, M., Louail, T., Cantú-Ros, O. G., Picornell, M., Herranz, R., Arias, J. M., Barthelemy, M., San Miguel, M., and Ramasco, J. J. Influence of sociodemographic characteristics on human mobility. Scientific Reports 5, 10075 (2015).
- (50) Documentation on the Twitter access API. https://developer.twitter.com/en/docs. Accessed: 2019-04-17.
- (51) Joint unhcr-iom press release: Venezuelan outflow continues unabated, stands now at 3.4 million. https://www.unhcr.org/ph/15238-venezuelan-outflow- continues-unabated-stands-now-at-3-4-million.html. Accessed: 2019-05-20.
- (52) Internation Organization for Migration, U. N. Glossary on Migration. IOM, Geneva, Switzerland, (2019). Accessed: 2019-07-17.
- (53) Instituto Nacional de Estadística de Venezuela, . Censo de población y vivienda de venezuela 2011. http://www.redatam.ine.gob.ve/Censo2011/index.html, (2011). Accessed: 2019-05-20.
- (54) United Nations Population Division DESA, . World population prospects 2017. https://population.un.org/wpp/Download/Standard/Population/, (2017). Accessed: 2019-05-20.
- (55) Mackay, D. J. C. Information Theory, Inference and Learning Algorithms. Cambridge University Press, Cambridge, UK, (2003).
- (56) Unicef: A call to action: Protecting children on the move starts with better data. https://data.unicef.org/resources/call-action-protecting -children-move-starts-better-data/. Accessed: 2019-05-20.