Prevalence of neutral gas in centres of merging galaxiesII: nuclear H i and multi-wavelength properties
Abstract
Using a sample of 38 radio-loud galaxy mergers at , we confirm the high detection rate (84%) of H i 21-cm absorption in mergers, which is significantly higher (4 times) than in non-mergers. The distributions of the H i column density [(H i)] and velocity shift of the absorption with respect to the systemic redshift of the galaxy hosting the radio source in mergers are significantly different from that in non-mergers. We investigate the connection of the nuclear H i gas with various multi-wavelength properties of the mergers. While the inferred (H i) and gas kinematics do not show strong (i.e. level) correlation with galaxy properties, we find that the incidence and (H i) of absorption tend to be slightly higher at smaller projected separations between the galaxy pairs and among the lower stellar mass-radio galaxies. The incidence, (H i) and line width of H i absorption increase from the pre-merger to the post-merger stages. The 100% detection rate in post-mergers indicates that the neutral gas in the circumnuclear regions survives the coalescence period and is not yet quenched by the nuclear radio activity.
keywords:
galaxies: active galaxies: interactions quasars: absorption lines.1 Introduction
Galaxy mergers not only distort the morphology of the interacting galaxies, but as suggested by observations and predicted by simulations, they can have strong influence on the physical properties of the galaxies, e.g. enhancement in star formation, triggering of Active Galactic Nuclei (AGNs), and dilution of central metallicities (Kewley et al., 2006; Di Matteo et al., 2007; Cox et al., 2008; Ellison et al., 2008; Ellison et al., 2019; Scudder et al., 2012; Torrey et al., 2012; Satyapal et al., 2014; Moreno et al., 2015; Weston et al., 2017; Bustamante et al., 2018). However, untill recently, how the merging process impacts the physical conditions of different gas phases in the galaxies was not well-explored. In a recent study, Ellison et al. (2018), using H i 21-cm emission, have found that the atomic gas fractions in post-mergers are elevated compared to isolated galaxies, while Pan et al. (2018) and Violino et al. (2018) have found evidence for enhanced molecular gas fractions in galaxy pairs using CO emission. On the other hand, recent high-resolution (parsec-scale) simulation of the multi-phase interstellar medium in galaxy pairs shows that interactions elevate the cold-dense (300 K; 10 cm-3) gas mass in galaxies by 18% (Moreno et al., 2019). This gas mass remains elevated during the galaxy-pair period, i.e. for few Gyrs between the first and second pericentric passages. It is thus now the opportune time to investigate observationally the cold gas properties in different merger stages and test predictions that are becoming available from statistical studies using state-of-the-art simulations.
While the atomic and molecular gas has been mapped in some individual merging galaxies (e.g. Hibbard & van Gorkom, 1996; Tacconi et al., 1999), statistical studies of the cold gas in galaxy pairs and mergers have typically focused on the average gas properties (like gas mass and fraction) derived using single dish radio observations (e.g. Ellison et al., 2015, 2018). Simulations of mergers, however, predict concentration of stars and gas in centres of galaxies resulting from tidal torques (e.g. Mihos & Hernquist, 1996; Blumenthal & Barnes, 2018). Observations of the gas in the inner regions of galaxy mergers are, hence, very relevant to understand gas kinematics and metallicity in the nuclear regions and fueling of nuclear activity. High spatial resolution interferometric observations of absorption against different radio emitting components in mergers provide an effective way of studying the cold gas within the central kilo-parsec regions (e.g. Srianand et al., 2015). The H i 21-cm absorption line has long been used to probe the neutral gas in radio-loud AGNs (van Gorkom et al., 1989). In particular, it has been used to trace gas infalling and feeding the central super-massive black hole, as well as negative feedback in the form of outflows/winds driven by the central starbursts or AGNs (e.g. Vermeulen et al., 2003; Gupta et al., 2006; Morganti et al., 2009; Schulz et al., 2018).
There have been H i 21-cm absorption searches in local () luminous infrared galaxies (LIRGs; Mirabel & Sanders, 1988) and ultra-luminous infrared galaxies (ULIRGs; Teng et al., 2013), which are usually associated with gas-rich mergers (Sanders & Mirabel, 1996). However, these searches were conducted with single dish radio observations. Hence, the spatial resolution was not sufficient to study the radio emission and H i gas in the central kilo-parsec regions of these galaxies, and the absorption may be blended with emission in these spectra as well. These studies were also not conducted on samples selected specifically as mergers with strong radio-loud emission at their centres. Using radio interferometric observations of H i 21-cm absorption, we have recently conducted a pilot study of neutral gas in the central regions of a sample of galaxy mergers hosting radio-loud AGNs at (Dutta et al., 2018, hereafter D18). In this work, we expand our sample of radio-loud mergers with new H i 21-cm absorption measurements. Further, we connect the properties of the neutral gas in centres of mergers with their optical, infrared and radio properties, and trace the evolution of neutral gas through different merger stages. We describe the sample and observations in Section 2. The results are presented and discussed in Section 3. We summarize our conclusions in Section 4. We adopt a flat -cold dark matter cosmology with = 70 km s-1 Mpc-1 and = 0.30 throughout this work.
2 Sample & Observations
2.1 Sample
We cross-matched visually-identified galaxy mergers (see Darg et al., 2011; Barcos-Muñoz et al., 2017; Satyapal et al., 2017; Weston et al., 2017; Fu et al., 2018) at spectroscopic 0.2 in the Sloan Digital Sky Survey (SDSS; York et al., 2000) with radio sources in the Faint Images of the Radio Sky at Twenty-Centimeters (FIRST; resolution5′′; White et al., 1997) and the NRAO VLA Sky Survey (NVSS; resolution45′′; Condon et al., 1998). We thus identified 45 mergers showing radio emission with flux density greater than 20 mJy at 1.4 GHz. The identification of mergers is carried out in the same way as explained in D18. We list here the selection criteria for visually identifying mergers in the SDSS images (i) single galaxy with disturbed central morphology and/or tails; (ii) single galaxy with double nuclei and/or tails; (iii) pair of interacting galaxies that show signatures of tidal disturbances.
In D18 we had studied a sub-sample of 10 mergers from the above sample, with flux density greater than 50 mJy at 1.4 GHz. Here we expand our sample with H i 21-cm observations of 9 mergers with flux density 20-50 mJy at 1.4 GHz. For 19 mergers from the above sample, H i 21-cm observations are available in the literature (see table 5 of D18). Hence, the sample used here for statistical analysis comprises 38 mergers, i.e. 84% of the above mentioned sample of 0.2 radio-loud mergers.
From the available multi-wavelength data, we estimated various properties for the full sample (see Table 1). The stellar mass, , is computed from SDSS photometry and the kcorrect algorithm (v_4.2) by Blanton & Roweis (2007) (see for details Dutta et al., 2017). The total infrared luminosity, , is obtained using either Infrared Astronomical Satellite (IRAS) flux densities at 12, 25, 60 and 100 (Moshir et al., 1990) following Sanders & Mirabel (1996), or AKARI flux densities at 90 and 140 (Kawada et al., 2007) following Takeuchi et al. (2010). The star formation rate (SFR) is taken from the MPA-JHU SDSS DR7 spectroscopic catalog (Brinchmann et al., 2004; Salim et al., 2007). The spectral index (; ) is taken from the catalog of de Gasperin et al. (2018), obtained from the 147 MHz TIFR GMRT Sky Survey (TGSS) and 1.4 GHz NVSS fluxes.
The median properties of the merger sample are: = 0.04, projected separation, = 6 kpc, radio power at 1.4 GHz, = W Hz-1, = 0.48, = M⊙, = L⊙, and SFR = 1 M⊙ yr-1. Note that we consider here only the parameters of the strong radio source whenever spatially resolved data of multiple objects in a merger are available. In 85% cases, the strong radio source has higher . For the 20 pairs where estimation is possible for both the galaxies, 80% are major-mergers with mass ratio 1:4. The mass ratios are provided in Table 1. The galaxy pairs have typical line-of-sight velocity separation km s-1, with median of 100 km s-1. 72% of the mergers are LIRGs ( = L⊙) and 25% are ULIRGs ( L⊙). Based on BPT diagram (Baldwin et al., 1981) for 31 of the mergers with emission line measurements from SDSS spectra, 52% of them can be classified as AGNs, 39% as Composite and 9% as star-forming. However, based on the radio power, all the sources can be classified as radio-loud AGNs. Based on SDSS colour-magnitude relation (Weinmann et al., 2006), 58% of the mergers are blue, 21% are red, and 21% are mixed (i.e. pair of blue and red galaxies).
To classify objects into different merger stages, we adapt from the six-stage merger classification scheme of the Great Observatories All-Sky LIRG Survey (Haan et al., 2011). We combine classes 1 and 2 of this scheme as the pre-merger stage (separate galaxies with symmetric disks or asymmetric disks and/or tidal tails), classes 3 and 4 as the ongoing merger stage (two distinct nuclei in a common envelope or double nuclei with tidal tails), and classes 5 and 6 as the post-merger stage (single/obscured nucleus with long prominent tails or disturbed central morphology and short faint tails). There are 13, 12 and 13 mergers in the pre-merger, ongoing merger and post-merger stages, respectively. The classification stage of each merger is also listed in Table 1.
2.2 Observations
We obtained the redshifted H i 21-cm line observations of the nine new mergers using the Giant Metrewave Radio Telescope (GMRT) between October 2018 and March 2019. The observations were conducted using the L-band receivers and the GMRT Software Backend. A spectral set-up of 16 MHz baseband bandwidth split into 512 channels was used, which resulted in a velocity resolution of 7 km s-1 and a coverage of 3600-3700 km s-1. Each source was observed for 2.5-3 h. In addition, standard calibrators were regularly observed for flux density, bandpass, and gain calibrations. The data were acquired in parallel hand correlations. The data reduction was carried out in Astronomical Image Processing System (aips)111aips is produced and maintained by the National Radio Astronomy Observatory, a facility of the National Science Foundation operated under cooperative agreement by Associated Universities, Inc. following standard procedures (Dutta et al., 2016, D18).
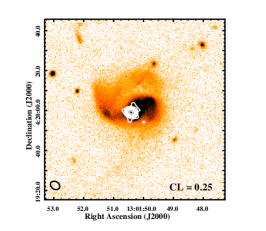
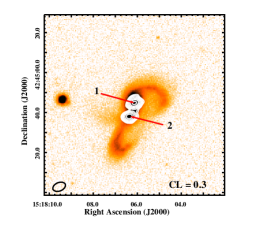
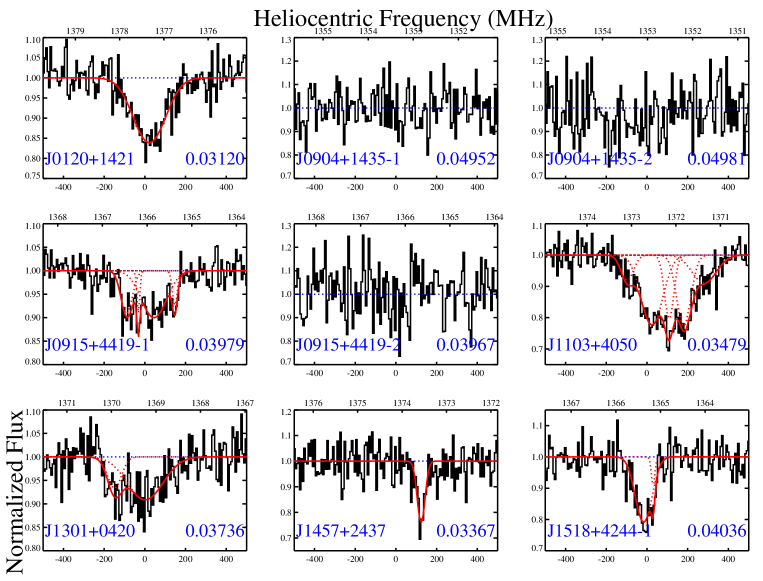
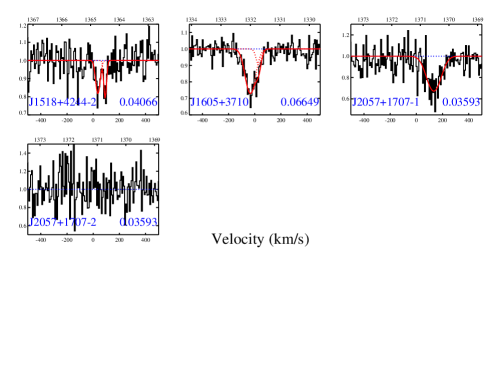
The GMRT 1.4 GHz continuum images (resolution 2-3′′) recover 80-100% of the total flux of the radio sources obtained in FIRST or NVSS. The 1.4 GHz continuum contours are overlaid on SDSS images of the mergers in Fig. 1. Four of the mergers show two radio continuum peaks. Absorption is detected from 8 out of 9 mergers. Properties of the H i absorption spectra are listed in Table 2. The spectra along with the Gaussian fits to the absorption are shown in Fig. 2. The spectra are extracted towards the radio continuum peaks. The parameters from Gaussian fits to the lines are given in Table 3.
3 Results & Discussion
3.1 Incidence, (H i) and kinematics of H i gas
Our new observations reveal 8 new H i 21-cm absorption detections out of the 9 mergers observed. For the full sample of mergers, the detection rate of H i 21-cm absorption is % (i.e. 32/38). Note that we consider only absorption towards the strongest radio continuum peak associated with the merger. We obtained a reference sample of 229 non-mergers (i.e. those that do not satisfy the merger selection criteria listed in Section 2.1) from the study of associated H i absorption in radio galaxies presented in Maccagni et al. (2017). The detection rate in the non-merger sample is %, i.e. four times lower than in the merger sample. Next, we estimate the detection rates in the merger and non-merger sample by imposing different (H i) or () sensitivity limits (for spin temperature, Ts = 100 K, and covering factor, = 1). As can be seen from Table 1, the excess of incidence of H i absorption in mergers compared to non-mergers increases by a factor of 4 to 38 as we go for higher (H i) sensitivity limits, implying that mergers show higher (H i) on average.
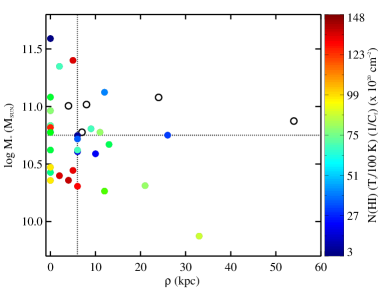
This is confirmed by the fact that the (H i) distribution of mergers and non-mergers are significantly different. A two-sided Kolmogorov-Smirnov test shows maximum deviation between the two cumulative distributions of = 0.6, and probability of finding the difference by chance is = . Mergers give rise to stronger absorption on average and have median (H i) five times higher than non-mergers (see Fig. 1). In addition, we find that the distribution of the velocity shift () between the H i absorption components and the systemic redshift of the galaxies hosting the radio sources is different from that in non-mergers ( = 0.3, = ). Mergers show three times more redshifted (i.e. infalling) absorption than non-mergers (Fig. 1). The fraction of components with km s-1 is % in mergers compared to % in non-mergers. We do not find any significant difference in the velocity widths (full width at half optical depth; FWHM) of the absorption in mergers and non-mergers ( = 0.2, = 0.3). Results from the comparison of H i absorption properties between the samples of mergers and non-mergers are given in Table 2.
Finally, to confirm the above differences, we create a mass- and redshift-matched reference sample of non-mergers from Maccagni et al. (2017). In a sub-sample of 24 mergers, for each merger we randomly select a source from the non-merger sample with H i 21-cm detection, that is within 0.5 dex in and 0.1 in redshift, and repeat this 100 times. The resulting matched samples also have similar distributions of (median = 0.3, = 0.1). We find that the (H i) and distributions in the matched samples are significantly different as well (see Table 2). This indicates that the differences in H i properties of the merger sample from the non-merger sample are not driven by differences in stellar mass, but rather are likely to be driven by the merging process feeding the central regions with large quantities of neutral hydrogen gas.
| (H i) sensitivity | Incidence of H i absorption | |
|---|---|---|
| (Ts K)()(cm-2) | Mergers | Non-mergers |
| All | 84 15% | 23 3% |
| 94 17% | 26 6% | |
| 89 16% | 18 3% | |
| 76 17% | 2 1% | |
| H i property | All | Mass-matched | ||
|---|---|---|---|---|
| (1) | (2) | (3) | (4) | (5) |
| (H i) | 0.62 | 0.70 | ||
| FWHM | 0.19 | 0.32 | 0.32 | 0.13 |
| 0.33 | 0.50 | |||
Notes. Column 1: H i absorption property whose distributions in mergers and non-mergers are compared in a two-sided Kolmogorov-Smirnov (KS) test. Columns 2 and 4: maximum deviation between the two cumulative distribution functions. Columns 3 and 5: probability of finding the difference by chance.


3.2 Implication of non-detections
The only non-detection in the new sample presented here is towards the complex merger J09041435 consisting of three galaxies (see Fig. 1). The radio emission is resolved in the GMRT map, with the strongest continuum peak having 14% of the total flux and not coinciding with any optical nuclei. Lack of absorption in this case could be related to the radio sightline not probing the nuclear region and absence of H i gas in the region probed between the merging galaxies. Among the mergers presented here and in D18, there are four cases (J09154419, J11001002, J13156207 and J15184244), where the optical nuclei of both the interacting galaxies (with 6-20 kpc) are co-spatial with radio emission in GMRT maps (see Fig. 1 and figure 1 in D18). Absorption is detected towards only the stronger radio emission in three of them. From upper limit towards the weaker radio source obtained by integrating over the velocity range of absorption detected towards the stronger source, we find that the H i optical depth towards the stronger source is higher by times. In case of the merger J15184244, absorption is detected towards both the radio sources, but the stronger radio source shows two times higher integrated optical depth. Three of these mergers also have higher SFR and dust depletion in the regions showing stronger radio emission, indicating a possible physical connection between the presence of H i gas, starburst and nuclear radio activity. However, we note that there is no clear connection between the H i gas and other properties like stellar mass for these four mergers, e.g. in two cases the stronger radio source showing higher H i optical depth has the higher stellar mass of the galaxy pair and it is vice-versa for the other two.
3.3 H i gas and merger properties
We checked the dependence of the incidence of H i absorption on various properties of the mergers as listed in Table 1. We find that the incidence of H i is higher at smaller projected separations, i.e. 92% at kpc vis-à-vis 71% at higher . Detections tend to be higher in the more advanced stages of merger. Further, the incidence is higher at smaller stellar masses, i.e. 100% at M⊙ vis-à-vis 72% at higher . The non-detections in high stellar mass-mergers are usually associated with red elliptical galaxies. In addition, we find that the incidence is higher at lower redshifts (95% at compared to 72% at ), and for flatter spectral index sources (94% at compared to 71% at steeper ). The dependence on spectral index could indicate higher incidence among sources with more compact radio emission, that is better suited to detect gas in absorption (Gupta et al., 2006).
We do not find any significant dependence of incidence on radio power, infrared luminosity, SFR and nebular emission line ratios. Majority (97%) of the mergers in our sample are LIRGs or ULIRGs, which have been observed to show high incidence of H i absorption. Using single dish observations, Teng et al. (2013) have found 100% incidence of H i absorption in nine ULIRGs, while Mirabel & Sanders (1988) have found that the incidence increases with far-infrared luminosity, from 40% for L⊙ to 100% for L⊙ in a sample of eighty galaxies. Three and eight of the mergers in our full sample are also present in the sample studied by Teng et al. (2013) and Mirabel & Sanders (1988), respectively. Though as noted in Section 1, these samples were selected on the basis of infrared luminosity, without the constraints on morphology and radio continuum flux as in our merger sample. We do not find a significant difference in the incidence between LIRGs (83%) and ULIRGs (88%) in our sample. Though we note that our sample has three times less ULIRGs compared to LIRGs, and a larger sample is required to check if the incidence of nuclear H i gas increases with the infrared luminosity.
Next, we carry out correlation analysis between properties of the H i gas ((H i), FWHM and ) and those of the mergers using non-parametric Kendall’s test (see Table 3). We do not find any significant correlation (i.e. ) of the properties of H i with those of the mergers. This once again confirms that the merger-induced gas accretion is the main driver behind the high detection rate of H i 21-cm absorption. However, the fact that there is no strong relation between the galaxy and absorption properties tells us that it is not straightforward to connect the central gas accumulation we infer based on H i 21-cm absorption with the triggering or quenching of nuclear star formation.
We show in Fig. 2, (H i) measured for the mergers as a function of , and , i.e. the parameters with which (H i) shows tentative () anti-correlation. Increase in (H i) with decreasing redshift could indicate the presence of more gas-rich mergers at lower redshifts. However, we note that the sample lacks low stellar mass systems at high redshifts, likely due to selection bias. Hence, the dependence of (H i) on redshift could be driven by its dependence on stellar mass. We have checked that except redshift and stellar mass, no other galaxy properties are correlated with each other.
Here we focus on the tentative dependences of (H i) on stellar mass and projected separation. Exploring the parameter space of merger properties considered here, we find that majority of the large (H i) absorption occur at smaller values of and (see Fig. 3). We note that in the non-merger reference sample considered here, we do not find any trend of (H i) or detection rate with . Therefore, the trend of higher incidence and higher (H i) at lower in the merger sample could imply a physical connection between the merger type and the H i cross-section. Majority (71%) of the lower mass mergers (i.e. below the median ) are blue in colour, while only 40% of the higher mass mergers are blue. Hence, the dependence of (H i) on could be due to higher concentration of H i gas in centres of wet or gas-rich mergers. However, this may also reflect the general trend of increasing detection rate of H i emission and atomic gas fraction with decreasing stellar mass observed in both isolated and post-merger galaxies (Catinella et al., 2018; Ellison et al., 2018).
We notice that most (94%) of the mergers with kpc (that show higher detection rate) are in the ongoing or post-merger stages. This motivated us to look at the evolution of H i properties along the merger sequence. The properties of H i gas in different merger stages are listed in Fig. 4, which shows a typical example of a merger from our sample in each of the stages. The incidence, (H i) and FWHM of H i absorption increases from non-merger through post-merger stages, with 100% detection in post-mergers. The fraction Red(RedBlue), defined as the number of redshifted components ( 100 km s-1) divided by the total number of redshifted and blueshifted ( 100 km s-1) components, is highest among ongoing mergers. All these are consistent with more gas flow to the central regions during different merger stages. While the contrast between the non-merger and merger samples are statistically significant (as discussed in Section 3.1), the differences among the three merger stages themselves are not statistically significant based on two-sided KS-tests. However, these results do point towards widespread presence of H i gas with infall signatures throughout the merger process.
It is particularly interesting to note that large amount of cold H i gas survives in centres of all post-mergers. This could result out of combination of the circumnuclear gas in the progenitor galaxies as well as the merger channeling gas to the central regions. This leads to the conclusion that the nuclear radio activity has not yet quenched or driven away the neutral gas in the circumnuclear regions in the recently coalesced or post-merger stage (i.e. within a Gyr of coalescence, e.g. Lotz et al., 2008). It is possible that depletion of neutral gas due to either nuclear winds/radio jets as predicted by simulations (Di Matteo et al., 2005) or condensation into molecular phase and consequently stars is yet to take place. On the other hand, nuclear accretion and/or cooling of ionized gas into neutral gas are possibly still ongoing in the centres of these post-mergers.
The 100% detection rate of H i absorption and high values of (H i) that we find in post-mergers is consistent with the results of Ellison et al. (2018). They find higher (factor of 1.5) detection rate of H i emission as well as atomic gas fraction (factor of 3) in post-mergers compared to a control sample of isolated galaxies matched in stellar mass. Thus the merger process leads to increase in both the concentration of nuclear H i gas as well as the overall neutral gas fraction in post-mergers. Based on a revised picture of the merger process, Ellison et al. (2018) rule out a ‘blowout’ phase in the merger-driven sequence of galaxy evolution (Hopkins et al., 2008). Our results support this and indicate that the circumnuclear H i gas probably survives till the ‘quasar’ phase in this evolutionary picture. This is further corroborated by the results of Teng et al. (2013), who find 100% incidence of H i absorption in coalesced ULIRGs compared to 60% in far-infrared-weak quasars. In addition, while only 25% of the post-mergers in Ellison et al. (2018) are classified as optical AGNs, all our post-mergers host radio-loud AGNs at their centres. This implies that the AGN activity in the post-merger stage has not yet consumed or expelled the H i gas fed to the nuclear regions by the merger, which could also have triggered it in the first place.
| Parameter | (H i) | FWHM | ||||||||||||
|---|---|---|---|---|---|---|---|---|---|---|---|---|---|---|
| (1) | (2) | (3) | (4) | (5) | (6) | (7) | (8) | (9) | (10) | (11) | (12) | (13) | ||
| 38 | 0.19 | 0.10 | 1.7 | 32 | 0.16 | 0.20 | 1.3 | 32 | 0.03 | 0.82 | 0.2 | |||
| 38 | 0.21 | 0.06 | 1.9 | 32 | 0.20 | 0.11 | 1.6 | 32 | 0.16 | 0.20 | 1.3 | |||
| 38 | 0.11 | 0.36 | 0.9 | 32 | 0.03 | 0.83 | 0.2 | 32 | 0.13 | 0.30 | 1.0 | |||
| 33 | 0.04 | 0.76 | 0.3 | 27 | 0.05 | 0.72 | 0.4 | 27 | 0.26 | 0.05 | 1.9 | |||
| 35 | 0.28 | 0.02 | 2.4 | 30 | 0.02 | 0.86 | 0.2 | 30 | 0.15 | 0.26 | 1.1 | |||
| 32 | 0.01 | 1.00 | 0.1 | 27 | 0.26 | 0.05 | 1.9 | 27 | 0.06 | 0.68 | 0.4 | |||
| SFR | 31 | 0.12 | 0.37 | 0.9 | 26 | 0.07 | 0.60 | 0.5 | 26 | 0.26 | 0.06 | 1.9 | ||
Column 1: property of merger with which correlation of (H i), FWHM and of the absorption is tested. Columns 2, 6, 10: number of measurements included in test. Columns 3, 7, 11: Kendall rank correlation coefficient. Columns 4, 8, 12: probability of correlation arising by chance. Columns 5, 9, 13: significance of correlation assuming Gaussian statistics. Upper limits of (H i) are considered as censored data points during survival analysis with cenken function in NADA package in R. Tentative correlations are marked in bold.


4 Conclusion
We have presented a study of H i 21-cm absorbing gas in central regions of 38 radio-loud galaxy mergers. We confirm that the merger sample, in comparison to a reference sample of non-merging radio galaxies, show higher: (i) incidence of H i 21-cm absorption by a factor of 4, (ii) (H i) by a factor of 5, and (iii) infall signature, in the form of redshifted absorption with respect to the systemic redshift, by a factor of 3. These differences persist in the redshift- and stellar mass-matched samples of mergers and non-mergers as well.
We further analyze the dependence of the incidence, (H i) and kinematics of the nuclear H i gas in mergers on different optical, infrared and radio properties of the mergers, as well as the evolution of the nuclear H i gas along the merger sequence. We do not find any significant () correlation of the H i absorption properties with the global properties of the mergers. From comparison with stellar mass-matched reference sample of non-mergers and lack of strong dependence of H i gas on any properties of the galaxies, we conclude that the merging process is likely to be the dominant factor behind the prevalence of high (H i) absorption with signature of infall among mergers. We do find tentative trend of increasing incidence and (H i) with decreasing stellar mass and projected separation. This could be due to presence of more H i gas in central regions of blue gas-rich mergers and in later stages of mergers.
We find increasing trend of incidence, (H i) and velocity width from the pre-merger to the post-merger stages, though the
differences in H i gas properties between the merger stages are not statistically significant. The results presented here
could imply evolution in the H i gas properties as the merger progresses, which is relevant to explore further with larger
samples of mergers. Higher spatial resolution resolved spectroscopy is also crucial to establish the connection of the H i gas with nuclear starburst and radio activity.
ACKNOWLEDGEMENTS
We thank the anonymous reviewer for their constructive comments.
RD acknowledges support from the Alexander von Humboldt Foundation.
We thank the staff at GMRT for their help during the observations.
GMRT is run by the National Centre for Radio Astrophysics of the Tata Institute of Fundamental Research.
Funding for SDSS-III has been provided by the Alfred P. Sloan Foundation, the Participating Institutions, the National Science Foundation, and the U.S. Department of Energy Office of Science. The SDSS-III web site is http://www.sdss3.org/. SDSS-III is managed by the Astrophysical Research Consortium for the Participating Institutions of the SDSS-III Collaboration including the University of Arizona, the Brazilian Participation Group, Brookhaven National Laboratory, Carnegie Mellon University, University of Florida, the French Participation Group, the German Participation Group, Harvard University, the Instituto de Astrofisica de Canarias, the Michigan State/Notre Dame/JINA Participation Group, Johns Hopkins University, Lawrence Berkeley National Laboratory, Max Planck Institute for Astrophysics, Max Planck Institute for Extraterrestrial Physics, New Mexico State University, New York University, Ohio State University, Pennsylvania State University, University of Portsmouth, Princeton University, the Spanish Participation Group, University of Tokyo, University of Utah, Vanderbilt University, University of Virginia, University of Washington, and Yale University.
References
- Baan et al. (2007) Baan W. A., Hagiwara Y., Hofner P., 2007, ApJ, 661, 173
- Baldwin et al. (1981) Baldwin J. A., Phillips M. M., Terlevich R., 1981, PASP, 93, 5
- Barcos-Muñoz et al. (2017) Barcos-Muñoz L., et al., 2017, ApJ, 843, 117
- Blanton & Roweis (2007) Blanton M. R., Roweis S., 2007, AJ, 133, 734
- Blumenthal & Barnes (2018) Blumenthal K. A., Barnes J. E., 2018, MNRAS, 479, 3952
- Brinchmann et al. (2004) Brinchmann J., Charlot S., White S. D. M., Tremonti C., Kauffmann G., Heckman T., Brinkmann J., 2004, MNRAS, 351, 1151
- Bustamante et al. (2018) Bustamante S., Sparre M., Springel V., Grand R. J. J., 2018, MNRAS, 479, 3381
- Carilli et al. (1998) Carilli C. L., Wrobel J. M., Ulvestad J. S., 1998, AJ, 115, 928
- Catinella et al. (2018) Catinella B., et al., 2018, MNRAS, 476, 875
- Chandola et al. (2011) Chandola Y., Sirothia S. K., Saikia D. J., 2011, MNRAS, 418, 1787
- Chandola et al. (2012) Chandola Y., Sirothia S. K., Saikia D. J., Gupta N., 2012, Bulletin of the Astronomical Society of India, 40, 139
- Condon et al. (1998) Condon J. J., Cotton W. D., Greisen E. W., Yin Q. F., Perley R. A., Taylor G. B., Broderick J. J., 1998, AJ, 115, 1693
- Cox et al. (2008) Cox T. J., Jonsson P., Somerville R. S., Primack J. R., Dekel A., 2008, MNRAS, 384, 386
- Darg et al. (2011) Darg D. W., Kaviraj S., Lintott C. J., Schawinski K., Silk J., Lynn S., Bamford S., Nichol R. C., 2011, MNRAS, 416, 1745
- Di Matteo et al. (2005) Di Matteo T., Springel V., Hernquist L., 2005, Nature, 433, 604
- Di Matteo et al. (2007) Di Matteo P., Combes F., Melchior A.-L., Semelin B., 2007, A&A, 468, 61
- Dickey (1986) Dickey J. M., 1986, ApJ, 300, 190
- Dutta et al. (2016) Dutta R., Gupta N., Srianand R., O’Meara J. M., 2016, MNRAS, 456, 4209
- Dutta et al. (2017) Dutta R., Srianand R., Gupta N., Momjian E., Noterdaeme P., Petitjean P., Rahmani H., 2017, MNRAS, 465, 588
- Dutta et al. (2018) Dutta R., Srianand R., Gupta N., 2018, MNRAS, 480, 947
- Ellison et al. (2008) Ellison S. L., Patton D. R., Simard L., McConnachie A. W., 2008, AJ, 135, 1877
- Ellison et al. (2015) Ellison S. L., Fertig D., Rosenberg J. L., Nair P., Simard L., Torrey P., Patton D. R., 2015, MNRAS, 448, 221
- Ellison et al. (2018) Ellison S. L., Catinella B., Cortese L., 2018, MNRAS, 478, 3447
- Ellison et al. (2019) Ellison S. L., Viswanathan A., Patton D. R., Bottrell C., McConnachie A. W., Gwyn S., Cuillandre J.-C., 2019, MNRAS, p. 1374
- Fu et al. (2018) Fu H., et al., 2018, ApJ, 856, 93
- Gallimore et al. (1999) Gallimore J. F., Baum S. A., O’Dea C. P., Pedlar A., Brinks E., 1999, ApJ, 524, 684
- Geréb et al. (2015) Geréb K., Maccagni F. M., Morganti R., Oosterloo T. A., 2015, A&A, 575, A44
- Gupta et al. (2006) Gupta N., Salter C. J., Saikia D. J., Ghosh T., Jeyakumar S., 2006, MNRAS, 373, 972
- Haan et al. (2011) Haan S., et al., 2011, AJ, 141, 100
- Hibbard & van Gorkom (1996) Hibbard J. E., van Gorkom J. H., 1996, AJ, 111, 655
- Hopkins et al. (2008) Hopkins P. F., Hernquist L., Cox T. J., Kereš D., 2008, ApJS, 175, 356
- Kawada et al. (2007) Kawada M., et al., 2007, PASJ, 59, S389
- Kewley et al. (2006) Kewley L. J., Geller M. J., Barton E. J., 2006, AJ, 131, 2004
- Lotz et al. (2008) Lotz J. M., Jonsson P., Cox T. J., Primack J. R., 2008, MNRAS, 391, 1137
- Maccagni et al. (2017) Maccagni F. M., Morganti R., Oosterloo T. A., Geréb K., Maddox N., 2017, A&A, 604, A43
- Mihos & Hernquist (1996) Mihos J. C., Hernquist L., 1996, ApJ, 464, 641
- Mirabel & Sanders (1988) Mirabel I. F., Sanders D. B., 1988, ApJ, 335, 104
- Moreno et al. (2015) Moreno J., Torrey P., Ellison S. L., Patton D. R., Bluck A. F. L., Bansal G., Hernquist L., 2015, MNRAS, 448, 1107
- Moreno et al. (2019) Moreno J., et al., 2019, MNRAS, 485, 1320
- Morganti et al. (2009) Morganti R., Peck A. B., Oosterloo T. A., van Moorsel G., Capetti A., Fanti R., Parma P., de Ruiter H. R., 2009, A&A, 505, 559
- Moshir et al. (1990) Moshir M., et al., 1990, in Bulletin of the American Astronomical Society. p. 1325
- Mundell et al. (2001) Mundell C. G., Ferruit P., Pedlar A., 2001, ApJ, 560, 168
- Pan et al. (2018) Pan H.-A., et al., 2018, ApJ, 868, 132
- Salim et al. (2007) Salim S., et al., 2007, ApJS, 173, 267
- Sanders & Mirabel (1996) Sanders D. B., Mirabel I. F., 1996, ARA&A, 34, 749
- Satyapal et al. (2014) Satyapal S., Ellison S. L., McAlpine W., Hickox R. C., Patton D. R., Mendel J. T., 2014, MNRAS, 441, 1297
- Satyapal et al. (2017) Satyapal S., et al., 2017, ApJ, 848, 126
- Schulz et al. (2018) Schulz R., Morganti R., Nyland K., Paragi Z., Mahony E. K., Oosterloo T., 2018, A&A, 617, A38
- Scudder et al. (2012) Scudder J. M., Ellison S. L., Torrey P., Patton D. R., Mendel J. T., 2012, MNRAS, 426, 549
- Srianand et al. (2015) Srianand R., Gupta N., Momjian E., Vivek M., 2015, MNRAS, 451, 917
- Tacconi et al. (1999) Tacconi L. J., Genzel R., Tecza M., Gallimore J. F., Downes D., Scoville N. Z., 1999, ApJ, 524, 732
- Takeuchi et al. (2010) Takeuchi T. T., Buat V., Heinis S., Giovannoli E., Yuan F.-T., Iglesias-Páramo J., Murata K. L., Burgarella D., 2010, A&A, 514, A4
- Teng et al. (2013) Teng S. H., Veilleux S., Baker A. J., 2013, ApJ, 765, 95
- Torrey et al. (2012) Torrey P., Cox T. J., Kewley L., Hernquist L., 2012, ApJ, 746, 108
- Vermeulen et al. (2003) Vermeulen R. C., et al., 2003, A&A, 404, 861
- Violino et al. (2018) Violino G., Ellison S. L., Sargent M., Coppin K. E. K., Scudder J. M., Mendel T. J., Saintonge A., 2018, MNRAS, 476, 2591
- Weinmann et al. (2006) Weinmann S. M., van den Bosch F. C., Yang X., Mo H. J., 2006, MNRAS, 366, 2
- Weston et al. (2017) Weston M. E., McIntosh D. H., Brodwin M., Mann J., Cooper A., McConnell A., Nielsen J. L., 2017, MNRAS, 464, 3882
- White et al. (1997) White R. L., Becker R. H., Helfand D. J., Gregg M. D., 1997, ApJ, 475, 479
- York et al. (2000) York D. G., et al., 2000, AJ, 120, 1579
- de Gasperin et al. (2018) de Gasperin F., Intema H. T., Frail D. A., 2018, MNRAS, 474, 5008
- van Gorkom et al. (1989) van Gorkom J. H., Knapp G. R., Ekers R. D., Ekers D. D., Laing R. A., Polk K. S., 1989, AJ, 97, 708
Appendix A Properties of the full sample of mergers
| Coordinates | log | log | log | SFR | Stage | (H i) | FWHM | Ref. | |||||
| (J2000) | ratio | ||||||||||||
| (kpc) | (W | (M⊙) | (L⊙) | (M⊙ | ( | (km s-1) | (km s-1) | ||||||
| Hz-1) | yr-1) | cm-2) | |||||||||||
| (1) | (2) | (3) | (4) | (5) | (6) | (7) | (8) | (9) | (10) | (11) | (12) | (13) | (14) |
| 00:54:03.99 73:05:05.40 | 0.01570 | 5 | 22.70 | 0.53 | — | — | 11.48 | — | pr | 37 | 183 | 84 | 1 |
| 01:20:02.72 14:21:42.94 | 0.03120 | 33 | 22.96 | 0.29 | 9.87 | 2.7 | 11.73 | 5.799 | pr | 60 | 191 | 5 | 2 |
| 08:38:24.01 25:45:16.28 | 0.01818 | 0 | 22.83 | 0.24 | 10.36 | — | 11.58 | 0.300 | po | 67 | 108 | 64 | 3 |
| 09:04:34.99 14:35:38.18 | 0.04952 | 7 | 23.45 | 0.74 | 10.78 | 3.5 | 11.84 | 6.605 | on | 7 | — | — | 2 |
| 09:15:55.51 44:19:58.00 | 0.03979 | 9 | 23.06 | 0.22 | 10.81 | 1.6 | 11.65 | 1.628 | on | 47 | 258 | 34 | 2 |
| 09:35:51.59 61:21:11.33 | 0.03939 | 0 | 23.70 | 0.28 | 10.96 | — | 12.01 | 0.298 | po | 54 | 536 | 78 | 4 |
| 09:42:21.98 06:23:35.23 | 0.12368 | 5 | 24.62 | — | 10.44 | — | — | — | on | 91 | 75 | 0 | 5 |
| 09:45:42.05 14:19:34.98 | 0.00771 | 28 | 22.48 | 0.63 | — | — | 10.47 | — | pr | 57 | 95 | 18 | 6 |
| 10:36:31.96 02:21:45.89 | 0.04990 | 2 | 24.00 | 0.64 | 10.40 | — | 12.08 | 2.688 | po | 92 | 289 | 6 | 1 |
| 10:53:27.25 20:58:35.92 | 0.05264 | 6 | 23.72 | 0.12 | 10.75 | 1.6 | — | 0.112 | pr | 5 | 156 | 58 | 4 |
| 11:00:17.98 10:02:56.84 | 0.03624 | 13 | 23.59 | 0.40 | 10.67 | 0.7 | 11.43 | 0.568 | pr | 121 | 61 | 49 | 1 |
| 11:03:53.95 40:50:59.91 | 0.03479 | 12 | 22.94 | 0.38 | 10.26 | 23 | 11.61 | 0.786 | pr | 148 | 270 | 107 | 2 |
| 11:08:26.51 10:15:21.70 | 0.02730 | 6 | 23.72 | 0.58 | — | — | — | — | pr | 6 | — | — | 1 |
| 11:28:33.41 58:33:46.20 | 0.01046 | 4 | 22.62 | 0.59 | 10.36 | 1.6 | 11.79 | 0.004 | on | 94 | 88 | 165 | 3 |
| 12:14:18.25 29:31:46.70 | 0.06326 | 8 | 23.93 | 0.50 | 11.02 | 21 | 11.41 | 0.243 | on | 2 | — | — | 1 |
| 12:56:14.22 56:52:25.27 | 0.04217 | 0 | 23.99 | 0.38 | 10.78 | — | 12.56 | — | po | 29 | 179 | 0 | 7 |
| 13:01:25.26 29:18:49.53 | 0.02340 | 10 | 22.68 | 0.22 | 10.59 | 0.3 | 11.31 | 0.952 | on | 15 | 148 | 54 | 8 |
| 13:01:50.29 04:20:00.54 | 0.03736 | 0 | 22.96 | 0.57 | 10.84 | — | 11.76 | 0.629 | po | 49 | 299 | 3 | 2 |
| 13:15:35.10 62:07:28.43 | 0.03083 | 21 | 23.02 | 0.35 | 10.31 | 0.8 | 11.75 | 5.374 | on | 55 | 291 | 93 | 1 |
| 13:20:35.40 34:08:21.75 | 0.02306 | 0 | 23.12 | 0.30 | 10.43 | — | 11.67 | 0.924 | po | 113 | 197 | 73 | 1 |
| 13:34:55.94 13:44:31.74 | 0.02312 | 12 | 22.59 | 0.07 | 11.12 | 14 | — | 0.053 | pr | 29 | 130 | 101 | 8 |
| 13:38:17.27 48:16:32.20 | 0.02758 | 6 | 22.78 | 0.68 | 10.61 | 1.0 | 11.54 | 2.015 | on | 13 | 140 | 176 | 8 |
| 13:44:42.16 55:53:13.53 | 0.03734 | 0 | 23.59 | 0.48 | 10.82 | — | 12.19 | 4.778 | po | 86 | 570 | 85 | 4 |
| 13:47:33.36 12:17:24.27 | 0.12047 | 0 | 26.26 | 0.18 | 11.59 | — | 12.41 | 0.188 | po | 3 | 135 | 45 | 9 |
| 13:56:02.63 18:22:17.68 | 0.05036 | 4 | 24.40 | 0.77 | 11.01 | — | 11.82 | 9.223 | on | 1 | — | — | 1 |
| 13:56:46.12 10:26:09.09 | 0.12313 | 2 | 24.50 | — | 11.35 | — | 12.29 | 8.464 | po | 47 | 108 | 148 | 1 |
| 14:41:04.37 53:20:08.74 | 0.10502 | 54 | 24.03 | 0.74 | 10.87 | 2.3 | 12.22 | 7.004 | pr | 5 | — | — | 8 |
| 14:57:00.68 24:37:03.55 | 0.03367 | 26 | 23.24 | 0.69 | 10.75 | 1.7 | 11.68 | 6.256 | pr | 22 | 44 | 118 | 2 |
| 15:08:05.59 34:23:22.87 | 0.04557 | 0 | 23.77 | 0.25 | 10.62 | — | 11.58 | 0.040 | po | 125 | 102 | 178 | 10 |
| 15:18:06.13 42:44:45.01 | 0.04036 | 6 | 23.30 | 0.57 | 10.62 | 1.7 | 11.92 | 14.726 | on | 47 | 143 | 2 | 2 |
| 15:31:43.46 24:04:19.17 | 0.09646 | 5 | 23.75 | — | 11.40 | 79 | 11.51 | 1.039 | on | 92 | 33 | 235 | 11 |
| 15:34:57.20 23:30:13.24 | 0.01840 | 0 | 23.35 | 0.15 | 10.77 | — | 12.19 | 0.639 | po | 132 | 238 | 32 | 12 |
| 16:04:26.51 17:44:31.17 | 0.04089 | 24 | 23.43 | 0.18 | 11.08 | 1.0 | 11.17 | 0.045 | pr | 3 | — | — | 4 |
| 16:05:43.25 37:10:45.03 | 0.06649 | 0 | 23.37 | 0.56 | 10.47 | — | 11.75 | 4.467 | po | 67 | 81 | 32 | 2 |
| 16:38:03.65 26:43:30.62 | 0.06521 | 6 | 23.54 | — | 10.72 | 1.4 | — | 0.008 | pr | 25 | 111 | 96 | 8 |
| 16:52:58.89 02:24:03.11 | 0.02448 | 0 | 23.72 | 0.72 | 11.08 | — | 11.86 | — | po | 128 | 348 | 43 | 13 |
| 20:54:49.61 00:41:53.07 | 0.20276 | 11 | 25.64 | — | 10.78 | 3.8 | — | 0.962 | pr | 55 | 60 | 92 | 1 |
| 20:57:23.90 17:07:39.00 | 0.03593 | 6 | 22.74 | 0.67 | 10.31 | 3.3 | 11.95 | — | on | 89 | 100 | 144 | 2 |
Notes. Column 1: source coordinates. Column 2: systemic redshift of galaxy hosting the radio source, from optical emission lines. Column 3: projected separation between two merging galaxies. Zero separation indicates only single nuclei is discernible in SDSS images. Column 4: radio power based on FIRST 1.4 GHz fluxes. Column 5: spectral index from TGSS 147 MHz and NVSS 1.4 GHz fluxes. Column 6: stellar mass from SDSS photometry using kcorrect. Column 7: stellar mass ratio for galaxy pairs (where the galaxy with the stronger radio emission is in the numerator). Column 8: total infrared luminosity () from IRAS or AKARI. Column 9: SFR from MPA-JHU SDSS DR7 spectroscopic catalog. Column 10: merger stage ‘pr’: pre-merger, ‘on’: ongoing, ‘po’: post-merger. Column 11: (H i) (3 upper limit per 100 km s-1) of detections (non-detections), for Ts = 100 K and = 1. Column 12: full width at half the optical depth of the absorption. Column 13: velocity shift between systemic redshift and peak optical depth of H i absorption. Column 14: references for H i 21-cm absorption 1: D18; 2: this work; 3: Dickey (1986); 4: Geréb et al. (2015); 5: Srianand et al. (2015); 6: Gallimore et al. (1999); 7: Carilli et al. (1998); 8: Maccagni et al. (2017); 9: Gupta et al. (2006); 10: Chandola et al. (2011); 11: Chandola et al. (2012); 12: Mundell et al. (2001); 13: Baan et al. (2007)
Appendix B Details of the new sample of mergers


| Source | Peak | Total | Spectral | (H i) | |||||
| 1.4 GHz | 1.4 GHz | rms | (Ts K) | ||||||
| Flux | Flux | () | |||||||
| Density | Density | ||||||||
| (mJy beam-1) | (mJy) | (mJy beam-1) | (km s-1) | ( cm-2) | (km s-1) | (km s-1) | |||
| (1) | (2) | (3) | (4) | (5) | (6) | (7) | (8) | (9) | (10) |
| J01201421 | 0.03120 | 33 | 41 | 1.1 | 0.24 0.03 | 33 2 | 60 3 | 241 4 | 5 10 |
| J09041435-1 | 0.04952 | 13 | 49 | 1.0 | 0.08 | 4 | 7 | — | — |
| J09041435-2 | 0.04981 | 10 | 45 | 1.0 | 0.10 | 8 | 14 | — | — |
| J09154419-1 | 0.03979 | 18 | 22 | 0.5 | 0.16 0.03 | 26 1 | 47 3 | 265 13 | 34 11 |
| J09154419-2 | 0.03967 | 5 | 9 | 0.5 | 0.09 | 8 | 14 | — | — |
| J11034050 | 0.03479 | 26 | 31 | 1.0 | 0.37 0.04 | 81 2 | 148 4 | 370 22 | 107 14 |
| J13010420 | 0.03736 | 22 | 28 | 0.8 | 0.17 0.04 | 27 2 | 49 8 | 335 14 | 3 11 |
| J14572437 | 0.03367 | 16 | 66 | 1.0 | 0.36 0.06 | 12 2 | 22 3 | 57 1 | 118 10 |
| J15184244-1 | 0.04036 | 26 | 33 | 1.2 | 0.28 0.05 | 26 2 | 47 3 | 143 4 | 2 10 |
| J15184244-2 | 0.04066 | 15 | 20 | 1.1 | 0.31 0.07 | 14 2 | 26 4 | 86 2 | 33 10 |
| J16053710 | 0.06649 | 22 | 22 | 1.1 | 0.44 0.05 | 37 2 | 67 4 | 154 6 | 32 10 |
| J20571707-1 | 0.03593 | 9 | 19 | 1.0 | 0.74 0.11 | 49 4 | 89 8 | 157 2 | 144 10 |
| J20571707-2 | 0.03593 | 5 | 10 | 0.9 | 0.19 | 13 | 23 | — | — |
Notes. Column 1: galaxy merger name. In case of multiple continuum peaks, we number them, starting with 1 for the strongest. Column 2: systemic redshift of galaxy hosting the radio source. Column 3: peak 1.4 GHz flux density. Column 4: total 1.4 GHz flux density. Column 5: spectral rms (at resolution of km s-1). Column 6: peak optical depth (1 upper limit) of detections (non-detections). Column 7: integrated optical depth (3 upper limit for 100 km s-1 linewidth) of detections (non-detections). Column 8: (H i) (3 upper limit) of detections (non-detections). Column 9: velocity width which contains 90% of the total optical depth for detections. Column 10: velocity shift between systemic redshift and velocity of peak optical depth for detections. Positive (negative) sign indicates redshifted (blueshifted) absorption.
| Source | FWHM | ||
|---|---|---|---|
| (km s-1) | |||
| (1) | (2) | (3) | (4) |
| J01201421 | 0.03128 0.00001 | 181 3 | 0.18 0.01 |
| J09154419-1 | 0.03948 0.00001 | 65 5 | 0.10 0.02 |
| 0.03968 0.00001 | 17 2 | 0.09 0.03 | |
| 0.03995 0.00001 | 143 11 | 0.11 0.02 | |
| 0.04030 0.00001 | 28 4 | 0.08 0.02 | |
| J13010420 | 0.03685 0.00001 | 79 8 | 0.07 0.02 |
| 0.03737 0.00002 | 203 12 | 0.10 0.01 | |
| J14572437 | 0.03410 0.00001 | 44 1 | 0.27 0.01 |
| J15184244-1 | 0.04021 0.00001 | 93 2 | 0.23 0.01 |
| 0.04037 0.00001 | 19 3 | 0.10 0.03 | |
| J15184244-2 | 0.04049 0.00001 | 39 1 | 0.20 0.01 |
| 0.04106 0.00001 | 24 1 | 0.23 0.02 | |
| J16053710 | 0.04062 0.00001 | 90 3 | 0.32 0.02 |
| 0.06660 0.00001 | 46 5 | 0.10 0.03 | |
| J11034050 | 0.06615 0.00001 | 72 7 | 0.08 0.02 |
| 0.03487 0.00001 | 121 9 | 0.25 0.04 | |
| 0.03517 0.00001 | 52 4 | 0.23 0.05 | |
| 0.03541 0.00001 | 79 6 | 0.26 0.05 | |
| 0.03576 0.00004 | 137 17 | 0.09 0.03 | |
| J20571707-1 | 0.03525 0.00001 | 122 1 | 0.40 0.01 |
Notes. Column 1: galaxy merger name as listed in Table 2. Column 2: redshift of component. Column 3: full-width-at-half-maximum of component. Column 4: peak optical depth of component.