Components of the Diffuse Ultraviolet Radiation at High Latitudes
Abstract
We have used data from the Galaxy Evolution Explorer to study the different components of the diffuse ultraviolet background in the region between the Galactic latitudes 70° – 80°. We find an offset at zero dust column density (E(B - V) = 0) of photon units in the FUV (1539 Å) and photon units in the NUV (2316 Å). This is approximately half of the total observed radiation with the remainder divided between an extragalactic component of photon units in the FUV and photon units in the NUV and starlight scattered by Galactic dust at high latitudes. The optical constants of the dust grains were found to be a=0.40.1 and g=0.80.1 (FUV) and a=0.40.1 and g=0.50.1 (NUV). We cannot differentiate between a Galactic or extragalactic origin for the zero-offset but can affirm that it is not from any known source.
keywords:
dust, extinction - ISM: clouds - diffuse radiation - ultraviolet: ISM1 Introduction
The diffuse ultraviolet radiation field at the Galactic poles has been assumed to be a combination of diffuse Galactic light from the scattering of starlight by high latitude dust and extragalactic radiation but with the relative contributions unknown (Bowyer, 1991; Henry, 1991). Later observations and a better understanding of the known Galactic and extragalactic components found that they were not sufficient to account for the observed light and that there was a leftover component of 200 – 300 photon units111photons s-1 cm-2 sr-1 Å-1 (Onaka & Kodaira, 1991; Hamden et al., 2013; Henry et al., 2015; Boissier et al., 2015).
Akshaya et al. (2018) used observations from the Galaxy Evolution Explorer (GALEX) in the far ultraviolet (FUV: 1344 – 1786 Å) and the near ultraviolet (NUV: 1771 – 2831 Å) to explore the contributions of the different components at both Galactic poles () in conjunction with a model for the dust scattered light (Murthy, 2016). They found that there was an offset at zero E(B-V) of about 150 photon units in the FUV and 350 photon units in the NUV over and beyond the known extragalactic contributors. The dust scattered light was never more than about 30% of the total signal, even at high column densities. Molecular hydrogen fluorescence kicked in for column densities of greater than log N(H) = 20.2 (where N(H) is the column density in cm-2), significantly lower than the canonical values of log N(H)20.6 (Savage et al., 1977; Franco & Cox, 1986; Reach et al., 1994).
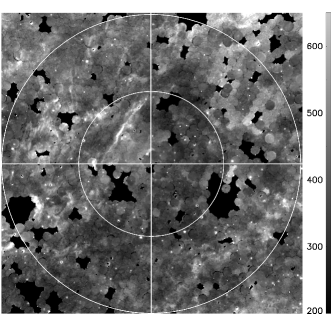
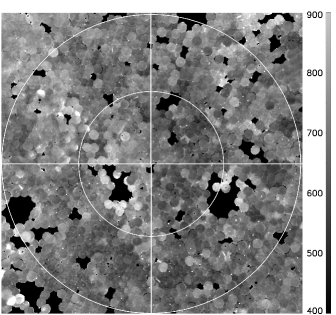
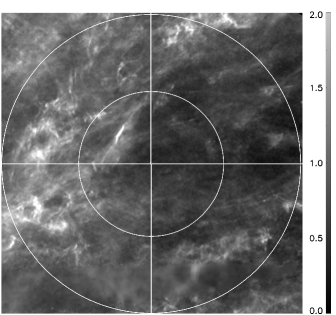
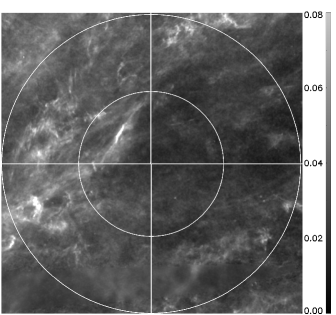
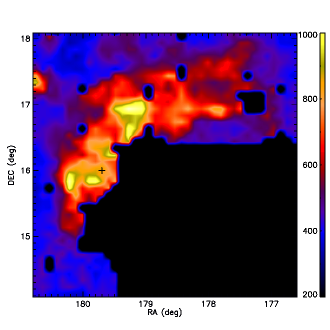
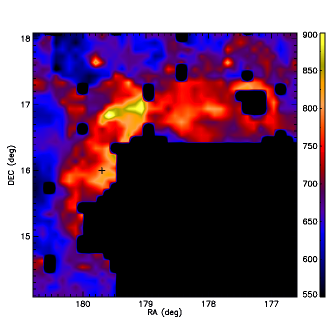
We have chosen to study the region between 70° – 80° in Galactic latitude (Fig. 1). The original motivation was to relook at a cirrus cloud discovered by Haikala et al. (1995) (Fig. 2) using Far Ultraviolet Space Telescope (FAUST: Bowyer et al. (1993)) data. These points occupy a limited range with 100µm values between 1 – 4 MJy sr-1(0.2 < E(B - V) < 0.12 mag) and, based on a suggestion from an anonymous referee, we expanded our area of interest to the entire range between 70 and 80. The Haikala cloud may be seen to be part of much larger complex which includes Markkanen’s Cloud (Markkanen, 1979) near the North Galactic Pole (NGP). Cirrus clouds at high latitudes stand out against the general infrared background at 60 and 100µm (Low et al., 1984). They scatter light from Galactic plane stars (Jura, 1979) and block extragalactic radiation (Mattila et al., 2017; Mattila & Väisänen, 2019). Denser regions of the clouds may contain molecular hydrogen (Weiland et al., 1986; Deul & Burton, 1990), which emits in the FUV (Martin et al., 1990; Hurwitz, 1998). We have decomposed the different components of the diffuse UV radiation through a multi-wavelength analysis of the observed radiation at these latitudes. Although there is still not much interstellar dust at these latitudes, the peak column densities are higher than in the NGP and the effects of Galactic absorption and emission are more readily observed.
2 Data
We have collected archival data on the diffuse emission in this field from the UV to the IR. The UV data are from Murthy (2014) who extracted the diffuse emission in the NUV and FUV bands from GALEX (Martin et al., 2005); the IR data at 100µm from Schlegel et al. (1998) who used the data from the Infrared Astronomy Satellite (IRAS: Neugebauer et al. (1984)) and the Cosmic Background Explorer (COBE: Boggess et al. (1992)) to produce a reprocessed 100µm all sky map; and the dust extinction from the mission (Planck Collaboration et al., 2014). We have placed all the data on a common reference frame with 6′ bins and displayed them in Fig. 1. The cirrus features in this field are distinctly seen in the GALEX FUV, 100µm and E(B-V) maps but not in the NUV, suggesting that dust scattering from the clouds is a small part of the total emission.

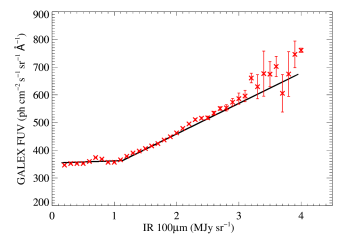
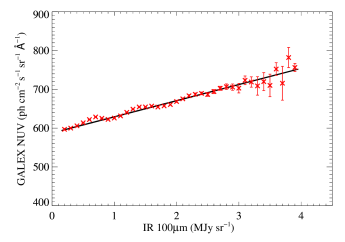
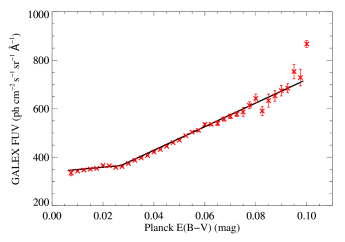
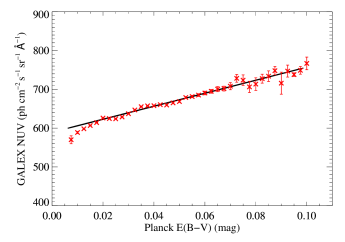
We have plotted the UV observations as a function of the IR and the E(B - V) in Fig. 3 and tabulated the correlations in Table 1. The NUV surface brightness is linearly correlated with both the 100µm and the E(B -V). The FUV surface brightness is also correlated with the IR and the E(B - V) but with an inflection point at MJy sr-1 (0.027 mag in E(B - V)) where the slope increases. This inflection point is also seen in the FUV/NUV ratio (Fig. 4). The UV radiation and the IR are both due to the amount of dust along the line of sight and one might expect them all to be tightly correlated, especially at low column densities where the optical depth is low both in the UV and the IR. The excess radiation in the FUV is most likely due to Lyman band fluorescent emission from molecular hydrogen (Martin et al., 1990; Hurwitz, 1998). The inflection point represents the column density above which self-shielding protects the hydrogen molecules from photodissociation by interstellar UV photons and corresponds to a column density of log N(H) = 20.2. Canonically, this critical column density has been taken as log N(H)20.6 (Savage et al., 1977; Franco & Cox, 1986; Reach et al., 1994) but has been found to be lower in high latitudes cirrus clouds (Gillmon & Shull, 2006; Planck Collaboration et al., 2011), where Gillmon et al. (2006) suggests that H2 formation is more efficient due to compression from dynamical processes at the disk-halo interface.
The intercepts observed represents the surface brightness at zero column density where we would expect no contribution from dust scattering. We will discuss its possible components below but note that they are in agreement with the spectroscopic data of Anderson et al. (1979); Tennyson et al. (1988); Seon et al. (2011) who found similar offsets after correcting for airglow lines in the spectrum.
| Wavelength | r | a | b | |
| FUV–100m (1.13 MJy sr-1) | 0.03 | 7.97 | 353.89 | 0.84 |
| FUV–100m (1.13 MJy sr-1) | 0.46 | 110.35 | 238.20 | 0.70 |
| FUV–E(B-V) ( 0.027 mag) | 0.06 | 942.14 | 339.97 | 0.82 |
| FUV–E(B-V) ( 0.027 mag) | 0.47 | 4871.51 | 233.88 | 0.69 |
| NUV–100m | 0.25 | 41.63 | 587.47 | 0.94 |
| NUV–E(B-V) | 0.27 | 1677.25 | 589.33 | 0.52 |
| NGP∗ | ||||
| FUV–100m (1.08 MJy sr-1) | 0.27 | 57.43 | 288.27 | 1.15 |
| FUV–100m (1.08 MJy sr-1) | 0.57 | 156.33 | 182.10 | 1.37 |
| FUV–E(B-V) | 0.52 | 4245.40 | 250.11 | 1.24 |
| NUV–100m | 0.42 | 68 | 530.89 | 1.18 |
| NUV–E(B-V) | 0.40 | 2655.67 | 531.06 | 1.21 |
| r - Spearman’s correlation coefficient (P 0.05 for all cases) | ||||
| a - Scale factor | ||||
| b - Offset (photon units) | ||||
| ∗ From Akshaya et al. (2018) | ||||
3 Modelling and Results
We have assumed four independent sources for the UV radiation in this field:
-
1.
Extragalactic background light (EBL).
-
2.
Starlight scattered from interstellar dust.
-
3.
Molecular hydrogen fluorescence.
-
4.
Unexplained offset.
We will discuss each of these in the following sections.
3.1 EBL
Akshaya et al. (2018) tabulated the different components of the known EBL:
- •
-
•
16 – 30 photon units from QSOs (Madau, 1992);
-
•
20 photon units from the intergalactic medium (IGM) (Martin et al., 1991);
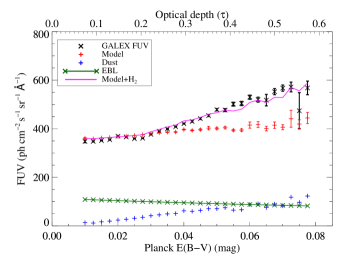
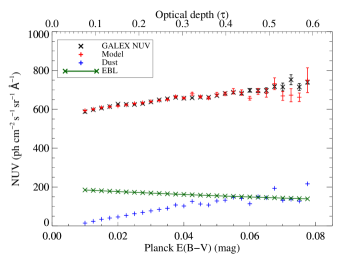
for a total of photon units in the FUV and photon units in the NUV. We have extincted the EBL using the known E(B - V) and accounted for the scattered EBL photons for different values of albedo and phase function asymmetry factor using Mattila (1976). This is shown in Fig. 5 (green line).
| References | Wavelength (Å) | ||
|---|---|---|---|
| Onaka & Kodaira (1991) | 1450–1800 | 0.32 | 0.5 |
| Henry & Murthy (1993) | 1500 | ||
| Witt et al. (1993) | 1000–1600 | 0.420.04 | 0.75 |
| Murthy et al. (1993) | 912–1150 | 0.8 | |
| Gordon et al. (1994) | 1362 | 0.47–0.7 | 0.8 |
| 1769 | 0.55–0.73 | 0.8 | |
| Witt & Petersohn (1994) | 1500 | 0.5 | 0.9 |
| Sasseen & Deharveng (1996) | 1400–1800 | 0.3 | 0.8 |
| Witt et al. (1997) | 1400–1800 | 0.450.05 | 0.680.1 |
| Schiminovich et al. (2001) | 1740 | 0.450.05 | 0.770.1 |
| Burgh et al. (2002) | 900–1400 | 0.2–0.4 | 0.85 |
| Mathis et al. (2002) | 1300 | 0.5 | 0.6–0.85 |
| Shalima & Murthy (2004) | 1100 | 0.40.2 | - |
| Sujatha et al. (2005) | 1100 | 0.40.1 | 0.550.25 |
| Shalima et al. (2006) | 900–1200 | 0.3–0.7 | 0.55–0.85 |
| Lee et al. (2008) | 1370–1670 | 0.360.2 | 0.520.22 |
| Sujatha et al. (2009) | 1350–1750 | 0.4 | 0.7 |
| Puthiyaveettil et al. (2010) | 1400–1900 | 0.6 | 0.8 |
| Sujatha et al. (2010) | 1350–1750 | 0.320.09 | 0.510.19 |
| 1750–2850 | 0.450.08 | 0.560.1 | |
| Jo et al. (2012) | 1350–1750 | 0.420.03 | 0.450.02 |
| Choi et al. (2013) | 1330–1780 | 0.380.06 | 0.460.06 |
| Hamden et al. (2013) | 1344–1786 | 0.620.04 | 0.780.05 |
| Lim et al. (2013) | 1360–1680 | 0.420.05 | 0.2–0.58 |
| Murthy (2016) | 1500 | 0.4 | 0.6 |
| 2300 | 0.4 | 0.6 | |
| Mattila et al. (2018) | 3500 | 0.580.05 | 0.60.1 |
3.2 Dust-scattered Starlight
We have used the same Monte Carlo model for the dust-scattered starlight as did Akshaya et al. (2018). This model is fully described in Murthy (2016) and may be downloaded from Murthy (2015). The model uses the known positions of hot, UV stars from the Hipparcos star catalog (Perryman et al., 1997) with model spectra from Castelli & Kurucz (2003) to predict the number of photons at any position in the Galaxy. The amount and location of the interstellar dust was derived from Schlegel et al. (1998) reddening maps using a scale height of 125pc (Marshall et al., 2006). The stellar photons were scattered from the dust using the Henyey-Greenstein scattering function (Henyey & Greenstein, 1941) and assuming a range of values for albedo () and phase function asymmetry factor ().
We derived the dust scattered light by subtracting the zero-offset (Table 1) and EBL with extinction from the total observed radiation. We then fit this remainder with the model predictions for different values of and for the entire data in NUV and for E(B-V)0.027 in case of FUV. As there is lot of scatter in the model they were compared with the data at a resolution of 12′. We have only considered those bins with more than five data points to compare with the model. We find 1 confidence interval of and in the FUV and and in the NUV using the formulation given by Lampton et al. (1976). These are in agreement with the theoretical predictions of Draine (2003) and various observational estimates (Table 2). The models fit the data well in the NUV but fall short in the FUV for E(B - V) 0.027, where we believe that the fluorescent emission from molecular hydrogen begins to be important.
3.3 Molecular Hydrogen Fluorescence
We have plotted the contributions to the observed data from the EBL, the dust-scattered starlight and the offset in Fig. 5. The NUV data are fit well by the model as are the FUV data for E(B - V) 0.3, corresponding to log N(H) = 20.2, assuming N(H)/E(B-V) = 5.81021 atoms cm-2 mag-1 (Bohlin et al., 1978). We have attributed this excess emission to fluorescence in the Lyman band (1400 – 1700 Å) of molecular hydrogen (Duley & Williams, 1980; Martin et al., 1990; Hurwitz, 1998). The level of this emission averages out to about 100 photon units, consistent with the surface brightness found by Jo et al. (2017). Using the formulation of Martin et al. (1990), we can derive the local gas density in the cloud from our observations assuming a constant value of R = cm3 s-1 for the formation rate of H2 (Fig. 6). Adding this emission to the other components gives the solid line in Fig. 5.

3.4 Offsets
It has long been noted (Henry, 1991; Hamden et al., 2013; Henry et al., 2015) that the diffuse background, particularly at high latitudes, cannot be fully explained by known sources (dust scattered radiation and EBL) without an additional offset at zero column density. Akshaya et al. (2018) found this offset to be (FUV) and (NUV) photon units in the North Galactic Pole and (FUV) and (NUV) photon units in the South Galactic Pole. In this work, we find that the offsets are and photon units in the FUV and NUV, respectively, after subtracting the known EBL. These offsets are slightly higher than those in the polar regions which may be due to uncertainties in the data.
Unfortunately, we cannot distinguish residual airglow from other diffuse sources in our study but other, spectroscopic, studies have found similar offsets at the NGP (Anderson et al., 1979; Tennyson et al., 1988; Seon et al., 2011). Brune et al. (1978) has measured the contribution from the 1356 Å OI line, the only significant contributor in the GALEX FUV band, to be less than 50 photon units. We are therefore confident that the offset is predominantly not due to airglow.
4 Conclusions
We have studied the latitude range between 70° and 80° as a continuation of our characterisation of the diffuse UV sky. This region has a greater amount of nebulosity and hence higher column densities than our earlier study at the Galactic Poles (Akshaya et al., 2018). We confirm the presence of an offset at zero column density (E(B -V) = 0) with a level of photon units in the FUV and photon units in the NUV, slightly higher than in the polar regions (Akshaya et al., 2018). Henry et al. (2015) has suggested that this is due to an unknown Galactic component of the DGL but it may be due to an unidentified EBL component. This may be resolved as we extend our study to lower Galactic latitudes where the dust component is enhanced and the extragalactic component is further extincted.
We find a component due to scattering from interstellar dust rising to a level of about 100 photon units in the FUV and 200 photon units in the NUV, about the same level as the EBL. We were able to set 1 limits on to be 0.40.1 in both FUV and NUV and the limits on were found to be in FUV and in NUV. We find an increase over the dust scattered emission in the FUV for column densities greater than E(B - V) = 0.027 mag (log N(H) = 20.2) which we interpret as molecular hydrogen fluorescent emission in the Lyman band.
Molecular hydrogen fluorescence emission was observed in the NGP by Akshaya et al. (2018) for column densities greater than log N(H)=20.2. We also observe this emission at the same column density for the region 70°GLAT°. Other studies have found a higher value (log N(H) 20.6) for the critical density at which molecular hydrogen can form through self-shielding from the interstellar UV photons (Savage et al., 1977; Franco & Cox, 1986; Reach et al., 1994) but Gillmon et al. (2006) suggest that the critical density is less at high Galactic latitudes.
Acknowledgements
Support for JM has come from proposal EMR/2016/001450 from DST/SERB. We have used the Gnu Data Language (http://gnudatalanguage.sourceforge.net/index.php) for the analysis of these data. The data presented in this paper were obtained from the Mikulski Archive for Space Telescopes (MAST). STScI is operated by the Association of Universities for research in Astronomy, Inc., under the NASA contract NAS5-26555. Support for MAST for non-HST data is provided by the NASA Office of Space Science via grant NNX09AF08G and by other grants and contracts.
References
- Akshaya et al. (2018) Akshaya M. S., Murthy J., Ravichandran S., Henry R. C., Overduin J., 2018, ApJ, 858, 101
- Anderson et al. (1979) Anderson R. C., Henry R. C., Brune W. H., Feldman P. D., Fastie W. G., 1979, ApJ, 234, 415
- Boggess et al. (1992) Boggess N. W., et al., 1992, ApJ, 397, 420
- Bohlin et al. (1978) Bohlin R. C., Savage B. D., Drake J. F., 1978, ApJ, 224, 132
- Boissier et al. (2015) Boissier S., et al., 2015, A&A, 579, A29
- Bowyer (1991) Bowyer S., 1991, ARA&A, 29, 59
- Bowyer et al. (1993) Bowyer S., Sasseen T. P., Lampton M., Wu X., 1993, ApJ, 415, 875
- Brune et al. (1978) Brune W. H., Feldman P. D., Anderson R. C., Fastie W. G., Henry R. C., 1978, Geophys. Res. Lett., 5, 383
- Burgh et al. (2002) Burgh E. B., McCandliss S. R., Feldman P. D., 2002, ApJ, 575, 240
- Castelli & Kurucz (2003) Castelli F., Kurucz R. L., 2003, in Piskunov N., Weiss W. W., Gray D. F., eds, IAU Symposium Vol. 210, Modelling of Stellar Atmospheres. p. A20 (arXiv:astro-ph/0405087)
- Choi et al. (2013) Choi Y.-J., Min K.-W., Seon K.-I., Lim T.-H., Jo Y.-S., Park J.-W., 2013, ApJ, 774, 34
- Deul & Burton (1990) Deul E. R., Burton W. B., 1990, A&A, 230, 153
- Draine (2003) Draine B. T., 2003, ARA&A, 41, 241
- Driver et al. (2016) Driver S. P., et al., 2016, ApJ, 827, 108
- Duley & Williams (1980) Duley W. W., Williams D. A., 1980, ApJ, 242, L179
- Franco & Cox (1986) Franco J., Cox D. P., 1986, PASP, 98, 1076
- Gardner et al. (2000) Gardner J. P., Brown T. M., Ferguson H. C., 2000, ApJ, 542, L79
- Gillmon & Shull (2006) Gillmon K., Shull J. M., 2006, ApJ, 636, 908
- Gillmon et al. (2006) Gillmon K., Shull J. M., Tumlinson J., Danforth C., 2006, ApJ, 636, 891
- Gordon et al. (1994) Gordon K. D., Witt A. N., Carruthers G. R., Christensen S. A., Dohne B. C., 1994, ApJ, 432, 641
- Haikala et al. (1995) Haikala L. K., Mattila K., Bowyer S., Sasseen T. P., Lampton M., Knude J., 1995, ApJ, 443, L33
- Hamden et al. (2013) Hamden E. T., Schiminovich D., Seibert M., 2013, ApJ, 779, 180
- Henry (1991) Henry R. C., 1991, ARA&A, 29, 89
- Henry & Murthy (1993) Henry R. C., Murthy J., 1993, ApJ, 418, L17
- Henry et al. (2015) Henry R. C., Murthy J., Overduin J., Tyler J., 2015, ApJ, 798, 14
- Henyey & Greenstein (1941) Henyey L. G., Greenstein J. L., 1941, ApJ, 93, 70
- Hurwitz (1998) Hurwitz M., 1998, ApJ, 500, L67
- Jo et al. (2012) Jo Y.-S., Min K.-W., Lim T.-H., Seon K.-I., 2012, ApJ, 756, 38
- Jo et al. (2017) Jo Y.-S., Seon K.-I., Min K.-W., Edelstein J., Han W., 2017, ApJS, 231, 21
- Jura (1979) Jura M., 1979, ApJ, 227, 798
- Lampton et al. (1976) Lampton M., Margon B., Bowyer S., 1976, ApJ, 208, 177
- Lee et al. (2008) Lee D.-H., et al., 2008, ApJ, 686, 1155
- Lim et al. (2013) Lim T.-H., Min K.-W., Seon K.-I., 2013, ApJ, 765, 107
- Low et al. (1984) Low F. J., et al., 1984, ApJ, 278, L19
- Madau (1992) Madau P., 1992, ApJ, 389, L1
- Markkanen (1979) Markkanen T., 1979, A&A, 74, 201
- Marshall et al. (2006) Marshall D. J., Robin A. C., Reylé C., Schultheis M., Picaud S., 2006, A&A, 453, 635
- Martin et al. (1990) Martin C., Hurwitz M., Bowyer S., 1990, ApJ, 354, 220
- Martin et al. (1991) Martin C., Hurwitz M., Bowyer S., 1991, ApJ, 379, 549
- Martin et al. (2005) Martin D. C., et al., 2005, ApJ, 619, L1
- Mathis et al. (2002) Mathis J. S., Whitney B. A., Wood K., 2002, ApJ, 574, 812
- Mattila (1976) Mattila K., 1976, A&A, 47, 77
- Mattila & Väisänen (2019) Mattila K., Väisänen P., 2019, arXiv e-prints, p. arXiv:1905.08825
- Mattila et al. (2017) Mattila K., Väisänen P., Lehtinen K., von Appen-Schnur G., Leinert C., 2017, MNRAS, 470, 2152
- Mattila et al. (2018) Mattila K., Haas M., Haikala L. K., Jo Y. S., Lehtinen K., Leinert C., Väisänen P., 2018, A&A, 617, A42
- Murthy (2014) Murthy J., 2014, ApJS, 213, 32
- Murthy (2015) Murthy J., 2015, DiffuseModel: Modeling the diffuse ultraviolet background, Astrophysics Source Code Library (ascl:1512.012)
- Murthy (2016) Murthy J., 2016, MNRAS, 459, 1710
- Murthy et al. (1993) Murthy J., Im M., Henry R. C., Holberg J. B., 1993, ApJ, 419, 739
- Neugebauer et al. (1984) Neugebauer G., et al., 1984, ApJ, 278, L1
- Onaka & Kodaira (1991) Onaka T., Kodaira K., 1991, ApJ, 379, 532
- Perryman et al. (1997) Perryman M. A. C., et al., 1997, A&A, 323, L49
- Planck Collaboration et al. (2011) Planck Collaboration et al., 2011, A&A, 536, A24
- Planck Collaboration et al. (2014) Planck Collaboration et al., 2014, A&A, 571, A11
- Puthiyaveettil et al. (2010) Puthiyaveettil S., Murthy J., Fix J. D., 2010, MNRAS, 408, 53
- Reach et al. (1994) Reach W. T., Koo B.-C., Heiles C., 1994, ApJ, 429, 672
- Sasseen & Deharveng (1996) Sasseen T. P., Deharveng J. M., 1996, ApJ, 469, 691
- Savage et al. (1977) Savage B. D., Bohlin R. C., Drake J. F., Budich W., 1977, ApJ, 216, 291
- Schiminovich et al. (2001) Schiminovich D., Friedman P. G., Martin C., Morrissey P. F., 2001, ApJ, 563, L161
- Schlegel et al. (1998) Schlegel D. J., Finkbeiner D. P., Davis M., 1998, ApJ, 500, 525
- Seon et al. (2011) Seon K.-I., et al., 2011, ApJS, 196, 15
- Shalima & Murthy (2004) Shalima P., Murthy J., 2004, MNRAS, 352, 1319
- Shalima et al. (2006) Shalima P., Sujatha N. V., Murthy J., Henry R. C., Sahnow D. J., 2006, MNRAS, 367, 1686
- Sujatha et al. (2005) Sujatha N. V., Shalima P., Murthy J., Henry R. C., 2005, ApJ, 633, 257
- Sujatha et al. (2009) Sujatha N. V., Murthy J., Karnataki A., Henry R. C., Bianchi L., 2009, ApJ, 692, 1333
- Sujatha et al. (2010) Sujatha N. V., Murthy J., Suresh R., Conn Henry R., Bianchi L., 2010, ApJ, 723, 1549
- Tennyson et al. (1988) Tennyson P. D., Henry R. C., Feldman P. D., Hartig G. F., 1988, ApJ, 330, 435
- Voyer et al. (2011) Voyer E. N., Gardner J. P., Teplitz H. I., Siana B. D., de Mello D. F., 2011, ApJ, 736, 80
- Weiland et al. (1986) Weiland J. L., Blitz L., Dwek E., Hauser M. G., Magnani L., Rickard L. J., 1986, ApJ, 306, L101
- Witt & Petersohn (1994) Witt A. N., Petersohn J. K., 1994, in Cutri R. M., Latter W. B., eds, Astronomical Society of the Pacific Conference Series Vol. 58, The First Symposium on the Infrared Cirrus and Diffuse Interstellar Clouds. p. 91
- Witt et al. (1993) Witt A. N., Petersohn J. K., Holberg J. B., Murthy J., Dring A., Henry R. C., 1993, ApJ, 410, 714
- Witt et al. (1997) Witt A. N., Friedmann B. C., Sasseen T. P., 1997, ApJ, 481, 809
- Xu et al. (2005) Xu C. K., et al., 2005, ApJ, 619, L11