tozreflabel \zexternaldocument*Mesgarnejad-Karma-Li-Si-Supp
Vulnerable Window of Yield Strength for Swelling-Driven Fracture of Phase-Transforming Battery Materials
Abstract
Despite numerous experimental and theoretical investigations of the mechanical behavior of high-capacity Si and Ge Li-ion battery anodes, our basic understanding of swelling-driven fracture in these materials remains limited. Existing theoretical studies have provided insights into elasto-plastic deformations caused by large volume change phase transformations, but have not modeled fracture explicitly beyond Griffith’s criterion. Here we use a multi-physics phase-field approach to model self-consistently anisotropic phase transformation, elasto-plastic deformation, and crack initiation and propagation during lithiation of Si nanopillars. Our computational results reveal that fracture occurs within a “vulnerable window” inside the two-dimensional parameter space of yield strength and fracture energy and highlight the importance of taking into account the surface localization of plastic deformation to accurately predict the magnitude of tensile stresses at the onset of fracture. They further demonstrate how the increased robustness of hollow nanopillars can be understood as a direct effect of anode geometry on the size of this vulnerable window. Those insights provide an improved theoretical basis for designing next-generation mechanically stable phase-transforming battery materials undergoing large volume changes.
Introduction
Increasing demand for portable energy storage has motivated a large research activity focused on high-capacity Li-ion battery anodes. Current carbon-based anodes have limited theoretical capacity ( for \ceLi6C [1]). Silicon and germanium have an order of magnitude larger theoretical capacity ( for \ceLi15Si4, for \ceLi22Si5 [1], for \ceLi15Si4 [2]) but are prone to fracture due to the high, approximately , volume expansion during lithiation [3, 4], which limits their use. Different designs have been explored to overcome this limitation including silicon nanopillars [5, 6], thin films [7, 8, 9], open nano-porous crystalline Si structures with ultra-high interfacial area produced by dealloying of Si-based alloys [10, 11], combinations of these [12, 13], as well as composite designs that embed silicon particles inside a more mechanically stable matrix [14, 15, 16, 17, 18].
Basic studies of the lithiation process have shown that crystalline silicon (c-Si) transforms to an amorphous lithiated alloy (a-LixSi) [19, 20, 2]. The kinetics of this large volume change phase transformation is understood to be both interface-reaction limited [20] and highly anisotropic, reflecting the two key observations that the velocity of the c-Si/a-LixSi interface remains approximately constant during lithiation, and that this velocity depends strongly on crystallographic orientation [19]. Numerical studies of elasto-plastic deformations of c-Si particles (nanowires, nano-/micro-pillars, etc) have demonstrated that the resulting anisotropic swelling can produce both large shape changes of the particles and, as a non-trivial effect of compressive yielding, tensile stresses on their outer surface that can potentially drive fracture [3, 21, 22, 23]. Those insights have already proven useful to test new anode designs to mitigate fracture [23]. However, our ability to predict when and how fracture occurs in different large volume change materials (e.g. Si versus Ge) and different anode geometries (e.g. solid versus hollow nanopillars [13]) is still limited. To date, the onset of fracture has been predicted using analytical solutions for stresses obtained in idealized geometries, assuming purely plastic deformation and isotropic swelling, and by applying a Griffith criterion to predict fracture onset for a flaw size comparable to the particle dimension [24, 25]. However, crack initiation and propagation in the setting of large elasto-plastic deformation and anisotropic swelling in phase-transforming materials remain largely unexplored.
Here, we use a multi-physics phase-field approach to simulate both anisotropic swelling and fracture of solid and hollow c-Si nanopillars within a unified theoretical framework and derive from our simulations an understanding of when and how fracture occurs as a function of key materials parameters, including yield strength and fracture energy, and geometric parameters such as nanopillar radius and slenderness. Phase transformation is modeled using a phase-field that distinguishes the c-Si and a-LixSi phases and is evolved dynamically to describe the interface-reaction-limited anisotropic motion of the c-Si/a-LixSi interface. Fracture, in turn, is modeled using the well-established variational approach that couples elasticity to a phase-field , which distinguishes pristine and broken regions of the material [26, 27]. To realistically model large volume changes, this variational approach is implemented using a large deformation formulation of elasto-plasticity combining neo-Hookean nonlinear elasticity and plasticity to quasi-statically evolve together with the material displacement field and the plastic deformation gradient tensor. The phase-field approach offers several advantages in the present context. It provides a self-consistent formulation to model simultaneously anisotropic swelling, large elasto-plastic deformation, and fracture. Furthermore, it can describe the evolution of phase boundaries and cracks of arbitrarily complex shapes, as demonstrated in applications to other phase transformations [28] and fracture problems such as thermal shock fracture [29], mixed mode fracture [30], ductile fracture [31, 32], and the simpler chemo-mechanical fracture of single-phase battery cathode particles [33, 34, 35, 36], also driven by volume expansion due to Li intercalation but only involving small elastic stresses and no phase change. In addition, in contrast to Griffith theory, the phase-field approach is able to describe crack initiation without pre-existing flaws. This property stems from the fact that varies smoothly in space on a length scale , thereby enabling crack formation on the scale of the “process zone” where elastic energy is transformed into new fracture surfaces. Hence, directly relevant to the present study, the phase-field approach can quantitatively describe crack initiation from surface imperfections such as U- or V-shape notches by treating treated as a material-dependent parameter [37]. V-shape notches, in particular, bear close similarity to surface shape deformations of lithiated Si particles undergoing elasto-plastic deformation during anisotropic swelling [3, 21, 22, 23].
To keep computations tractable, we perform 2D plane-strain simulations () on a cross-section of an unconstrained nanopillar () lithiated from its surface (i.e. outer boundary for a solid nanopillar and both outer and inner boundaries for hollow nanopillars). Furthermore, to dissect the contributions of multiple interacting physical effects (including compressive and tensile yielding, anisotropic swelling, localization of plastic deformation, and crack initiation and propagation), we carry out three different types of computations of increasing complexity. In a first step, we model stress evolution without fracture by assuming that swelling is isotropic and that the stress fields and plastic hardening parameter only vary radially and are independent of the azimuthal angle as depicted schematically in Figure 1a. This axisymmetric approximation reduces the 2D problem to a 1D radial problem. Stress evolution in a similar idealized geometry has been previously studied analytically by taking into account only plastic deformation [24, 25]. By taking into account here both elastic and plastic deformations, we demonstrate that tensile stresses generated on the particle surface by volume expansion reach a maximum value as a function of yield strength . Even though the critical value corresponding to this maximum is outside the experimentally [8, 38, 39] or theoretically estimated [40] range for Si, the existence of this critical yield strength provides a valuable theoretical framework to understand fracture behavior inside this lower estimated range of . For this reason, we investigate stress evolution over a wide range of that encompasses the entire vulnerable window for fracture. In a second step, we carry out a similar computation, still without fracture, but for the full 2D problem without the axisymmetric approximation in which the stress fields and can vary both radially and azimuthally inside the pillar cross section. This enables us to asses how anisotropic swelling modifies tensile stresses on the pillar surface. We find that tensile stresses become amplified by localization of plastic deformation, but still exhibit a maximum as a function of increasing . Those 1D and 2D computations demonstrate the existence of a vulnerable window of yield strength inside which pillars are prone to fracture. More crucially, for the relevant experimentally reported yield strengths () of Si, the difference between the material and the most critical yield strength controls the magnification of generated tensile stresses. In a last step, we validate the existence of this window by repeating our 2D computations with fracture, showing that pillars fracture only over an intermediate range of yield strength. We compare the results of full 2D simulations with estimates based on our numerically calculated stresses in the previous steps using the Griffith theory framework. We then use experimental estimates of safe pillar radius (i.e. largest pillar radius without fracture) to quantitatively validate our findings by calculating our estimate of yield strength.
Results and discussion
Model
We model the swelling-driven deformation of the material using the finite elasto-plasticity framework [41, 42, 43] and account for the fracture of the material by coupling it to a phase-field fracture model [26, 27]. Furthermore, we model the anisotropic motion of the c-Si/a-LixSi interface during lithiation using a non-conserved phase field where in the crystalline phase and in the amorphous phase. The material properties are approximated using a linear role of mixture between the crystalline and amorphous phases. We define the deformation gradient tensor as where are the undeformed coordinates and are the deformed coordinates of material points and is the displacement field. We use a multiplicative decomposition of the deformation gradient tensor such that
| (1) |
where is the phase dependent volumetric expansion due to phase change with linear Vegard expansion coefficient , is the plastic deformation, and is the elastic deformation. We use the framework of the phase-field method for fracture [27, 26] by introducing the fracture phase field along with the process zone size . To forbid interpenetration of the fracture faces similar to [32], we write the free energy with using an isochoric-volumetric split in undeformed coordinates as:
| (2) |
where , is the fracture energy and is the energy cost phase change for unit undeformed volume, and is the characteristic phase change thickness. Furthermore, we assume a neo-Hookean hyper-elastic material
| (3) |
| (4) |
where for , we define isochoric left Cauchy-Green deformation tensor . In this model, the shear modulus and bulk modulus are extrapolated between the shear and bulk moduli of amorphous () and crystalline phase (). Following classic plasticity we assume that the von Mises equivalent stress where is the deviatoric part of the Kirchhoff stress tensor ( where is the Cauchy stress tensor), is the yield strength and is the isotropic hardening parameter (at the infinitesimal strain limit the isotropic hardening parameter reduces to the equivalent plastic strain). We write the governing equations for the displacement and fracture phase field as the minimizers of (Model):
| (5) | ||||
| (6) |
where is the Fréchet derivative of the free energy with respect to field . Moreover, we model the curvature-independent interface-reaction-controlled anisotropic motion of the c-Si/a-Si interface as [44]:
| (7) |
where is the anisotropic mobility of phase change where we use the same form of the anisotropic mobility as An et al. [23].
Vulnerable window of yield strength
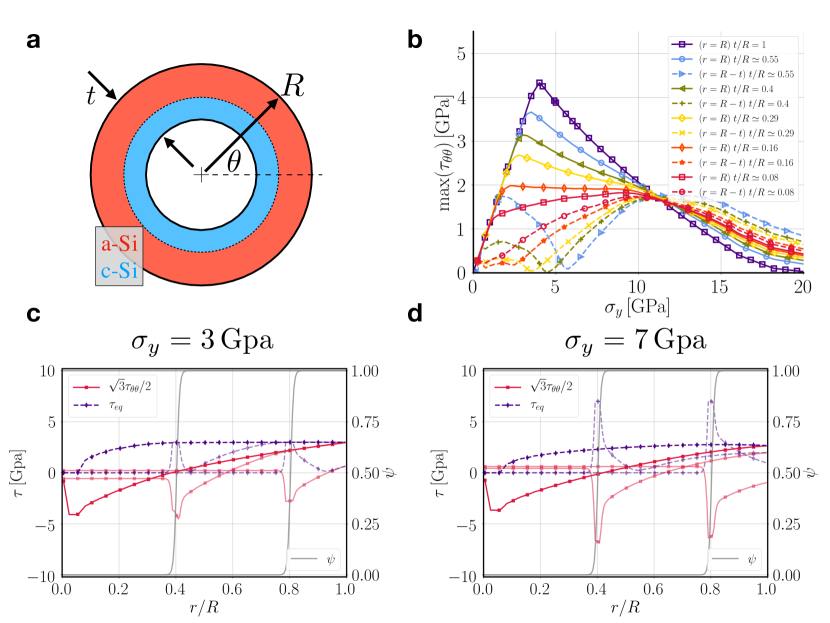
To understand the basic mechanism of stress generation in these components, as the first step, we performed an exhaustive series of axisymmetric simulations without fracture (i.e simulations in which stress fields and the plastic flow hardening parameter are assumed to only vary radially). Results of the axisymmetric computations are shown in Figure 1. Figure 1(c-d) shows the evolution of the hoop stresses and equivalent von Mises stress during lithiation of a solid nanopillar where we can identify three regimes in these figures. As the phase transformation boundary () invades inside the particle from the outer boundary (), it creates compressive stresses due to the large volumetric expansion of the a-LixSi phase. The resulting compressive stresses generate plastic flow that caps the von Mises stress at . As the crystalline core shrinks further, the compressive stresses on the outer boundary subside and change sign due to the initial compressive yield. Consequently, the hoop stress on the outer boundary changes sign and becomes tensile (Figure 1(c-d)), thereby confirming the knock-on effect of compressive yielding on the creation of tensile stresses that has been hypothesized to cause cracking [3, 21, 22, 23]. Importantly, for smaller than approximately for the present parameters, the tensile hoop stress reaches the yield strength before the c-Si core has vanished, which results in secondary plastic yielding under tension (Figure 1c). In this range (), the maximum hoop stress reached during complete lithiation, , increases linearly with as shown in Figure 1b for corresponding to a solid pillar; since the outer boundary is traction free () and the von Mises stress is capped by , on that boundary for plane-strain. In contrast, for larger , compressive yielding requires a larger lithiated fraction, which reduces the amount of volumetric expansion available to create tensile stresses during shrinkage of the remaining c-Si core. Therefore, remains below the yield strength and decreases with increasing as shown in Figure 1b. We should also highlight that although all simulations presented in this article were performed using that corresponds to volume change at full lithiation, our results show that there exists a universal relationship between the dimensionless maximum hoop stress and the dimensionelss yield strength (see Figure \zrefsfig:stt-vs-sy), such that our findings can be extended to other materials whose phase-transformation result in smaller volume changes. This universality can be readily understood noticing that at smaller expansion coefficients, smaller stresses are generated; therefore, the knock-on effect of the compressive yielding only takes place at smaller yield strength. Crucially, these results show that the vulnerable window of yield strength is shifted to smaller values of yield strength for smaller expansion coefficient. The resulting hat shape of the versus plot in Figure 1b suggests the existence of a vulnerable window for fracture corresponding to the range of where the maximum hoop stress becomes large enough to initiate fracture. Specifically, existence of a maximum generated hoop stress at a critical yield strength increases the available energetic driving force for fracture at lower yield strength as confirmed below by our full 2D simulations (Figures 3–5). Figure 1b also shows plots of versus on the inner () and outer () boundaries of hollow nanopillars. The maximum hoop stress on the outer boundary still exhibits a maximum. However, since the compliance of the annulus is inversely related to its slenderness , the maximum stresses on both boundaries decrease with increasing slenderness.
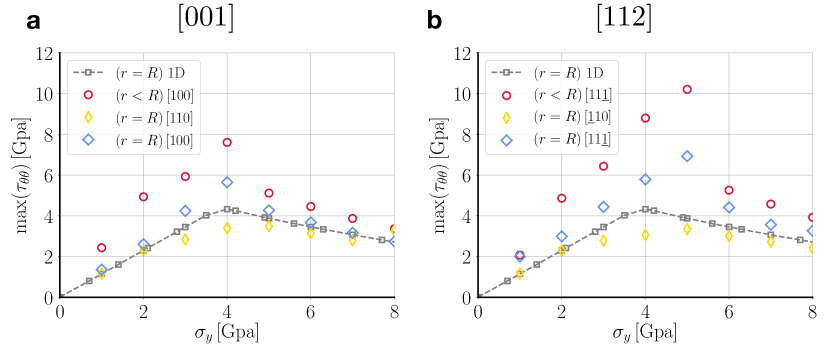
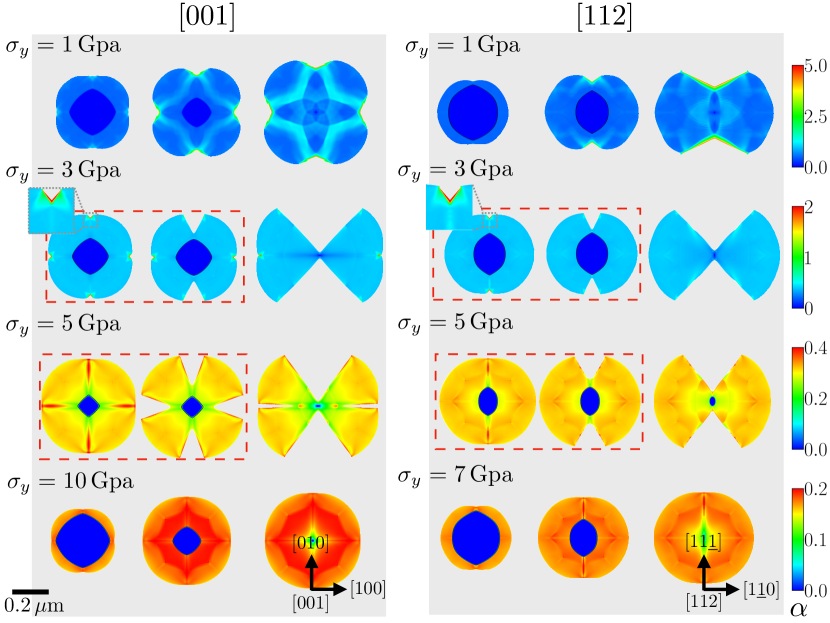
Next, we performed 2D simulations of anisotropic swelling without fracture for pillars oriented in two crystallographic directions and . In these simulations, the crystalline core is no longer circular and the anisotropic mobility of the amorphization front creates a crystalline silicon core with sharp corners. During lithiation, those crystalline corners concentrate stresses and localize plastic flow in their vicinity. When the stresses change sign and become tensile on the pillar outer boundary, shear localization produces V-shaped notches at orientations corresponding to these corners for lower yield strength, which allows tensile yielding to occur on the periphery subsequent to compressive yielding, but not larger yield strength where tensile yielding does not occur. This difference can be seen in the pillar morphologies in Figure 3 for and ( for oriented pillar) that did not fracture. Those notches further concentrate stresses, thereby augmenting the magnitude of hoop stresses several fold at those orientations. This magnification is shown in Figure 2 where we compare , defined as before as the maximum hoop stress reached in time during complete lithiation, from 1D axisymmetric computations of isotropic swelling and the present 2D computations of anisotropic swelling. For the latter case, we report both on the outer surface (blue and yellow diamonds) and at a position inside the particle close to the outer surface (red circles) where reaches its maximum value along a vertical axis that contains the corners of the c-Si core. The maximum hoop stress is seen to be magnified both by localization of plastic deformation during compressive yielding, which occurs for all reported, and V-shape notches that form for lower due to tensile yielding.
The 2D results in Figure 2 confirm the existence of a critical yield strength that generates maximal tensile stresses but were obtained from simulations without fracture. To investigate the effect of stress augmentation on fracture, we repeated a series of simulations with fracture for different and the and crystallographic orientations and for fixed process zone size to radius ratio . The time evolutions of particle morphologies in Figure 3 show that nanopillar fracture during lithiation over an intermediate range of inside the vulnerable window centered at the critical yield strength. For , V-shaped notches are created along the crystalline corner directions but the magnitude of surface tensile stresses are insufficient for crack initiation. For , cracks initiate due to stress concentration at V-shaped notches and propagate unstably towards the crystalline core. For , tensile yielding and hence V-shaped notches are absent but tensile stresses grow sufficiently large (at a later stage of charging compared to ) to create two pairs of cracks that propagate unstably after initiation. The horizontal pair subsequently arrests and the vertical pair propagates further due to spontaneous symmetry breaking. Finally, for ( for oriented pillar), reduced compressive plastic flow in the system suppresses the subsequent increase of tensile stresses, thereby preventing crack initiation. In oriented pillars, crack initiate at the four corners corresponding to and directions where stresses are largest. In oriented pillars, crack initiate at the two corners along directions.
Size effects
Experimental observations of Si anodic components show a clear size dependency where, for example, nanospheres with radii smaller than [5] and nanopillars with radii smaller than [6] do not break during lithiation. Such size dependencies, prevalent in brittle and quasi-brittle materials [45, 46, 47, 48], are typically characterized by a power law relationship between the stress to fracture and component size, , for much larger than the process zone size. Within the theoretical framework of Linear Elastic Fracture Mechanics (LEFM), which treats crack surfaces as sharp boundaries, this power law is readily obtained from the expression for the energy release rate at the tip of a crack of length under a spatially homogeneous critical stress , which can be written as for plane-strain where is a dimensionless constant that generally depends on particle geometry and load configuration. Equating the energy release rate with the fracture energy (), we obtain the expression
| (8) |
and thus the scaling by further assuming that the maximum flaw size increases proportionally to the particle size ( and ). In the phase-field model used in this article, which describes the state of the material with a spatially varying scalar field , crack nucleation is an inherent property of the model and occurs via an instability that causes to develop a local dip () when the local stress exceeds a critical value [49] (up to a numerical prefactor that also depends on particle geometry and load configuration). Consequently, by comparing the above scaling expression for to Eq. (8), we can physically interpret as playing an analogous role to the dominant flaw size in the LEFM framework. Furthermore, by using the result of a stability analysis of a 1D stretched strip in the phase-field model, which yields the prediction [49], we obtain the constant by comparison with Eq. 8 with . This value is close to the standard LEFM value for a crack of length in a uniform stress. One main qualitative difference, however, is that crack nucleation in the phase-field model occurs through an instability of the pristine state in which is spatially uniform and hence does not require the introduction of a flaw in the form of a finite length seed crack as in LEFM.
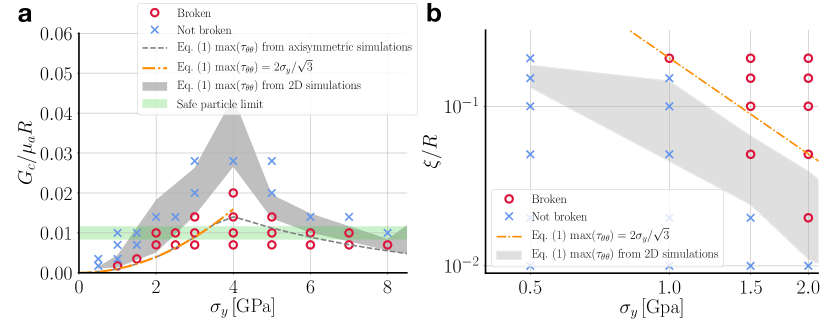
We take advantage of this property to investigate the particle size dependence of fracture onset by performing simulations at fixed process zone size to particle size ratio . From the dimensional analysis, it is natural to define the dimensionless fracture energy as where is the shear modulus of the amorphous a-\ceLi_xSi phase. The dimensionless fracture energy can be readily interpreted as the ratio of the Griffith length scale and the nanopillar radius. Figure 4a reports the results of an extensive series of 2D phase-field fracture simulations for oriented nanopillars for , which identifies regions of the two-dimensional parameters space and where fracture does (red circles) or does not (blue crosses) occur. These results confirm the existence of a vulnerable window of where cracks initiate and propagate in nanopillars during lithiation. This window is centered around the critical value of generating maximal tensile stresses and shrinks in size with increasing .
We now assess if the onset of fracture in 2D phase-field simulations can be predicted within Griffith theory by using Eq. (8) together with values of the maximum hoop stress during lithiation obtained in 1D or 2D phase-field simulations without fracture (Figure 2). For this, we assume stress-free surfaces () and small elastic strains, which allows to use a quadratic approximation for the stored elastic energy where , are the elastic modulus and Poisson ratio of the a-Si. We found that this small strain quadratic form provides an accurate description of the elastic energy in phase-field simulations calculated using nonlinear neo-Hookean elasticity (Eq. (3)). We can then rewrite Eq. (8) as a function of the maximum hoop stress as
| (9) |
where . Substituting in the above expression the values of obtained from 1D axisymmetric simulations, we obtain the gray dashed line in Figure 4a that falls significantly below the boundary, comprised between red circles and blue crosses, corresponding to the onset of fracture in 2D simulations with fracture. Consequently, Griffith theory with axisymmetric tensile stresses underestimates the critical value of for fracture at fixed and, hence, overestimates the safe pillar radius. This discrepancy can be attributed to the fact that the 1D axisymmetric simulations lack the stress amplification due to plastic localization and instability. We therefore conclude that localization of plasticity caused by anisotropic volumetric expansion plays a significant role in fracture of Si nanopillars. This conclusion is further supported by the finding that the prediction of Eq. (9) is significantly improved when we use values of maximum hoop stresses obtained from 2D simulations without fracture, which exhibit stress concentration at V-shaped notches. Unlike in 1D axisymmetric simulations, where the tensile hoop stress is always maximum at the pillar surface, hoop stresses in 2D simulations with localization of plastic deformation reach their maximal values inside the particle at a short distance away from the V-shaped notch (Figure 2). Therefore, we can reasonably use Eq. (9) together with values of both inside the particle and at the tip of the V-shaped notch (corresponding to the red circles and blue squares in Figure 2a, respectively) to obtain lower and upper bounds for the fracture boundary in the plane of and . The results are depicted by the gray shaded region in Figure 4a that is comprised between the lower and upper bounds computed in this fashion. The fracture boundary between red circles and blue crosses in 2D phase-field simulations falls for the most part inside this gray shaded region (in particular over the range of experimental relevance), thereby confirming that stress concentration near V-shaped notches is an important mechanism promoting fracture.
We can now relate our numerical findings to experimental observations of safe nanopillar sizes. Figure 4a shows that the safe nanopillar radius (where pillars with radii less than the safe value do not break) decreases with increasing over the estimated range for a-\ceLi_xSi. The experimental range of safe nanopillar radius is highlighted by the green shaded region in Figure 4a. This region was computed using the experimentally observed safe nanopillar radius () [6] and the estimated range of fracture energy () from experimental measurements [39]. 2D phase-field simulations predict that, inside this green shaded region of Figure 4a, fracture occurs for between (blue crosses) and (red circles), which falls in the upper part of the range estimated from experimental measurements [8, 38, 39]. Phase-field modeling prediction also depend generally on flaw size through the ratio . To test this dependence, we repeated a series of simulations by varying over the range to , which encompasses the value used in all simulations presented so far. These simulations were carried out at fixed dimensionless fracture energy calculated using the average reported fracture energy for a-\ceLi_xSi [39] and the observed safe nanopillar radius [6]. The results reported in Figure 4b show that nanopillars become more vulnerable to fracture with increasing as theoretically expected. For the largest value studied here, fracture occurs for between (blue cross) and (red circle), which falls in the lower part of the range estimated from experimental measurements [8, 38, 39]. While the precise value of is not known, its value is presumably much smaller than unity given that nanopillars do not typically exhibit large visible flaw sizes prior to lithiation [20, 6].
We can further confirm the above estimate of by redoing the calculations for isotropic lithiation of amorphous Si. Experimental observations demonstrate that a-Si lithiates isotropically [50, 51, 52]. It is therefore reasonable to use our 1D axisymmetric simulations to estimate the magnitude of hoop stresses generated during lithiation of a-Si. We can simplify Eq. (9) further using the expression valid for small (see Figure 1b), which yields the prediction for isotropic lithiation of a-\ceLi_xSi. Zhao et al. [24] obtained a similar expression of the form of previously by an analysis of lithiation that only considers plastic deformation and computes the dimensionless prefactor numerically assuming an initial flaw size comparable to . In contrast, here, the prefactor is obtained analytically from the aforementioned 1D stability analysis of crack initiation in the phase-field model [49]. We can use this isotropic estimate along with the safe experimentally observed safe nanopillar radius [52] to calculate an upper bound for its yield strength using the process zone size . We can use a similar analysis for Ge. Since lithiation of Ge is observed to be isotropic, using the estimates of its shear modulus we can estimate in the range . We calculated the above range similarly using the process zone size and based on observed safe nanopillar radius of [53].
Geometrical effects
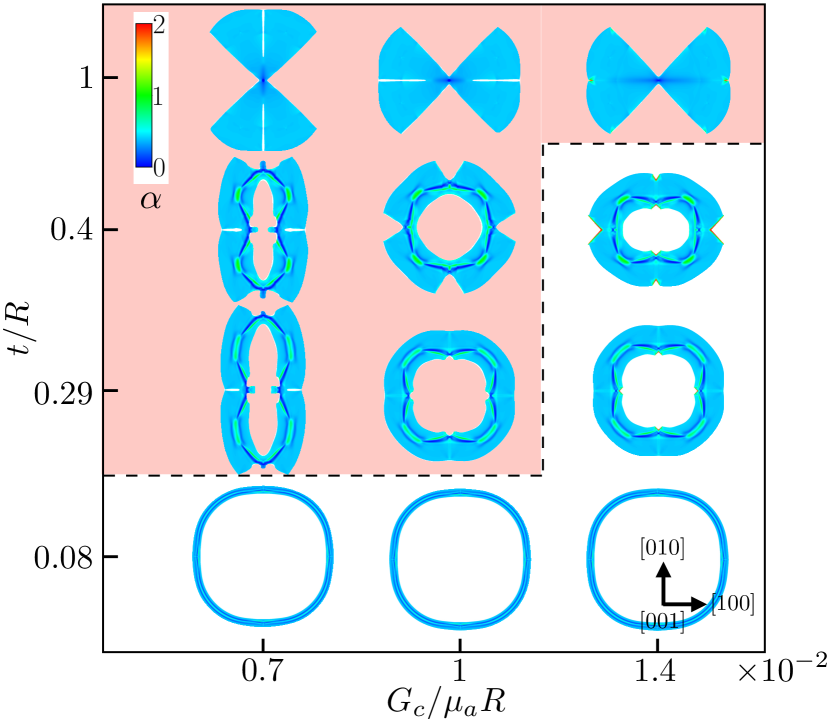
Finally, to highlight the non-trivial role of geometry beyond size effects, we investigate the fracture of hollow nanopillars that have been shown experimentally to be more resistant to fracture [13]. Our axisymmetric computations predict that this geometrical protective effect is present for large enough yield strength due to a decrease of the maximum hoop stress reached during complete lithiation of crystalline Si as a function of (i.e., the decrease of the peak value of plots in Figure 1b with increasing annulus slenderness). However, for low yield strength, the maximum hoop stress remains bounded by even for large slenderness. This implies that the hollow nanopillar design can mitigate fracture only for materials with moderately high yield strength. To test these predictions, we modeled the lithiation and fracture of hollow nanopillars with a constant cross-sectional area equal to solid nanopillars with radii and different slenderness for . The results illustrated in Figure 5 show that increased slenderness has a protective effect for this value. For example, nanopillars break for but only exhibit minor cracking near the interior surface of . Even more slender nanopillars () do not fracture. This protective geometrical effect, however, does not persist at lower yield strength for . Our axisymmetric computations predict that the maximum hoop stress generated in even the thinnest annulus is equal to that of a solid nanopillar for (Figure 1b). Our 2D simulations confirm this prediction by showing that the hollow nanopillar for , which is protected for , fractures for .
In summary, we have used a multi-physics phase-field approach to model simultaneously anisotropic phase transformation, elasto-plastic deformation, and crack initiation and propagation during lithiation of Si nanopillars. Our results identify a vulnerable window of yield strength inside which pillars fracture during lithiation and distinguish two different modes of fracture inside that window with and without surface localization of plastic deformation prior to fracture for lower and higher yield strength, respectively. Those two modes follow from the existence of a critical yield strength that generates maximal tensile stresses during lithiation. Combined with experimental measurements of fracture energy [39] and observations of size dependent fracture [6, 5, 52], our results yield an estimate of yield strength within a range consistent with experimental [8, 38, 39] and theoretical [40] estimates. This range is smaller than the critical yield strength consistent with the observation of localized plastic deformation during lithiation of Si nanopillars [3, 6, 5]. Over this range, plastic deformation mitigates fracture by energy dissipation but, at the same time, promotes it by the creation of stress-concentrating V-shaped notches that precede quasi-brittle fracture. Our results also suggest that the observed increased robustness of hollow Si nanopillars [13] is due to a reduction of the critical yield strength generating maximal tensile stresses with increasing slenderness. This interpretation, however, warrants further investigation since this protective effect is only significant in simulations with large enough values. The present study highlights the importance of computationally informed geometric design that takes into account the subtle interplay between material properties and geometry to generate reliable predictions of mechanical stability of high-capacity battery materials, paving the way for designs that exploit more complex geometries such as open nanoporous structures with ultra-high interfacial area [11].
Methods
All the equations are solved using Galerkin Finite Element Method. Furthermore, to ensure the robustness of solution only 1/4 of each geometry was simulated and appropriate boundary conditions are applied on the symmetry axises. Our implementation is based on PETSc [54] as the linear algebra backbone and libMesh [55] for finite elements bookkeeping. Eq. (5) is solved using a Newton method where we calculate the consistent tangent moduli explicitly at each iteration. Furthermore, Eq. (7) is integrated explicitly using 50 substeps during each time step to ensure the accuracy and stability of integration. Table 1 summarizes the values of different parameters used in our simulations.
Author contributions
A.M. and A.K. conceived the theoretical study and jointly interpreted the numerical results and wrote the paper. A.M. carried out the numerical study.
Acknowledgements
A.M. and A.K. acknowledge the support of Grant No. DE-FG02-07ER46400 from the U.S. Department of Energy, Office of Basic Energy Sciences. The majority of the numerical simulations were performed on the Northeastern University Discovery cluster at the Massachusetts Green High Performance Computing Center (MGHPCC).
References
- [1] Uday Kasavajjula, Chunsheng Wang, and A. John Appleby. Nano- and bulk-silicon-based insertion anodes for lithium-ion secondary cells. Journal of Power Sources, 163(2):1003–1039, 2007.
- [2] Yang Liu, Sulin Zhang, and Ting Zhu. Germanium-based electrode materials for lithium-ion batteries. ChemElectroChem, 1(4):706–713, 2014.
- [3] Xiao Hua Liu, He Zheng, Li Zhong, Shan Huang, Khim Karki, Li Qiang Zhang, Yang Liu, Akihiro Kushima, Wen Tao Liang, Jiang Wei Wang, Jeong-Hyun Cho, Eric Epstein, Shadi A. Dayeh, S. Tom Picraux, Ting Zhu, Ju Li, John P. Sullivan, John Cumings, Chunsheng Wang, Scott X. Mao, Zhi Zhen Ye, Sulin Zhang, and Jian Yu Huang. Anisotropic swelling and fracture of silicon nanowires during lithiation. Nano Letters, 11(8):3312–3318, 2011. PMID: 21707052.
- [4] Xiao Hua Liu, Li Qiang Zhang, Li Zhong, Yang Liu, He Zheng, Jiang Wei Wang, Jeong-Hyun Cho, Shadi A. Dayeh, S. Tom Picraux, John P. Sullivan, Scott X. Mao, Zhi Zhen Ye, and Jian Yu Huang. Ultrafast electrochemical lithiation of individual si nanowire anodes. Nano Letters, 11(6):2251–2258, 06 2011.
- [5] Xiao Hua Liu, Li Zhong, Shan Huang, Scott X. Mao, Ting Zhu, and Jian Yu Huang. Size-dependent fracture of silicon nanoparticles during lithiation. ACS Nano, 6(2):1522–1531, 02 2012.
- [6] Seok Woo Lee, Matthew T. McDowell, Lucas A. Berla, William D. Nix, and Yi Cui. Fracture of crystalline silicon nanopillars during electrochemical lithium insertion. Proceedings of the National Academy of Sciences, 109(11):4080–4085, 2012.
- [7] J. Graetz, C. C. Ahn, R. Yazami, and B. Fultz. Nanocrystalline and thin film germanium electrodes with high lithium capacity and high rate capabilities. Journal of The Electrochemical Society, 151(5):A698–A702, 05 2004.
- [8] Vijay A. Sethuraman, Michael J. Chon, Maxwell Shimshak, Venkat Srinivasan, and Pradeep R. Guduru. In situ measurements of stress evolution in silicon thin films during electrochemical lithiation and delithiation. Journal of Power Sources, 195(15):5062–5066, 8 2010.
- [9] Sumit K. Soni, Brian W. Sheldon, Xingcheng Xiao, and Anton Tokranov. Thickness effects on the lithiation of amorphous silicon thin films. Scripta Materialia, 64(4):307–310, 2 2011.
- [10] Yu Zhao, Xizheng Liu, Huiqiao Li, Tianyou Zhai, and Haoshen Zhou. Hierarchical micro/nano porous silicon li-ion battery anodes. Chemical Communications, 48(42):5079–5081, 2012.
- [11] Takeshi Wada, Tetsu Ichitsubo, Kunio Yubuta, Haruhiko Segawa, Hirokazu Yoshida, and Hidemi Kato. Bulk-nanoporous-silicon negative electrode with extremely high cyclability for lithium-ion batteries prepared using a top-down process. Nano letters, 14(8):4505–4510, 2014.
- [12] Mingyuan Ge, Jiepeng Rong, Xin Fang, and Chongwu Zhou. Porous doped silicon nanowires for lithium ion battery anode with long cycle life. Nano letters, 12(5):2318–2323, 2012.
- [13] Xing-yu Zhang, Wei-Li Song, Zhanli Liu, Hao-Sen Chen, Teng Li, Yujie Wei, and Dai-ning Fang. Geometric design of micron-sized crystalline silicon anodes through in situ observation of deformation and fracture behaviors. Journal of Materials Chemistry A, 5(25):12793–12802, 2017.
- [14] Y. Zhang, X. G. Zhang, H. L. Zhang, Z. G. Zhao, F. Li, C. Liu, and H. M. Cheng. Composite anode material of silicon/graphite/carbon nanotubes for li-ion batteries. Electrochimica Acta, 51(23):4994–5000, 2006.
- [15] Juchen Guo, Xilin Chen, and Chunsheng Wang. Carbon scaffold structured silicon anodes for lithium-ion batteries. Journal of Materials Chemistry, 20(24):5035–5040, 2010.
- [16] Lu Yue, Haoxiang Zhong, and Lingzhi Zhang. Enhanced reversible lithium storage in a nano-si/mwcnt free-standing paper electrode prepared by a simple filtration and post sintering process. Electrochimica Acta, 76:326–332, 2012.
- [17] Maria Letizia Terranova, Silvia Orlanducci, Emanuela Tamburri, Valeria Guglielmotti, and Marco Rossi. Si/c hybrid nanostructures for li-ion anodes: An overview. Journal of Power Sources, 246:167–177, 2014.
- [18] Ubeyd Toçoğlu, Gizem Hatipoğlu, Miraç Alaf, Fuat Kayış, and Hatem Akbulut. Electrochemical characterization of silicon/graphene/mwcnt hybrid lithium-ion battery anodes produced via rf magnetron sputtering. Applied Surface Science, 389:507–513, 2016.
- [19] Seok Woo Lee, Matthew T. McDowell, Jang Wook Choi, and Yi Cui. Anomalous shape changes of silicon nanopillars by electrochemical lithiation. Nano Letters, 11(7):3034–3039, 07 2011.
- [20] Xiao Hua Liu, Jiang Wei Wang, Shan Huang, Feifei Fan, Xu Huang, Yang Liu, Sergiy Krylyuk, Jinkyoung Yoo, Shadi A Dayeh, Albert V Davydov, et al. In situ atomic-scale imaging of electrochemical lithiation in silicon. Nature nanotechnology, 7(11):749–756, 2012.
- [21] Hui Yang, Shan Huang, Xu Huang, Feifei Fan, Wentao Liang, Xiao Hua Liu, Long-Qing Chen, Jian Yu Huang, Ju Li, Ting Zhu, et al. Orientation-dependent interfacial mobility governs the anisotropic swelling in lithiated silicon nanowires. Nano letters, 12(4):1953–1958, 2012.
- [22] Hui Yang, Feifei Fan, Wentao Liang, Xu Guo, Ting Zhu, and Sulin Zhang. A chemo-mechanical model of lithiation in silicon. Journal of the Mechanics and Physics of Solids, 70:349–361, 2014.
- [23] Yonghao An, Brandon C Wood, Jianchao Ye, Yet-Ming Chiang, Y Morris Wang, Ming Tang, and Hanqing Jiang. Mitigating mechanical failure of crystalline silicon electrodes for lithium batteries by morphological design. Physical Chemistry Chemical Physics, 17(27):17718–17728, 2015.
- [24] Kejie Zhao, Matt Pharr, Qiang Wan, Wei L Wang, Efthimios Kaxiras, Joost J Vlassak, and Zhigang Suo. Concurrent reaction and plasticity during initial lithiation of crystalline silicon in lithium-ion batteries. Journal of the Electrochemical Society, 159(3):A238–A243, 2012.
- [25] Kejie Zhao, Matt Pharr, Lauren Hartle, Joost J. Vlassak, and Zhigang Suo. Fracture and debonding in lithium-ion batteries with electrodes of hollow core–shell nanostructures. Journal of Power Sources, 218:6–14, 2012.
- [26] Alain Karma, David A. Kessler, and Herbert Levine. Phase-field model of mode iii dynamic fracture. Phys. Rev. Lett., 87:045501, Jul 2001.
- [27] B. Bourdin, G. A. Francfort, and J.-J. Marigo. The variational approach to fracture. Journal of Elasticity, 91(1):5–148, 2008.
- [28] Alain Karma and Damien Tourret. Atomistic to continuum modeling of solidification microstructures. Current Opinion in Solid State and Materials Science, 20(1):25–36, 2016.
- [29] B. Bourdin, J.-J. Marigo, C. Maurini, and P. Sicsic. Morphogenesis and propagation of complex cracks induced by thermal shocks. Phys. Rev. Lett., 112:014301, Jan 2014.
- [30] Chih-Hung Chen, Tristan Cambonie, Veronique Lazarus, Matteo Nicoli, Antonio J. Pons, and Alain Karma. Crack front segmentation and facet coarsening in mixed-mode fracture. Phys. Rev. Lett., 115:265503, Dec 2015.
- [31] M. Ambati, T. Gerasimov, and L. De Lorenzis. Phase-field modeling of ductile fracture. pages 1–24, 2015.
- [32] Michael J Borden, Thomas JR Hughes, Chad M Landis, Amin Anvari, and Isaac J Lee. A phase-field formulation for fracture in ductile materials: Finite deformation balance law derivation, plastic degradation, and stress triaxiality effects. Computer Methods in Applied Mechanics and Engineering, 2016.
- [33] C. Miehe, H. Dal, and A. Raina. A phase field model for chemo-mechanical induced fracture in lithium-ion battery electrode particles. International Journal for Numerical Methods in Engineering, pages n/a–n/a, 2015.
- [34] Peng Zuo and Ya-Pu Zhao. A phase field model coupling lithium diffusion and stress evolution with crack propagation and application in lithium ion batteries. Physical Chemistry Chemical Physics, 17(1):287–297, 2015.
- [35] M. Klinsmann, D. Rosato, M. Kamlah, and R. M. McMeeking. Modeling crack growth during li extraction in storage particles using a fracture phase field approach. Journal of The Electrochemical Society, 163(2):A102–A118, 01 2016.
- [36] Ataollah Mesgarnejad and Alain Karma. Phase field modeling of chemomechanical fracture of intercalation electrodes: Role of charging rate and dimensionality. arXiv preprint arXiv:1906.07655, 2019.
- [37] Erwan Tanné, Tianyi Li, Blaise Bourdin, J-J Marigo, and Corrado Maurini. Crack nucleation in variational phase-field models of brittle fracture. Journal of the Mechanics and Physics of Solids, 110:80–99, 2018.
- [38] M. J. Chon, V. A. Sethuraman, A. McCormick, V. Srinivasan, and P. R. Guduru. Real-time measurement of stress and damage evolution during initial lithiation of crystalline silicon. Physical Review Letters, 107(4):045503–, 07 2011.
- [39] Matt Pharr, Zhigang Suo, and Joost J. Vlassak. Measurements of the fracture energy of lithiated silicon electrodes of li-ion batteries. Nano Letters, 13(11):5570–5577, 11 2013.
- [40] Kejie Zhao, Wei L. Wang, John Gregoire, Matt Pharr, Zhigang Suo, Joost J. Vlassak, and Efthimios Kaxiras. Lithium-assisted plastic deformation of silicon electrodes in lithium-ion batteries: A first-principles theoretical study. Nano Letters, 11(7):2962–2967, 07 2011.
- [41] Juan C Simo. A framework for finite strain elastoplasticity based on maximum plastic dissipation and the multiplicative decomposition: Part i. continuum formulation. Computer methods in applied mechanics and engineering, 66(2):199–219, 1988.
- [42] Juan C Simo. A framework for finite strain elastoplasticity based on maximum plastic dissipation and the multiplicative decomposition. part ii: computational aspects. Computer methods in applied mechanics and engineering, 68(1):1–31, 1988.
- [43] Juan C Simo and Thomas JR Hughes. Computational inelasticity, volume 7. Springer Science & Business Media, 2006.
- [44] Sébastien Nguyen, Roger Folch, Vijay K. Verma, Hervé Henry, and Mathis Plapp. Phase-field simulations of viscous fingering in shear-thinning fluids. Physics of Fluids, 22(10), 2010.
- [45] BR Lawn, T. Jensen, and A. Arora. Brittleness as an indentation size effect. Journal of materials science, 11(3):573–575, 1976.
- [46] Lubna Alkadi and N. Dorin Ruse. Fracture toughness of two lithium disilicate dental glass ceramics. The Journal of Prosthetic Dentistry, 116(4):591–596, 2016.
- [47] M. R. M. Aliha and H. R. Fattahi Amirdehi. Fracture toughness prediction using weibull statistical method for asphalt mixtures containing different air void contents. Fatigue & Fracture of Engineering Materials & Structures, 40(1):55–68, 2019/08/02 2017.
- [48] Zdenek P Bazant. Fracture and size effect in concrete and other quasibrittle materials. Routledge, 2019.
- [49] Kim Pham and Jean-Jacques Marigo. From the onset of damage to rupture: construction of responses with damage localization for a general class of gradient damage models. Continuum Mechanics and Thermodynamics, pages 1–25, 2013.
- [50] Matthew T. McDowell, Seok Woo Lee, Justin T. Harris, Brian A. Korgel, Chongmin Wang, William D. Nix, and Yi Cui. In situ tem of two-phase lithiation of amorphous silicon nanospheres. Nano Letters, 13(2):758–764, 02 2013.
- [51] Jiang Wei Wang, Yu He, Feifei Fan, Xiao Hua Liu, Shuman Xia, Yang Liu, C Thomas Harris, Hong Li, Jian Yu Huang, Scott X Mao, et al. Two-phase electrochemical lithiation in amorphous silicon. Nano letters, 13(2):709–715, 2013.
- [52] Lucas A. Berla, Seok Woo Lee, Ill Ryu, Yi Cui, and William D. Nix. Robustness of amorphous silicon during the initial lithiation/delithiation cycle. Journal of Power Sources, 258:253–259, 2014.
- [53] Seok Woo Lee, Ill Ryu, William D. Nix, and Yi Cui. Fracture of crystalline germanium during electrochemical lithium insertion. Extreme Mechanics Letters, 2:15–19, 3 2015.
- [54] Satish Balay, Shrirang Abhyankar, Mark F. Adams, Jed Brown, Peter Brune, Kris Buschelman, Lisandro Dalcin, Victor Eijkhout, William D. Gropp, Dinesh Kaushik, Matthew G. Knepley, Dave A. May, Lois Curfman McInnes, Karl Rupp, Patrick Sanan, Barry F. Smith, Stefano Zampini, Hong Zhang, and Hong Zhang. PETSc users manual. Technical Report ANL-95/11 - Revision 3.8, Argonne National Laboratory, 2017.
- [55] B. S. Kirk, Peterson J. W., Stogner R. H., and Carey G. F. libMesh: A C++ Library for Parallel Adaptive Mesh Refinement/Coarsening Simulations. Engineering with Computers, 22(3–4):237–254, 2006.