The Roles of Mass and Environment in the Quenching of Galaxies
Abstract
We study the roles of stellar mass and environment in quenching the star formation activity of a large set of simulated galaxies by taking advantage of an analytic model coupled to the merger tree extracted from an N-body simulation. The analytic model has been set to match the evolution of the global stellar mass function since redshift and give reasonable predictions of the star formation history of galaxies at the same time. We find that stellar mass and environment play different roles: the star formation rate/specific star formation rate- relations are independent of the environment (defined as the halo mass) at any redshift probed, , for both star forming and quiescent galaxies, while the star formation rate- relation strongly depends on stellar mass in the same redshift range, for both star forming and quiescent galaxies. Moreover, the star formation rate and the specific star formation rate are strongly dependent on stellar mass even when the distance from the cluster core is used as a proxy for the environment, rather than the halo mass. We then conclude that stellar mass is the main driver of galaxy quenching at any redshift probed in this study, not just at as generally claimed, while the environment has a minimal role. All the physical processes linked to the environment must act on very short timescales, such that they do not influence the star formation of active galaxies, but increase the probability of a given galaxy to become quiescent.
1 Introduction
Galaxies are an important component of the visible matter in the Universe. Given the diversity of their morphologies and general properties, they evolve as a consequence of several physical processes which are responsible for the different populations that we can observe in the local Universe. A deep understanding of these processes, in particular the role of quenching and the time/mass-scales involved, would end up in a significant step forward in the comprehension of galaxy formation and evolution.
It is well known that, broadly speaking, galaxies can be classified into two main populations according to their rate of star formation activity: star forming systems and quiescent (passive) objects (Blanton et al. 2003; Baldry et al. 2004; Kauffmann et al. 2004; Brinchmann et al. 2004; Balogh et al. 2004; Cassata et al. 2008; Pallero et al. 2018; Davies et al. 2019). Star forming galaxies actively form new stars, have blue colors, late-type morphologies and are typically young (Blanton et al. 2003; Kauffmann et al. 2003; Noeske et al. 2007; Wuyts et al. 2011). On the other hand, quiescent galaxies do not show star formation activity, have red colors, early-type morphologies and are typically old (Baldry et al. 2004; Gallazzi et al. 2008; Wetzel et al. 2012; van der Wel et al. 2014).
Galaxy properties are also found to be both environment and stellar mass dependent. Generally speaking, galaxies in denser environment tipically have early-type morphologies, are less star forming, redder, older and more metal rich (Dressler 1980; Kauffmann et al. 2004; von der Linden et al. 2010; Peng et al. 2010; Cooper et al. 2010), and the same trends are still valid for more massive galaxies (Kauffmann et al. 2003; Baldry et al. 2006; Weinmann et al. 2006; Bamford et al. 2009; Peng et al. 2010). Environment and stellar mass have been found to be important for the quenching of galaxies, although we do not have a clear knowledge yet of which between environment and mass plays the most important role in galaxy quenching (sometimes it is referred to as nature/nurture debate).
During the past years, many physical processes related to both environment and stellar mass have been invoked in order to explain galaxy quenching (Noeske et al. 2007; Peng et al. 2010; Sobral et al. 2011; Muzzin et al. 2012, 2013; Darvish et al. 2016; Trussler et al. 2018). In their pioneering work Peng et al. (2010), who used SDSS and zCOSMOS data, demonstrated the mutual independence of stellar mass and environment in quenching star formation. From the empirical model they constructed, they have been able to separate the effects of mass and environmental quenching, and found that mass quenching is the main process responsible for quenching star formation in galaxies with , independently of environment and redshift. On the other hand, environmental processes become important at low redshift and for low-mass galaxies. In short, massive galaxies are more likely quenched by internal processes that are independent of the environment in which they reside, and galaxies in denser environment are likely quenched by processes that are independent of their stellar mass.
Mass quenching is generelly referred to internal processes that mainly depend on the galaxy mass. Different processes have been proposed depending on the characteristic stellar mass regime. In the low mass regime () gas outflows driven by stellar feedback such as stellar winds/radiation or SNe explosions are thought to play an important part in quenching star formation (Larson 1974; Dekel & Silk 1986; Dalla Vecchia & Schaye 2008). For more massive galaxies (), in particular those with a pronunced bulge component, AGN feedback appears to be more effective in stopping star formation. The AGN can be powerful enough to either heat up the surrounding cold gas by injecting energy via radio jets or winds, or even sweep away the gas content through powerful outflows (Croton et al. 2006; Fabian 2012; Fang et al. 2013; Cicone et al. 2014; Bremer et al. 2018).
Environmental quenching is usually intended as the process, or series of processes, that quench star formation because of interactions between galaxies and their surroundings, such as ram pressure stripping (Gunn & Gott 1972; Poggianti et al. 2017), strangulation or starvation (Larson et al. 1980; Moore et al. 1999) and harassments (Farouki & Shapiro 1981; Moore et al. 1996). Ram pressure stripping in clusters removes the cold gas in the interstellar medium (ISM) due to the interaction between it and the intracluster medium, thus inhibiting further star formation unless hot gas can cool and replenish the cold gas reservoir. Starvation (or strangulation) is a process which is assumed instantantaneous as soon as a galaxy is accreted in a large system and that completely removes the hot gas available for cooling, thus shutting down the fuel for further star formation. Harassments are instead the result of close galaxy-galaxy encounters which can lead to the removal of gas and the conversion of part of the cold gas into stars.
All the above mentioned mass/environmental processes can be otherwise classified as processes that act on central galaxies (mass quenching), and on satellite galaxies (environmental quenching). Centrals are either field galaxies or the most massive galaxies residing in the centre of groups/clusters, while satellites were formerly centrals and became satellites once accreted in larger system. This central/satellite dichotomy has often been used (especially by the theoretical side) as a parallelism with mass/environmental quenching (e.g. van den Bosch et al. 2008; Peng et al. 2012; Wetzel et al. 2013; Contini et al. 2017b).
In order to understand what quenching dominates during the evolutionary history of galaxies, it is necessary to separate their contributions. In the past few years, many studies focused on this point (e.g., Kauffmann et al. 2003; Muzzin et al. 2012; Koyama et al. 2013; Darvish et al. 2016; Laganá & Ulmer 2018 and references therein), in understanding how the star formation rate (SFR) or colors depend on halo mass/clustercentric distance at fixed stellar mass, which quantifies mass quenching, and how the SFR- relations vary as a function of environment, which quantifies environmental quenching, at different redshifts. Although we know that stellar mass does play a role, the picture is not yet clear for what concerns the environment. A bunch of studies have found that galaxies are more likely to be quenched or red in more massive haloes (see e.g., Balogh et al. 2000; De Propris et al. 2004; Weinmann et al. 2006; Blanton & Berlind 2007; Kimm et al. 2009), but others (e.g., Pasquali et al. 2009; Vulcani et al. 2010; Muzzin et al. 2012; Koyama et al. 2013; Darvish et al. 2016; Laganá & Ulmer 2018) have found no or little dependence on either halo mass or clustercentric distance.
In this paper we make use of the analytic model described in Contini et al. (2017a, b) coupled with a merger tree constructed from a high-resolution N-body simulation. The model has been developed in order to match the stellar mass function at high redshift and predict its evolution with time, with an average () precision dex in over three orders of magnitudes in stellar mass at . Our model treats the quenching of star formation according to an exponential decay of the star formation rate with time, which depends on several galaxy properties such as stellar mass or type (satellite/central). Environment and mass quenching are hence already implemented in our model. The primary goal of this paper is to identify the main quenching mode (mass or environment) as a function of redshift, and compare our results with those available in the literature.
The manuscript is structured as follow. In Section 2 we describe the main features of our model and simulation. In Section 3 we present our results which will be fully discussed in Section 4. In Section 5 we summarize the main conclusions of our analysis. Throughout this paper we use a standard cosmology, namely: , and . Stellar masses are computed by assuming a Chabrier (2003) Initial Mass Function (IMF).
2 Methods
In the following analysis we use the prediction of an analytic model developed in Contini et al. (2017a) and refined in Contini et al. (2017b). We refer the readers to those papers for the details of the physics implemented and here we briefly describe the main features. The model has run on the merger tree of an N-Body simulation, whose characteristics are fully mentioned in Kang et al. (2012), and shortly summarized in Contini et al. (2017a).
The analytic model uses the so-called subhalo abundance matching (ShAM) technique to populate dark matter haloes with galaxies (e.g. Vale & Ostriker 2004), and its main goal is to predict the evolution of the global galaxy stellar mass function (SMF). For this purpose, the model is forced to match the observed SMF at , such that the predicted and observed SMF are the same. By reading the merger tree of the N-Body simulation, the model sorts dark matter haloes and at each time assigns a galaxy to each halo according to the stellar mass-halo mass relation valid at that particular redshift. Once galaxies are set, they evolve according to their merger histories which are given by the merger tree, and to their star formation histories. The evolution of the SFR is the novelty in our model. At (or the redshift when they are born if ) a SFR is assigned to each galaxy by means of the SFR- relation observed at that redshift, and the SFR will evolve down to the present time (unless the galaxy merges or is dispruted) according to the model described in Contini et al. (2017b), depending on the galaxy type (central or satellite). Moreover, due to gravitational interactions with their host halos, galaxies might lose a given amount of stellar mass once they are accreted in larger system (i.e. they become satellites). The model does consider stellar stripping 111Stellar stripping has been proved to be the main channel for the formation of the intracluster light in galaxy groups and clusters. For further detail on this topic, see Contini et al. (2014, 2018, 2019) and references therein. and the details of the implementation can be found in Contini et al. (2017a).
2.1 Mass and Environmental Quenching Prescriptions
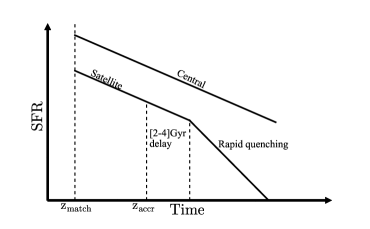
For the purposes of this paper, it is worth to fully describe the decay with time of the SFR ( model), for both central and satellite galaxies, since it basically accounts for the mass and environmental quenching. As explained above, the model first assigns an SFR to each galaxy according to the SFR relation either at or at , in case a galaxy forms after . From that redshift on, the SFR evolves according to functional forms that consider information such as type (central or satellite), stellar mass, and a quenching timescale. The star formation histories (SFHs) of centrals and satellites are treated separately. For centrals, we use a prescription very similar to the one adopted in Noeske et al. (2007):
| (1) |
where is the quenching timescale of centrals. is derived from the following equation:
| (2) |
where is the stellar mass at , random scatter assigned as a perturbation. Our prescription differs from the original one (Noeske et al. 2007) as we consider only the stellar mass (rather than the baryonic mass) and add a redshift-dependent correction.
The SFHs of satellites are modelled in a similar manner. Our approach is a revised version of the so-called delayed-then-rapid quenching mode suggested by Wetzel et al. (2013), where the SFRs of satellites evolve like those of centrals for Gyr after infall, and then quench rapidly according to a quenching timescale . We distinguish among two kinds of satellite galaxies: satellites that were accreted before , and those accreted after it. In the first case, the quenching timescale is assigned at by Equation 2 and we assume no delayed quenching. In the second case, the quenching timescale is assigned at the redshift of accretion and is assumed to be a random fraction between 0.1 and 0.5 of . Hence, the SFR of satellites evolves as described by Equation 1 if
where is randomly chosen in the range [2-4] Gyr, and as
| (3) |
thereafter. in equations 1 and 3 is set at and derived by following Equation 2 in Tomczak et al. (2016):
| (4) |
where and are in units of and respectively. As a perturbation, the model adds a random scatter in the range dex. and are given by (Equation 3 in Tomczak et al. 2016)
| (5) |
Equation 4 and the set of equations 5 altogehter define the evolution with time of the SFR- relation with a mass-dependent slope (for more details about the necessity of a mass-dependent slope see, e.g., Leja et al. 2015; Tomczak et al. 2016; Contini et al. 2017a, b). A schematic representation of how the quenching model works is shown in Figure 1.
This model considers both environmental and mass quenching. The environmental quenching is explicitly included in equations 1 and 3, and it is much faster for satellite galaxies. The mass quenching (different from the one described in Peng et al. 2010) is implemented in the calculation of the quenching timescales, such that, for both satellite and central galaxies, the quenching is faster with increasing stellar mass and redshift.
3 Results

 |
 |
In this section we present our analysis and highlight the main results, which will be fully discussed in Section 4 and compared with recent studies on the same topic. All units are h corrected, such that masses are expressed in , SFR in , specific star formation rate (SSFR, which is defined as ) in , and densities in .
For the purposes of our analysis we need to split the sample of galaxies in star forming and quiescent. The separation is quite arbitrary: color separation (e.g., Muzzin et al. 2012; Koyama et al. 2013); by using an offset from the star forming sequence (e.g., Trussler et al. 2018; Davies et al. 2019); or an SSFR cut (e.g., Wetzel et al. 2012; Laganá & Ulmer 2018; De Lucia et al. 2019). We use an SSFR cut redshift-dependent and select as star forming all galaxies with SSFR higher than , which translates in at (Franx et al. 2008; De Lucia et al. 2019).
Figure 2 shows the fraction of quiescent galaxies as a function of stellar mass as predicted by our model (solid lines), and observed data (black stars and error bars) by Wetzel et al. 2012 extracted from the SDSS Data Release 7 (Abazajian et al. 2009), for galaxies in groups/clusters of different mass as shown in the legends, at . For this plot only, in order to make a fair comparison with observed data, we use the same SSFR cut used by Wetzel et al. (2012), i.e. SSFR . Our model predictions agree fairly well with the observed data in a wide range of halo mass, from small groups (), to clusters ().
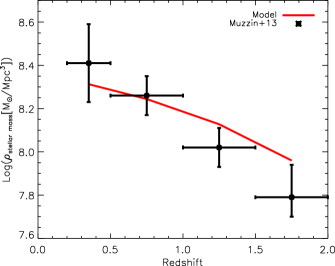
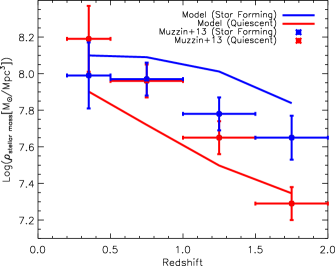
To check whether the model is also able to predict the distribution of stellar mass as a function of redshift, as it is supposed to, since it has been set to describe the evolution of the stellar mass function, in the left panel of Figure 3 we plot the stellar mass density as a function of redshift (red solid line), compared with observed data by Muzzin et al. (2013) from COSMOS/UltraVISTA survey. As expected, the model matches the observation within at high redshift, and within at . If we plot the same quantity (right panel of Figure 3) for star forming (blue line and circles) and quiescent (red line and circles), we find a mismatch between our model and observed data such that the model underpredicts the stellar mass density of quiescent galaxies and so overpredicts that of star forming galaxies, independently of redshift. This is a consequence of the fact that the model is not able, according to our definition of quiescent galaxies, to predict their fraction as a function of redshift when compared with Muzzin et al. (2013) data. It must be noted that a large part of the tension can be due to the different criteria for separating the quiescent samples: a color separation in Muzzin et al. (2013) and a redshift-dependent SSFR cut in this work. This is not going to invalidate the rest of the analysis. Indeed, as pointed out by Wetzel et al. (2012), color cuts can overestimate the fraction of quiescent galaxies because of dust reddening (see also Maller et al. 2009). In the worst case scenario, it might be that our model overestimates the SFR history of low mass galaxies (as shown by Figure 2), and this would in principle affect the environmental quenching efficiency in that stellar mass range, since low mass galaxies are generally believed to be quenched by the environment (e.g., Weisz et al. 2015; Fillingham et al. 2016). However, even if our analysis is biased for this potential problem, we believe that the results we are going to show are robust in terms of the dependence on the environment, since the quiescent fractions of low mass galaxies are low at any halo mass investigated. This potential issue is going to be a key point of a forthcoming paper in preparation.
Having in mind this caveat, we proceed our analysis by going directly to the main points of the paper, i.e. the roles of mass and environment in quenching galaxies.
3.1 Environmental Quenching
 |
 |
 |
 |
 |
 |
 |
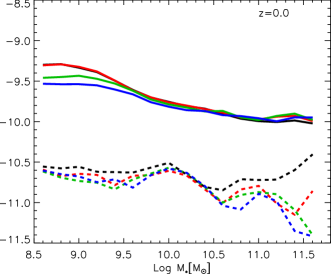 |
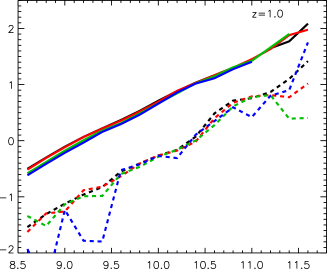
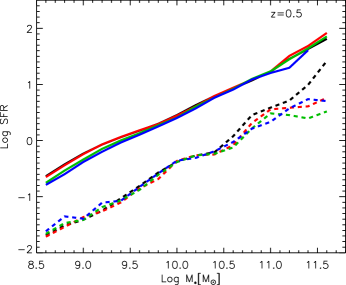
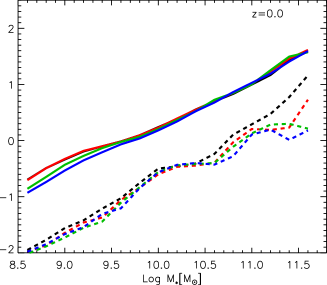
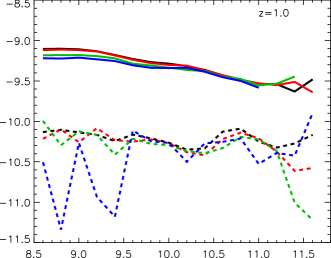
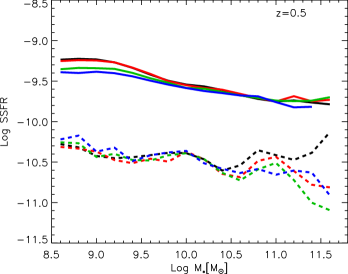
It has been pointed out by several authors (e.g., Wetzel et al. 2012; Muzzin et al. 2012; Koyama et al. 2013; Darvish et al. 2016; Laganá & Ulmer 2018) that, in order to extract the dependence of the SFR (and so SSFR) on stellar mass/environment, one has to study the quantity at fixed environment/stellar mass. In Figure 4 we focus on the role of the environment in shaping the SFR of galaxies by plotting the SFR- relation for galaxies residing in clusters of different mass (different colors), for star forming (solid lines) and quiescent (dashed lines) galaxies at different redshifts (different panels). As clearly shown by the plots, the environment (defined here as the halo mass in which galaxies reside) does not play any role in the SFR- relation for both star forming and quiescent galaxies, at any redshift investigated. This result is in perfect agreement with other studies, e.g., with Koyama et al. (2013), who studied the environmental dependence of the SFR- relation for star forming galaxies since with Hα emitters in clusters and field environments. They conclude that such relation for star forming galaxies is environment independent at any epoch, even considering dust attenuation. We support their results and extend the same conclusion to quiescent galaxies, although some environmental dependence is seen for very massive quiescent galaxies.
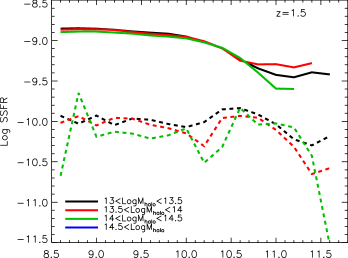
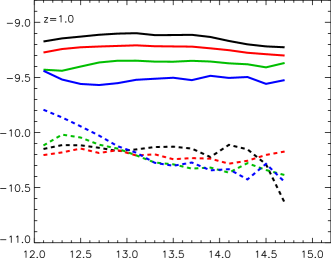
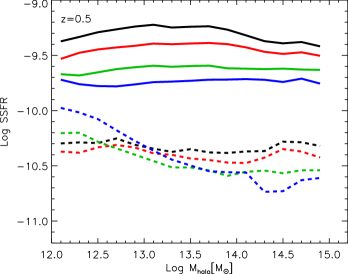
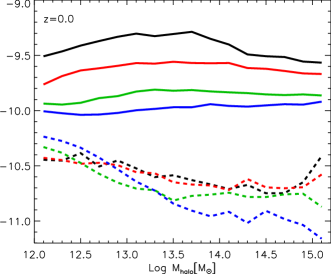
Figure 5 shows the same information shown by Figure 4, but for the SSFR. As for the SFR, the SSFR at fixed stellar mass is independent of environment, for both star forming and quiescent galaxies (although again, the very massive quiescent galaxies seem to show some dependence). Our results agree well with former studies (e.g., Muzzin et al. 2012; Laganá & Ulmer 2018). Muzzin et al. (2012) studied the effects of stellar mass and environment on the SFR and SSFR of galaxies in the redshift range for a spectroscopic selected sample of galaxies in clusters and field extracted from the Gemini Cluster Astrophysics Spectroscopic Survey. They find that, once the SSFR is plotted at fixed stellar mass, it is environment independent. It is worth noting that, however, their definition of environment is the clustercentric distance, rather than halo mass. Moreover, for the least massive () star forming galaxies, there seems to be a trend with decreasing redshift for which both the SFR and SSFR decrease with increasing halo mass, which might be a hint of environment dependence at least in that stellar mass range. However, we note that the average difference in that stellar mass range between the two extreme halo mass bins is less than 0.2 dex, i.e. within the typical SFR dispersion around the main sequence of star forming galaxies.
3.2 Mass Quenching
 |
 |
 |
 |
 |
 |
 |
 |
 |
 |
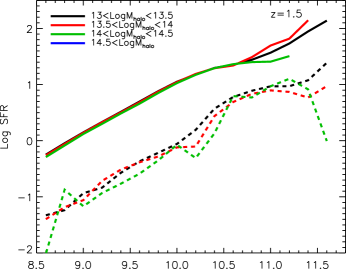
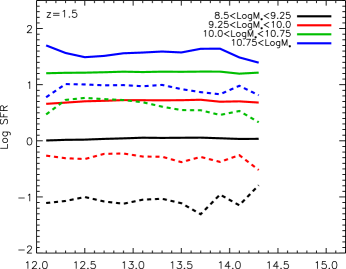
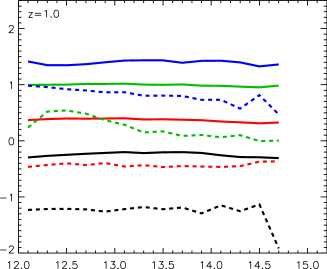
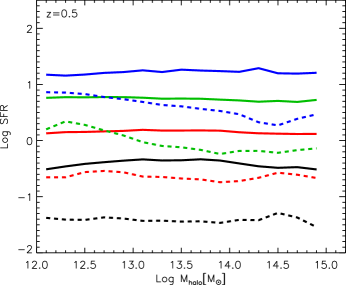
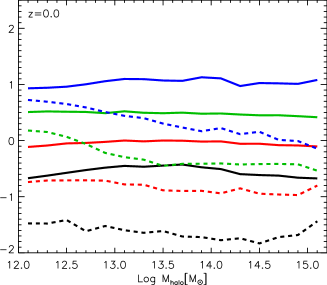
We now move the subject of the analysis to the role of mass quenching, i.e. we study the SFR and SSFR as a function of environment (defined as halo mass) at fixed stellar mass. Figure 6 shows the SFR of star forming (solid lines) and quiescent (dashed lines) galaxies as a function of halo mass, for galaxies in different stellar mass bins as indicated in the legend, and at different redshifts (different panels). The SFR is independent of halo mass (as found above) at any redshift, and the interesting feature is that, at a given halo mass, the SFR is stronlgy dependent on stellar mass, for both star forming and quiescent galaxies. Indeed, in a range of three orders of magnitude in halo mass, the average difference between the SFR of the least massive stellar mass range () and the SFR of the most massive one () at is dex for star forming galaxies, and slightly higher for quiescent galaxies.
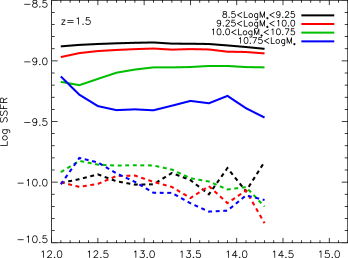
A similar trend in Figure 7 is found for the SSFR of the star forming sample, while the trend does not appear clear for the quiescent one. However, it must be noted that the average gap in SSFR for star forming galaxies at is dex. Moreover, less massive galaxies are those more star forming among all, in good agreement with previous studies (e.g., Peng et al. 2010), and in general with the downsizing scenario for which less massive galaxies quench on longer timescales (e.g., Popesso et al. 2011; Sobral et al. 2011; Fossati et al. 2017; Pintos-Castro et al. 2019; Rhee et al. 2019, in prep).
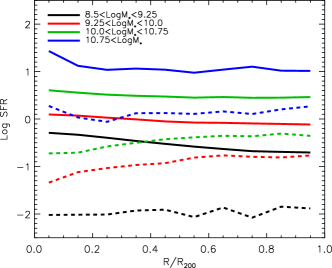
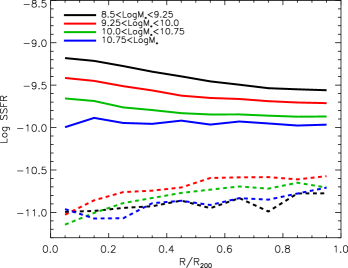
We now want to see whether the stellar mass quenching is dependent on the definition of the environment and so, instead of using the halo mass as proxy of the environment, we plot the same quantities as a function of clustercentric distance. This is done in Figure 8, which shows the SFR (left panel) and SSFR (right panel) of star forming (solid lines) and quiescent (dashed lines) galaxies as a function of distance from the halo center, for galaxies in different stellar mass bins, at . With respect to Figure 6, where the environment was defined as the mass of the cluster in which galaxies reside, the general trends and average gaps between the two extreme ranges in stellar mass do not change much (exception made for the SSFR of quiescent galaxies). The results found in Figures 6 and 8 strongly suggest that at fixed environmental conditions, may be them given by the typical halo mass or clustercentric distance, the SFR and SSFR depend on stellar mass. The predictions of our model agree well with many observational results in the literature (e.g. Muzzin et al. 2012; Koyama et al. 2013; Laganá & Ulmer 2018). We will compare our results with previous findings and fully discuss their implications in Section 4.
4 Discussion
The main goal of this work is to study the roles of mass and environmental quenching separately. Our analytic model has been developed with the purpose of describing the evolution of the galaxy stellar mass function from high to low redshift and, at the same time, to give a reasonable prediction of the evolution of the SFR- relation which agrees with that of the SMF. The model follows the star formation history of each galaxy and treat them differently depending on their type (central or satellite) and on their quenching timescale (which is mass and redshift dependent). Hence, the effects of environment and mass are robustly considered. In simple words, central galaxies actively form stars for a given time that depends on their quenching timescale, but when they become satellites, they keep forming stars as they are active centrals for a few Gyr, and experience a rapid quenching later on. Such a model predicts different roles for mass and environment in quenching galaxies, that are important at different redshifts and in a non-linear relation with the galaxy stellar mass. Below we discuss them and their implications according to the results obtained in the analysis done in sections 3.1 and 3.2.
In Figure 4 and 5 we have analysed the dependence with time of the SFR- (Fig. 4) and SSFR- (Fig. 5) relations for galaxies in different environments defined as the halo mass, from to . Our results are consistent with a scenario where the enviromental processes play a marginal effect in galaxy quenching, at any time, or they are very rapid in such a way that the net environmental quenching is not seen. This scenario is supported by a number of observational achievements (e.g., Peng et al. 2010; Sobral et al. 2011; Muzzin et al. 2012; Koyama et al. 2013; Laganá & Ulmer 2018).
Very recently Laganá & Ulmer (2018), who analyzed the relation between the SFR and SSFR as a function of environment and stellar mass for galaxies in cluster at intermediate redshift (), found no dependence of the star formation activity on environment. Moreover, they suggest that for cluster galaxies in that redshift range, mass must be the main driver of quenching. Muzzin et al. (2012) in one of their main conclusions state that, in the redshift range they probed (), “the stellar mass is the main responsible for determining the stellar populations of both star forming and quiescent galaxies, and not their environment”. In their work they used the clustercentric distance as a proxy of environment, and so, according to their Fig. 10, where they plot the SSFR as a function of the distance from the centre of the cluster (they probed also longer distances where galaxies can be classified as being in the field), quenching is not sensitive to the particular location of a given galaxy.
Their conclusion is supported by other works, such as Wetzel et al. (2012); Darvish et al. (2016); Laganá & Ulmer (2018). Darvish et al. (2016) used a sample of star forming and quiescent galaxies in the COSMOS field at , and studied the role of environment and stellar mass on galaxy properties, in particular the evolution of the SFR and SSFR with overdensity (as a proxy of the environment) as a function of redshift. For all galaxies, although at the SFR and SSFR do not depend on the overdensity (i.e. no environmental dependence), at lower redshift they strongly do. However, once star forming systems are isolated, no clear dependence on the overdensity is seen at any redshift. This is in good agreement with our results, and in general with a picture where the environment does not influence the star formation activity of star forming galaxies, but it can increase the probability of a given galaxy to become quiescent. Indeed, it has been pointed out by many authors (Patel et al. 2009; Peng et al. 2010; Darvish et al. 2016; Pintos-Castro et al. 2019) that the fraction of quiescent galaxies strongly depends on the environment, but the SFR and SSFR of star forming galaxies are independent of environment (Muzzin et al. 2012; Wetzel et al. 2012; Koyama et al. 2013; Darvish et al. 2016; Laganá & Ulmer 2018; this work).
It must be noted, however, that there are claims for an environmental dependence on the SFR also for star forming galaxies (e.g., von der Linden et al. 2010; Patel et al. 2011; Woo et al. 2013; Tran et al. 2015; Schaefer et al. 2017). As discussed previously, part of the tension can be attributed to different reasons. We have already cited the importance of the method of separating star forming from quiescent galaxies (Section 3), but different SFR indicators, the selection of the environment, and cosmic variance might play a non-negligible role. In particular the environment itself , which is still probably one the most undefined (or ill defined) galaxy property in astrophysics. Its definition ranges from halo mass in which galaxies reside, to clustercentric distance (or normalised by the virial radius of the cluster) and local overdensity within the Nth-nearest neighboor. Another possible source for the disagreement between the predictions of our model and the results of the studies quoted above might be found in the sensitivity of the model parameters, especially in the delay time and quenching timescale () of satellites. On this regard, we ran the model by applying reasonable variations (up to on the delay time , and on the random fraction ), finding no appreciable difference with the results obtained in this analysis. However, higher percentages would change the evolution of the predicted SMF and worsen its comparison with the observed one, which would go against the main goal of our model.
It appears clear from our analysis that stellar mass is the main driver of galaxy quenching, at any redshift probed in this study. This is the main conclusion of our work, which fits well with the growing observational evidence that supports it, at least down to redshift (e.g., Laganá & Ulmer 2018). The novelty of this paper is to extend mass quenching as the primary mode of shutting down star formation in star forming galaxies down to the present time.
Before concluding, it is important to quote a number of observational results that imply a connection between mass and environmental quenching. These two modes of quenching have been treated as separable by many authors (e.g., Peng et al. 2010; Muzzin et al. 2012, this work and many others), but there is a growing consensus (mainly among observers) for which environmental quenching is mass dependent in very dense environments such as the cores of galaxy clusters (Balogh et al. 2016; Darvish et al. 2016; Kawinwanichakij et al. 2017; Papovich et al. 2018; Pintos-Castro et al. 2019). All these quoted works found a mutual dependence between the mass and environmental quenching efficiencies, from (Kawinwanichakij et al. 2017), to (Pintos-Castro et al. 2019). The analysis done in this work does not allow us to either confirm or prove wrong such a (important) statement. In principle, if mass and environmental quenching are mutually dependent, this should be seen in Figure 8, where the SFR/SSFR of star forming galaxies in each stellar mass bin should depend on the distance from the cluster core, and they do not. However, mass and environmental quenching efficiencies have well precise definitions. The environmental quenching efficiency is usually defined as the increase of the fraction of quiescent galaxies at a given distance from the cluster centre with respect to the field, normalised by the fraction of star forming galaxies in the field. The mass quenching efficiency is defined in a similar way by means of a characteristic mass at which almost all galaxies at a given distance bin are star forming. The information in Figure 8 is then not enough to make a fair comparison with the works cited above. We aim to address this point with a full analysis in a forthcoming paper.
5 Conclusions
We have studied the roles of stellar mass and environment in quenching galaxies by taking advantage of an analytic model of galaxy formation. The model was set in order to match the evolution of the global stellar mass function from high to low redshift and, at the same time, to give reasonable predictions of the star formation history of galaxies. From the analysis done in this work we can conclude the following:
-
•
The SFR/SSFR- relations are independent of the environment at any redshift probed, , for both star forming and quiescent galaxies.
-
•
The SFR- relation strongly depends on stellar mass at any redshift probed, for both star forming and quiescent galaxies.
-
•
The SSFR- relation strongly depends on stellar mass at any redshift probed for star forming galaxies, while the trend is not clear for the quiescent sample.
-
•
Overall, less massive galaxies are more star forming, in agreement with the downsizing scenario for which less massive galaxies quench on longer timescales.
-
•
The SFR and SSFR are strongly dependent on stellar mass even when the distance from the cluster core is used as a proxy for the environment (rather than the halo mass).
All these conclusions put together draw a picture where stellar mass is the main driver of galaxy quenching at any redshift, not only at as generally claimed in the literature. The role of environment is marginal: environmental processes must act very fast such that they do not have an effect on the star formation activity of star forming galaxies, but can increase the probability of a galaxy to become quiescent.
In a forthcoming paper we will address the point of the mutual dependence of the mass and environment quenching efficiencies by looking directly at the star forming and quiescent fractions in galaxy clusters, and compare the predictions of our model with the newest observational evidence.
Acknowledgements
This work is supported by the National Key Research and Development Program of China (No. 2017YFA0402703), by the National Natural Science Foundation of China (Key Project No. 11733002), the Korean National Research Foundation (NRF-2017R1A2A05001116), and the NSFC grant (11825303, 11861131006). E.C. acknowledges support from the Faculty of the European Space Astronomy Centre (ESAC) - Funding reference 497.
References
- Abazajian et al. (2009) Abazajian, K. N., Adelman-McCarthy, J. K., Agüeros, M. A., et al. 2009, ApJS, 182, 543
- Baldry et al. (2004) Baldry, I. K., Glazebrook, K., Brinkmann, J., et al. 2004, ApJ, 600, 681
- Baldry et al. (2006) Baldry, I. K., Balogh, M. L., Bower, R. G., et al. 2006, MNRAS, 373, 469
- Balogh et al. (2000) Balogh, M. L., Navarro, J. F., & Morris, S. L. 2000, ApJ, 540, 113
- Balogh et al. (2004) Balogh, M., Eke, V., Miller, C., et al. 2004, MNRAS, 348, 1355
- Balogh et al. (2016) Balogh, M. L., McGee, S. L., Mok, A., et al. 2016, MNRAS, 456, 4364
- Bamford et al. (2009) Bamford, S. P., Nichol, R. C., Baldry, I. K., et al. 2009, MNRAS, 393, 1324
- Blanton et al. (2003) Blanton, M. R., Hogg, D. W., Bahcall, N. A., et al. 2003, ApJ, 594, 186
- Blanton & Berlind (2007) Blanton, M. R., & Berlind, A. A. 2007, ApJ, 664, 791
- Bremer et al. (2018) Bremer, M. N., Phillipps, S., Kelvin, L. S., et al. 2018, MNRAS, 476, 12
- Brinchmann et al. (2004) Brinchmann, J., Charlot, S., White, S. D. M., et al. 2004, MNRAS, 351, 1151
- Cassata et al. (2008) Cassata, P., Cimatti, A., Kurk, J., et al. 2008, A&A, 483, L39
- Chabrier (2003) Chabrier, G. 2003, PASP, 115, 763
- Cicone et al. (2014) Cicone, C., Maiolino, R., Sturm, E., et al. 2014, A&A, 562, A21
- Contini et al. (2014) Contini, E., De Lucia, G., Villalobos, Á., & Borgani, S. 2014, MNRAS, 437, 3787
- Contini et al. (2017a) Contini, E., Kang, X., Romeo, A. D., & Xia, Q. 2017a, ApJ, 837, 27
- Contini et al. (2017b) Contini, E., Kang, X., Romeo, A. D., Xia, Q., & Yi, S. K. 2017b, ApJ, 849, 156
- Contini et al. (2018) Contini, E., Yi, S. K., & Kang, X. 2018, MNRAS, 479, 932
- Contini et al. (2019) Contini, E., Yi, S. K., & Kang, X. 2019, ApJ, 871, 24
- Cooper et al. (2010) Cooper, M. C., Gallazzi, A., Newman, J. A., & Yan, R. 2010, MNRAS, 402, 1942
- Croton et al. (2006) Croton, D. J., Springel, V., White, S. D. M., et al. 2006, MNRAS, 365, 11
- Dalla Vecchia & Schaye (2008) Dalla Vecchia, C., & Schaye, J. 2008, MNRAS, 387, 1431
- Darvish et al. (2016) Darvish, B., Mobasher, B., Sobral, D., et al. 2016, ApJ, 825, 113
- Davies et al. (2019) Davies, L. J. M., Robotham, A. S. G., Lagos, C. d. P., et al. 2019, MNRAS, 483, 5444
- Dekel & Silk (1986) Dekel, A., & Silk, J. 1986, ApJ, 303, 39
- De Lucia et al. (2019) De Lucia, G., Hirschmann, M., & Fontanot, F. 2019, MNRAS, 482, 5041
- De Propris et al. (2004) De Propris, R., Colless, M., Peacock, J. A., et al. 2004, MNRAS, 351, 125
- Dressler (1980) Dressler, A. 1980, ApJ, 236, 351
- Fabian (2012) Fabian, A. C. 2012, ARA&A, 50, 455
- Fang et al. (2013) Fang, J. J., Faber, S. M., Koo, D. C., & Dekel, A. 2013, ApJ, 776, 63
- Farouki & Shapiro (1981) Farouki, R., & Shapiro, S. L. 1981, ApJ, 243, 32
- Fillingham et al. (2016) Fillingham, S. P., Cooper, M. C., Pace, A. B., et al. 2016, MNRAS, 463, 1916
- Fossati et al. (2017) Fossati, M., Wilman, D. J., Mendel, J. T., et al. 2017, ApJ, 835, 153
- Franx et al. (2008) Franx, M., van Dokkum, P. G., Förster Schreiber, N. M., et al. 2008, ApJ, 688, 770
- Gallazzi et al. (2008) Gallazzi, A., Brinchmann, J., Charlot, S., & White, S. D. M. 2008, MNRAS, 383, 1439
- Gunn & Gott (1972) Gunn, J. E., & Gott, J. R., III 1972, ApJ, 176, 1
- Kang et al. (2012) Kang, X., Li, M., Lin, W. P., & Elahi, P. J. 2012, MNRAS, 422, 804
- Kauffmann et al. (2003) Kauffmann, G., Heckman, T. M., White, S. D. M., et al. 2003, MNRAS, 341, 33
- Kauffmann et al. (2004) Kauffmann, G., White, S. D. M., Heckman, T. M., et al. 2004, MNRAS, 353, 713
- Kawinwanichakij et al. (2017) Kawinwanichakij, L., Papovich, C., Quadri, R. F., et al. 2017, ApJ, 847, 134
- Kimm et al. (2009) Kimm, T., Somerville, R. S., Yi, S. K., et al. 2009, MNRAS, 394, 1131
- Koyama et al. (2013) Koyama, Y., Smail, I., Kurk, J., et al. 2013, MNRAS, 434, 423
- Laganá & Ulmer (2018) Laganá, T. F., & Ulmer, M. P. 2018, MNRAS, 475, 523
- Larson (1974) Larson, R. B. 1974, MNRAS, 169, 229
- Larson et al. (1980) Larson, R. B., Tinsley, B. M., & Caldwell, C. N. 1980, ApJ, 237, 692
- Leja et al. (2015) Leja, J., van Dokkum, P. G., Franx, M., & Whitaker, K. E. 2015, ApJ, 798, 115
- Maller et al. (2009) Maller, A. H., Berlind, A. A., Blanton, M. R., & Hogg, D. W. 2009, ApJ, 691, 394
- Moore et al. (1996) Moore, B., Katz, N., Lake, G., Dressler, A., & Oemler, A. 1996, Nature, 379, 613
- Moore et al. (1999) Moore, B., Lake, G., Quinn, T., & Stadel, J. 1999, MNRAS, 304, 465
- Muzzin et al. (2012) Muzzin, A., Wilson, G., Yee, H. K. C., et al. 2012, ApJ, 746, 188
- Muzzin et al. (2013) Muzzin, A., Marchesini, D., Stefanon, M., et al. 2013, ApJ, 777, 18
- Noeske et al. (2007) Noeske, K. G., Weiner, B. J., Faber, S. M., et al. 2007, ApJ, 660, L43
- Pallero et al. (2018) Pallero, D., Gómez, F. A., Padilla, N. D., et al. 2018, arXiv:1812.08802
- Papovich et al. (2018) Papovich, C., Kawinwanichakij, L., Quadri, R. F., et al. 2018, ApJ, 854, 30
- Pasquali et al. (2009) Pasquali, A., van den Bosch, F. C., Mo, H. J., Yang, X., & Somerville, R. 2009, MNRAS, 394, 38
- Patel et al. (2009) Patel, S. G., Holden, B. P., Kelson, D. D., Illingworth, G. D., & Franx, M. 2009, ApJ, 705, L67
- Patel et al. (2011) Patel, S. G., Kelson, D. D., Holden, B. P., Franx, M., & Illingworth, G. D. 2011, ApJ, 735, 53
- Peng et al. (2010) Peng, Y.-j., Lilly, S. J., Kovač, K., et al. 2010, ApJ, 721, 193
- Peng et al. (2012) Peng, Y.-j., Lilly, S. J., Renzini, A., & Carollo, M. 2012, ApJ, 757, 4
- Pintos-Castro et al. (2019) Pintos-Castro, I., Yee, H. K. C., Muzzin, A., Old, L., & Wilson, G. 2019, arXiv:1904.00023
- Poggianti et al. (2017) Poggianti, B. M., Moretti, A., Gullieuszik, M., et al. 2017, ApJ, 844, 48
- Popesso et al. (2011) Popesso, P., Rodighiero, G., Saintonge, A., et al. 2011, A&A, 532, A145
- Schaefer et al. (2017) Schaefer, A. L., Croom, S. M., Allen, J. T., et al. 2017, MNRAS, 464, 121
- Sobral et al. (2011) Sobral, D., Best, P. N., Smail, I., et al. 2011, MNRAS, 411, 675
- Tomczak et al. (2016) Tomczak, A. R., Quadri, R. F., Tran, K.-V. H., et al. 2016, ApJ, 817, 118
- Tran et al. (2015) Tran, K.-V. H., Nanayakkara, T., Yuan, T., et al. 2015, ApJ, 811, 28
- Trussler et al. (2018) Trussler, J., Maiolino, R., Maraston, C., et al. 2018, arXiv:1811.09283
- Vale & Ostriker (2004) Vale, A., & Ostriker, J. P. 2004, MNRAS, 353, 189
- Vulcani et al. (2010) Vulcani, B., Poggianti, B. M., Finn, R. A., et al. 2010, ApJ, 710, L1
- Weinmann et al. (2006) Weinmann, S. M., van den Bosch, F. C., Yang, X., & Mo, H. J. 2006, MNRAS, 366, 2
- Weisz et al. (2015) Weisz, D. R., Dolphin, A. E., Skillman, E. D., et al. 2015, ApJ, 804, 136
- Wetzel et al. (2012) Wetzel, A. R., Tinker, J. L., & Conroy, C. 2012, MNRAS, 424, 232
- Wetzel et al. (2013) Wetzel, A. R., Tinker, J. L., Conroy, C., & van den Bosch, F. C. 2013, MNRAS, 432, 336
- Woo et al. (2013) Woo, J., Dekel, A., Faber, S. M., et al. 2013, MNRAS, 428, 3306
- Wuyts et al. (2011) Wuyts, S., Förster Schreiber, N. M., van der Wel, A., et al. 2011, ApJ, 742, 96
- van den Bosch et al. (2008) van den Bosch, F. C., Aquino, D., Yang, X., et al. 2008, MNRAS, 387, 79
- van der Wel et al. (2014) van der Wel, A., Franx, M., van Dokkum, P. G., et al. 2014, ApJ, 788, 28
- von der Linden et al. (2010) von der Linden, A., Wild, V., Kauffmann, G., White, S. D. M., & Weinmann, S. 2010, MNRAS, 404, 1231