Stabilized Pair Density Wave via Nanoscale Confinement of Superfluid 3He
Abstract
Superfluid 3He under nanoscale confinement has generated significant interest due to the rich spectrum of phases with complex order parameters that may be stabilized. Experiments have uncovered a variety of interesting phenomena, but a complete picture of superfluid 3He under confinement has remained elusive. Here, we present phase diagrams of superfluid 3He under varying degrees of uniaxial confinement, over a wide range of pressures, which elucidate the progressive stability of both the -phase, as well as a growing region of stable pair density wave (PDW) state.
pacs:
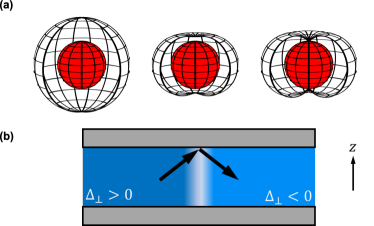
Valid PACS appear hereWhile bulk superfluid 3He is exceptionally well understood, both theoretically and experimentally Vollhardt13 , much is unknown when confinement approaches the scale of the superfluid coherence length. In the bulk, only two phases are stable, the so-called and phases. The -phase—with nodes in the gap, as shown in Fig. 1(a)—is stabilized by strong coupling effects at high pressures Rainer76 , whereas the -phase—with its isotropic gap—dominates the phase diagram (Fig. 4(a)). When confined via engineered structures, the phase diagram is expected to be altered significantly. Due to the unconventional -wave pairing in 3He, non-magnetic scattering at surfaces is sufficient to break Cooper pairs. Thus surface scattering serves to distort and suppress the order parameter. In fact, under confinement the -phase is altered to become the planar-distorted -phase, see Eq. (6), with a suppressed gap at antipodal points on the Fermi surface (Fig. 1(a)). Early experiments to explore the effects of confinement resulted in a variety of observations, including hints of a new phase transition Xu90 , the complete elimination of the -phase in favor of the -phase Freeman90 , and modification of the relative stability of the and -phases Miyawaki00 ; Kawasaki04 .
It was realized by Vorontsov and Sauls that this order parameter suppression due to surface scattering could be minimized by the formation of domain walls between two orientations of planar-distorted -phases, Fig. 1(b), when the confinement lies in a particular range of length scales Vorontsov05 . Alignment of these domains walls was later predicted to form the basis of an ordered superfluid phase, deemed the stripe phase Vorontsov07 . The stripe phase is an example of a pair density wave (PDW), a state that breaks both gauge and translational symmetries and is now believed to play an important role in the cuprate superconductors Agterberg19 . The observation of such a PDW state in superfluid 3He could lead to a deeper understanding of this state, and influence understanding of PDWs in unconventional superconductors Holmvall18 .
The prediction of Vorontsov and Sauls stimulated numerous experimental searches, including nuclear magnetic resonance (NMR) Levitin13 ; Levitin19 , shear micromechanical resonators Zheng16 , and torsional oscillators Zhelev17 —with spatial confinements of 700 nm Levitin13 , 1.1 m Levitin19 ; Zhelev17 , and 1.25 m Zheng16 . Most conclusively, NMR studies have simultaneously observed signals from two different planar-distorted -phases. Despite this observation, they have concluded that their measurements are inconsistent with the stripe phase, and instead have suggested another PDW with soft domain walls between localized puddles of planar-distorted -phase, which they have termed the polka-dot phase Levitin19 . To date, it is unclear if these results represent the true thermodynamic phase diagram of superfluid 3He under uniform confinement, or if they remain complicated by non-uniformities in the structures, e.g., bowing induced by pressurization. Here, in an effort to resolve this question, we use microfabricated fourth-sound resonators Rojas15 ; Souris17 , which are sensitive indicators of the superfluid fraction, to explore the generation of spatial order in superfluid 3He. These devices are fully immersed in liquid and therefore are mechanically unaffected by pressurization of the 3He. This allows us to explore the phase diagram up to 28 bar, revealing signatures of PDW in the phase diagram that have never been observed. Furthermore, we simultaneously measure three devices with varying degrees of confinement, in order to map the effect of confinement on the stability of the PDW state.

The devices used to probe the superfluid phases under confinement, shown in Fig. 2(a), are microfabricated from single-crystal quartz, with similar devices having been previously demonstrated to selectively probe the superfluid fraction within a nanoscale channel of 4He Rojas15 . They work by exciting a mechanical resonance in the fluid upon excitation by a voltage source, Fig. 2(b). This causes a deflection of the two electrodes—on opposite sides of the nanoscale cavity—via a strong electrostatic force due to the small gap between the electrodes. As a result of the deflection, fluid in the nanoscale channels is pushed out, which—when driven on resonance—excites a Helmholtz mechanical mode. In the devices measured here, with channel depths of nm, nm, and nm, the normal fluid is viscously clamped Kojima75 , hence the frequency of the Helmholtz mode is related to the superfluid fraction :
| (1) |
represents terms that involve measured geometric factors, and the calibrated spring constant of the plate and helium Rojas15 . In this work, we have extended this to superfluid 3He by constructing an adiabatic nuclear demagnetization stage and 3He sample cell Pollanen12 ; Krusius78 , described further in the Supplemental Material SM .

To drive the superfluid mechanical mode, we use a chirped pulse scheme to excite all three devices simultaneously and acquire their response in the time domain Doolin19 . Fast Fourier transforming this time domain data allows us to rapidly acquire the frequency response of the Helmholtz resonators, and enables mapping of their frequencies during adiabatic nuclear demagnetization temperature sweeps. An example at 12.7 bar is shown in Fig. 2(c). Three superfluid-mechanical resonances are seen, with Fano-like character due to the measurement scheme, as shown in the inset. The highest frequency resonance corresponds to the 1067 nm device and is assumed to have a temperature dependence that is indiscernible from that of the bulk superfluid fraction Parpia85 ; Wu13 , as was found in Ref. Zhelev17 . We use the temperature dependence of the 1067 nm device as a sensitive local secondary thermometer, which is referenced to both a melting curve thermometer on the same experimental stage and a tuning fork Carless83 ; Blaauwgeers07 immersed in the same sample cell. We note that we have performed sweeps of the drive amplitude, and are in a linear response regime in all measurements. This also serves to verify that our drive does not cause heating of the liquid 3He. Thermal effects are discussed further in the Supplemental Material SM .
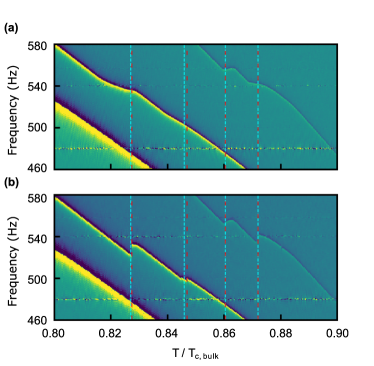
The temperature dependence of the superfluid fraction is known to be an excellent indicator of phase transitions Zhelev17 . We show in Fig. 3 portions of temperature sweeps, at 22 bar, demonstrating two phase transitions per device—suggesting the existence of three stable superfluid phases. This observation is quite startling, not only as there are only two phases observed in bulk 3He (in zero magnetic field), but also that two distinct first-order phase transitions were not observed in previous NMR or torsional oscillator experiments. Instead, those experiments found a single first-order phase transition that occurred over a broad temperature range Zhelev17 , which they attributed to inhomogeneous thickness of the superfluid from bowed devices. Recent NMR experiments at low pressure in a 1.1 m device do not show a broad phase transition, yet also do not observe two first-order phase transitions Levitin19 . This is reasonable, considering the complete phase diagram that we show next.
To determine the phase diagram under confinement, and the relation between our data and previous observations, we have explored these phase transitions over a wide pressure range, from 0.35 bar to 28 bar, and compiled the thermodynamic warming transitions in Fig. 4. Note, we discuss the lack of temperature hysteresis between warming and cooling below. In panels (b–d) of Fig. 4, the experimentally determined phase transitions are shown as circles: blue for the transition to the normal state, and the open and filled green circles for kinks in the superfluid fraction. Smooth fits to the data points delineate colored regions, and hence regions of stable phases.
To understand these results, we theoretically model the system using a Ginzburg-Landau approach. Superfluid 3He is a spin-triplet -wave superfluid characterized by the Cooper pair amplitude
| (2) |
between fermions of spin and relative momentum , where are the Pauli spin matrices and is a matrix order parameter. We numerically solve the Ginzburg-Landau equations for in a slab geometry following the formalism of Refs. Wiman15 ; Wiman16 which incorporates confinement effects Ho1988 as well as strong coupling corrections Choi07 . The depairing effect of surface roughness Ambegaokar74 on the cavity walls is taken into account through diffuse scattering boundary conditions. The order parameter profile is assumed to be -dependent to account for confinement effects, but translationally invariant in the plane of the device (- plane). Two such uniform phases are known to be stabilized under confinement, the planar-distorted -phase with order parameter
| (6) |
and the -phase, with order parameter
| (10) |
Strong coupling corrections are necessary to account for the stability of the -phase relative to the planar phase, i.e., Eq. (6) with vanishing -component of the order parameter, .
We include the known bulk phase diagram in Fig. 4(a) for comparison, with the -phase in blue and the -phase in pink. The leftmost black curve in panels (b–d) is the calculated phase boundary between the planar-distorted -phase and the -phase, while the black curve on the right is the calculated pressure-dependent critical temperature . The excellent agreement between theory and experiment in panels (b–c) and to a lesser extent (d), as well as comparison with the bulk phase diagram, unambiguously suggest the blue and pink regions in the phase diagrams under confinement are the planar-distorted -phase and -phase, respectively. However, under the assumption of translational invariance in the - plane, the Ginzburg-Landau analysis does not capture the experimentally observed grey region that lies between the two uniform phases.
In light of recent experimental and theoretical work, a clear candidate for this intermediate region is a spatially inhomogeneous phase exhibiting domain walls across which the -component of the superfluid order parameter changes sign, see Fig. 1(b). While in bulk 3He such domain walls Salomaa88 ; Silveri14 are not energetically favorable, for device thicknesses of order the coherence length , the energy cost of creating a domain wall can be compensated by the reduction in gradient energy associated with surface pairbreaking. Everywhere on the domain wall, vanishes due to the change of sign and is thus uniform along the confinement direction, which reduces this energy. For sufficiently thin devices the gain in energy from the reduction in surface pairbreaking outweighs the cost from domain wall surface tension, and domain walls are favored. The enhanced stability of the grey region with increasing degree of confinement, observed in Fig. 4(b–d) and predicted in Ref. 30, thus further supports the interpretation of this region as a spatially inhomogeneous phase.
It is noteworthy that such a spatially inhomogeneous phase can only exist between the and -phases, as discussed in Ref. Wiman16 , strengthening our assignment of the intermediate phase as a PDW state. The stabilization of domain walls in the vicinity of the - phase boundary can be understood from the following generic argument. Upon approaching the - phase boundary from the planar-distorted -phase, is gradually reduced. Deep in the planar-distorted -phase, suppressing on a domain wall is not energetically favorable, but becomes increasingly so upon approach to the transition. In the -phase, is uniformly zero due to the different symmetry of the phase, see Eq. (10), thus surface pairbreaking is automatically minimized without the need for domain walls. Near the - phase boundary, the free energies of the -phase (with ) and -phase (with ) are nearly degenerate, and an inhomogeneous state with a regular arrangement of domain walls is a natural way to resolve the competition between the two different bulk ordering tendencies for .
While this argument alone cannot predict the optimal spatial arrangement of domain walls, previous studies strongly suggest periodic patterns of ordering are favored. Explicit calculations Vorontsov07 ; Wiman16 ; Aoyama16 using either quasiclassical Green’s functions or the Ginzburg-Landau approach, and for a variety of boundary conditions ranging from specular to maximally pairbreaking, indicate a periodic arrangement of domain walls forming a unidirectional PDW phase (stripe phase) can be stabilized at low pressures under confinement near the - phase boundary for slab thicknesses . However, NMR studies Levitin19 favor an interpretation in terms of a two-dimensional PDW phase—the polka-dot phase—with the symmetry of a square or triangular lattice. In the pressure range 0–15 bar the PDW phase appears in our devices in a temperature range such that , in broad agreement with theory expectations for the stripe phase, but unexpectedly persists at pressures up to 30 bar, at least in the two thinnest devices.
Our current experiments cannot resolve the stripe/polka-dot debate, but do indicate that the PDW state observed here is thermodynamically stable from the fact that it is seen reproducibly both on warming and on cooling, as shown for example in Fig. 3. It is also noteworthy that we observe no significant hysteresis in the temperatures of phase transitions between the -phase and the PDW state, nor between the PDW state and the planar-distorted -phase, despite the fact that these are first-order phase transitions for which supercooling would be expected—especially as significant supercooling between the and -phases is routinely observed in bulk 3He. The lack of hysteresis is consistent with recent torsional oscillator experiments Zhelev17 . In that work, the existence of an unseen spatially modulated phase was suggested to account for the lack of hysteresis. This can be understood by the presence of an intermediate phase between the and -phases (the PDW) lowering the nucleation barrier between these states Tye11 .
Finally, we note that we have observed an anomalous region in the 636 nm device between pressures of 0.95–4.10 bar, as seen in the light pink region of Fig. 4(d). Whereas the rest of our phase transitions are fully reproducible, in this region we find that on some runs we observe transitions to the -phase as expected, yet on occasion we find that the transition occurs at a reduced temperature. Further experiments are required to elucidate the behavior of this region and will be the subject of future work.
In conclusion, we have mapped the phase diagrams of superfluid 3He under nanoscale confinement and have demonstrated the existence of a thermodynamically-stable PDW state, breaking both gauge and translational symmetry. The stability of both the -phase and the PDW state grow with increasing confinement, consistent with, and serving to reconcile, previous experiments, e.g., the stabilization of the -phase with increasing confinement in Refs. Freeman90 ; Miyawaki00 ; Kawasaki04 . Nonetheless, questions remain. What is the nature of the anomalous region at low pressure in the 636 nm device? Furthermore, as the Helmholtz resonators excite longitudinal (fourth) sound, can we use these to find spectroscopic signatures of the PDW, i.e., order-parameter collective modes Davis06 ? Finally, our Helmholtz resonators may be capable of observing evidence of Majorana fermions associated with Andreev bound states at surfaces Volovik09 ; Chung09 ; Wu13 ; Davis08 ; Murakawa11 and at the domain walls that make up the PDW observed here, through the superfluid fraction Wu13 or collective modes Park15 ; Mizushima18 —a tantalizing possibility for future experiments.
Acknowledgements.
Authors acknowledge useful conversations with J.A. Sauls, thank W.P. Halperin and Y. Lee for generous assistance with melting curve thermometry, and thank E. Varga for his flow simulation. This work was supported by the University of Alberta, Faculty of Science and Theoretical Physics Institute; the Natural Sciences and Engineering Research Council, Canada (Grants Nos. RGPIN-04523-16, RGPIN-2014-4608, DAS-492947-16, and CREATE-495446-17); the Canada Foundation for Innovation; the Canada Research Chair Program; and the Canadian Institute for Advanced Research. A.S. and V.V. contributed equally to this work.References
- (1) D. Vollhardt and P. Wölfle, The Superfluid Phases of Helium 3 (Dover Publications, Mineola, NY, 2013).
- (2) D. Rainer and J.W. Serene, Phys. Rev. B 13, 4745 (1976).
- (3) J. Xu and B.C. Crooker, Phys. Rev. Lett. 65, 3005 (1990).
- (4) M.R. Freeman and R.C. Richardson, Phys. Rev. B 41, 11011 (1990).
- (5) S. Miyawaki, K. Kawasaki, H. Inaba, A. Matsubara, O. Ishikawa, T. Hata, and T. Kodama, Phys. Rev. B 62, 5855 (2000).
- (6) K. Kawasaki, T. Yoshida, M. Tarui, H. Nakagawa, H. Yano, O. Ishikawa, and T. Hata, Phys. Rev. Lett. 93, 105301 (2004).
- (7) A.B. Vorontsov and J.A. Sauls, J. Low Temp. Phys. 138, 283 (2005).
- (8) A.B. Vorontsov and J.A. Sauls, Phys. Rev. Lett. 98, 045301 (2007).
- (9) D.F. Agterberg, J.C. Séamus Davis, S.D. Edkins, E. Fradkin, D.J. Van Harlingen, S.A. Kivelson, P.A. Lee, L. Radzihovsky, J.M. Tranquada, and Y. Wang, arXiv:1904.09687.
- (10) P. Holmvall, A.B. Vorontsov, M. Fogelström, and T.Löfwander Nature Commun. 9, 2190 (2018).
- (11) L.V. Levitin, R.G. Bennett, A. Casey, B. Cowan, J. Saunders, D. Drung, Th. Schurig, and J.M. Parpia, Science 340, 841 (2013).
- (12) L.V. Levitin, B. Yager, L. Sumner, B. Cowan, A.J. Casey, J. Saunders, N. Zhelev, R.G. Bennett, and J.M. Parpia, Phys. Rev. Lett. 122, 085301 (2019).
- (13) P. Zheng, W.G. Jiang, C.S. Barquist, Y. Lee, and H.B. Chan, Phys. Rev. Lett. 117, 195301 (2016).
- (14) N. Zhelev, T.S. Abhilash, E.N. Smith, R.G. Bennett, X. Rojas, L. Levitin, J. Saunders, and J.M. Parpia, Nat. Commun. 8, 15963 (2017).
- (15) X. Rojas and J.P. Davis, Phys. Rev. B 91, 024503 (2015).
- (16) F. Souris, X. Rojas, P.H. Kim, and J.P. Davis, Phys. Rev. Applied 7, 044008 (2017).
- (17) See appendix for details on cryogenic apparatus, device geometry, thermal effects, and includes Refs. 18; 19; 1; 20; 21; 22; 23.
- (18) P.L. Kapitza, J. Phys. USSR 4, 181 (1941).
- (19) I. L. Bekarevich, and I. M. Khalatnikov. J. Low Temp. Phys. 12, 1187 (1961).
- (20) A. C. Anderson, J. I. Connolly, and J. C. Wheatley, Phys. Rev. 135, A910 (1964).
- (21) H. E. Hall, J. R. Hook. Progress in Low Temp. Phys. 9, 143 (1986).
- (22) T. Haard, Ph.D. thesis, Northwestern University, 2001.
- (23) J. P. Harrison. J. Low Temp. Phys. 37, 467 (1979).
- (24) H. Kojima, D.N. Paulson, and J.C. Wheatley, J. Low Temp. Phys. 21, 283 (1975).
- (25) J. Pollanen, Ph.D. thesis, Northwestern University, 2012.
- (26) M. Krusius, D.N. Paulson, and J.C. Wheatley, Cryogenics 18, 649 (1978).
- (27) C. Doolin, Ph.D. thesis, University of Alberta, 2019.
- (28) D.D. Osheroff, R.C. Richardson, and D.M. Lee, Phys. Rev. Lett. 28, 885 (1972).
- (29) R.C. Richardson, Nobel Lectures, Physics 1996-2000, Editor G. Ekspong, World Scientific Publishing Co., Singapore, 2002.
- (30) J.J. Wiman and J.A. Sauls, J. Low Temp. Phys. 184, 1054 (2016).
- (31) S.-H.Henry Tye and D. Wohns, Phys. Rev. B 84, 184518 (2011).
- (32) H. Choi, J.P. Davis, J. Pollanen, T. M. Haard, and W. P. Halperin, Phys. Rev. B 75, 174503 (2007).
- (33) Y.-H. Li and T.-L. Ho, Phys. Rev. B 38, 2362 (1988).
- (34) J.M. Parpia, D.G. Wildes, J. Saunders, E.K. Zeise, J.D. Reppy, and R.C. Richardson, J. Low Temp. Phys. 61, 337 (1985).
- (35) H. Wu and J.A. Sauls, Phys. Rev. B 88, 184506 (2013).
- (36) R. Blaauwgeers, M. Blazkova, M. Človečko, V.B. Eltsov, R. de Graaf, J. Hosio, M. Krusius, D. Schmoranzer, W. Schoepe, L. Skrbek, P. Skybam, R.E. Solntsev, and D.E. Zmeev, J. Low Temp. Phys. 146, 537 (2007).
- (37) D.C. Carless, H.E. Hall, and J.R. Hook, J. Low Temp. Phys. 50, 6O5 (1983).
- (38) J.J. Wiman and J.A. Sauls, Phys. Rev. B 92, 144515 (2015).
- (39) V. Ambegaokar, P.G. de Gennes, and D. Rainer, Phys. Rev. A 9, 2676 (1974).
- (40) M.M. Salomaa and G.E. Volovik, Phys. Rev. B 37, 9298 (1988).
- (41) M. Silveri, T. Turunen, and E. Thuneberg, Phys. Rev. B 90, 184513 (2014).
- (42) K. Aoyama, J. Phys. Soc. Jpn. 85, 094604 (2016).
- (43) J.P. Davis, H. Choi, J. Pollanen, and W.P. Halperin, Phys. Rev. Lett. 97, 115301 (2006).
- (44) G.E. Volovik, JETP Lett. 90, 398 (2009).
- (45) S.B. Chung and S.C. Zhang, Phys. Rev. Lett. 103, 235301 (2009).
- (46) J.P. Davis, J. Pollanen, H. Choi, J.A. Sauls, W.P. Halperin, and A.B. Vorontsov, Phys. Rev. Lett. 101, 085301 (2008).
- (47) S. Murakawa, Y. Wada, Y. Tamura, M. Wasai, M. Saitoh, Y. Aoki, R. Nomura, Y. Okuda, Y. Nagato, M. Yamamoto, S. Higashitani, and K. Nagai, J. Phys. Soc. Jpn. 80, 013602 (2011).
- (48) Y.J. Park, S.B. Chung, and J. Maciejko, Phys. Rev. B 91, 054507 (2015).
- (49) T. Mizushima and J.A. Sauls, arXiv:1801.02277.
Appendix A: Low-temperature setup
Our low-temperature setup consists of an adiabatic nuclear demagnetization stage, incorporated into a commercial dilution fridge. The nuclear stage was made from high-purity copper, and vacuum annealed after machining. The copper stage is attached to the microkelvin plate, where the experimental cell and melting curve thermometer are mounted, via a superconducting heat switch made of high-purity indium wires. The sample cell housing the liquid 3He and Helmholtz resonators is designed after Ref. Pollanen12 , with sintered copper powder heat exchangers Krusius78 of total surface area 84 m2. With 4He impurities of 1% in our 3He, this results in a surface coverage of of a monolayer, consistent with diffuse boundary scattering Freeman90 and the results of our Ginzburg-Landau calculations in the main text.
Appendix B: Device geometry
The Helmholtz resonator geometry is depicted in Figure SM 1. The basin diameter, , channel width, , and channel length (after bonding), , are common to all three devices. The devices differ by their etch depth, and hence helium confinement (see Table 1).
|
|
|
|
|
|
|
|
|
|
|||||||||||||||||||||||||||||
| 1 | 7.00 | 6.80 | 1.60 | 1.40 | 1.38 | 59 | 348 | 577 | 636 | |||||||||||||||||||||||||||||
| 2 | 7.00 | 6.90 | 1.60 | 1.50 | 1.38 | 61 | 433 | 745 | 805 | |||||||||||||||||||||||||||||
| 3 | 7.00 | 6.80 | 1.60 | 1.40 | 1.38 | 60 | 564 | 1007 | 1067 |
It should be noted that the overlap of the two electrodes inside of the basin means that the confinement is nm smaller in the basin than in the channel. While this would result in different behavior for the fluid in the basin, it is irrelevant to our measurement as our experiment is insensitive to the fluid inside the basin. This is because there is essentially no superflow inside the basin. In Fig. SM 2, we show a finite element simulation of a Helmholtz resonator velocity profile. The Helmholtz mode is dominated by the motion of fluid in the channels. As our measurement probes the superfluid fraction via superflow, it is also dominated by the superfluid in the channels. Furthermore, since the geometric factor connecting the resonant frequency to the superfluid fraction depends on the area of the Helmholtz resonator in which superflow occurs, any signal due to the small channel-basin interface can be safely discounted. Similarly, the small gap between the electrode and channel wall can be ignored due to it making up a small fraction of the total area.

Appendix C: Thermal Effects
A detailed model of thermal effects in our Helmholtz resonator geometry has been developed in Ref. 16. This model concerns the thermal resistance between the helium in the basin and the surrounding helium via the helium in the channel, as well as the thermal resistance at the boundary between the helium and solid surfaces (called the Kapitza resistance Kapitza41 ) and the thermal resistance through the quartz. Heat flux through the chip meets boundary resistance at each of the material interfaces: 3He to aluminum, aluminum to quartz (which is negligibly small), and quartz to 3He. Additionally there is some thermal resistance while propagating through each material.
To estimate the Kapitza resistance, Bekarevich and Khalatnikov have developed a model for thermal resistance between 3He and a solid surface that is applicable for temperatures below 0.2 K where energy flux is transmitted primarily through collective excitations of zero sound Bekarevich61 . The model predicts the resistance over an area to be
| (11) |
where and are the density and transverse speed of sound in the solid (i.e. aluminum or quartz), is the Fermi velocity of 3He, and are constants describing the diffusivity of quasiparticle scattering, and and are material constants which depend on the ratio of the transverse and longitudinal speeds of sound in the solid. Following the analysis of copper by Anderson et al. Anderson64 , we take , , , and . The difference in these values for aluminum and quartz is expected to be relatively small.
We consider the resulting Kaptiza resistance at 20 bar, where we measure the largest gap between the two observed phase transitions. At this pressure kg/m3 and m/s. The material parameters for aluminum are taken to be kg/m3 and m/s. For quartz, they are kg/m3 and m/s. The total area of one side of the device including the basin and two channels is m2. At mK, approximately where the PDW to B-phase transition occurs, the thermal boundary resistance for aluminum and quartz respectively are thus
| (12) |
and
| (13) |
Each of these boundary resistances is added in series with the thermal resistances of aluminum, , and quartz, , to get the chip resistance. Given that the electrode thickness is four orders of magnitude smaller than the quartz thickness it can safely be neglected. Taking into account the two chip surfaces and two superfluid channels, which are all added in parallel, we find the total thermal resistance to be
| (14) |
The thermal resistance across mm of quartz is found to be K/W by extrapolating data from Vollhardt13 to mK. For superfluid 3He-B at 20 bar the thermal resistance is obtained from Hall86 . The result is found to be K/W. Adding these resistances according to Eq. 4 gives
| (15) |
Therefore, the power required to produce a thermal gradient equal to the temperature gap between transitions of mK would be
| (16) |
This number rules out the possibility of heating effects contributing to our signal for the following reasons. First, this number would have to apply to each device, since they each have identical electrodes, and would imply that the heat leak from the measurement alone would have to be larger than 60.9 nW. This is roughly 200 times larger than expected heat leak into the entire nuclear demagnetization stage Haard01 . Furthermore, prior experimental evidence Harrison79 suggests that Eq. 11 typically over estimates the thermal resistance, which means the actual required power would be even higher than predicted. This calculation should therefore be taken as a lower limit on the power required to produce the observed temperature gap.
Second, such heating could not explain the different widths of the PDW state shown in the main text. Since the electrodes in each device are identical, one expects each device to have identical heating and hence produce identical thermal gradients, inconsistent with the varying widths of the PDW phase observed in Fig. 4 of the main text. Third, in our geometry heating effects would result in a thermal gradient across the helium channel, which is the only helium that contributes to the Helmholtz signal, and not two distinct regions of temperature. Hence from such a heating model, one would expect a single broad phase transition, and not two sharp phase transitions. Fourth, one cannot reconcile this level of heating from Joule heating as our electrodes are superconducting inside the basin and along the channel. The only Ohmic losses in our electrical circuit would exist where the measurement leads are silver epoxied to the electrodes, but this contact is made in the surrounding bath of helium and cannot produce heating inside the helium channel of the Helmholtz resonator. Fifth and finally, we note that the temperatures at which the observed phase transitions occur do not depend on the measurement drive, further ruling out any thermal effects from the measurement.
In light of these thermal calculations and experimental observations, we conclude that the stable phase transitions observed in our devices are genuine and do not result from any untoward thermal effects.