Constraining -Process Production of Fluorine through Cosmic Ray Nucleosynthesis
Abstract
Fluorine is massive enough that it is not considered to be a light () element, yet compared to its near neighbors, C, N, O, and Ne, it is far underproduced in the course of stellar evolution, making its origin more complex. In fact, the abundance of fluorine is the lowest among all elements between Z = 5 and 21 and is roughly 3-4 orders of magnitude below that of C, N, O, and Ne. There are several plausible sources for F beyond standard stellar evolution. These include the production in the asymptotic giant branch phase (AGB) in intermediate mass stars, production in Wolf-Rayet stars, and the production through neutrino spallation in supernovae. The latter, known as the -process, is an important source for , and may contribute to the abundance of as well. We combine a simple model of Galactic chemical evolution with a standard Galactic cosmic ray nucleosynthesis model to treat self-consistently the evolution of the Li, Be, and B isotopes. We include massive star production of F, as well as contributions from AGB stars, and the -process. Given the uncertainties in neutrino energies in supernovae, we normalize the -process using the observed / ratio as a constraint. As a consequence, we are able to determine the relative importance of each contribution to the F abundance. We find that although the -process dominates at early times (low metallicity), the present-day F abundance is found to originate primarily from AGB stars.
keywords:
nucleosynthesis, ISM: abundances, galaxies: ISM, abundances1 Introduction
While it is understood that virtually all of the naturally produced elements in the periodic table are produced in stellar processes (either during or post main sequence evolution) (Clayton, 1983), the light elements have diverse origins. The lightest element isotopes of D, 3He, 4He, and 7Li, are produced in the early Universe during Big Bang Nucleosynthesis (BBN) (Cyburt et al., 2016; Pitrou et al., 2018). The slightly heavier isotopes, , , , , are produced predominantly in interactions between cosmic rays and the interstellar medium (ISM) (Reeves et al., 1970; Meneguzzi et al., 1971; Walker et al., 1985; Vangioni-Flam et al., 1990; Fields et al., 2000), namely Galactic Cosmic Ray Nucleosynthesis (GCRN). The two forms of nucleosynthesis (BBN and GCRN) are related by the fact that is produced in both (Olive & Schramm, 1992). However, and have an additional source for production, namely the supernova neutrino process (-process) (Woosley et al., 1990) in which neutrinos produced in core collapse supernovae interact with C, N, O, and Ne. These elements are produced in the course of stellar evolution, but their fragmentation by neutrino spallation can lead to appreciable amounts of and . In addition, we expect that spallation on Ne, can produce appreciable amounts of 19F as well.
In standard GCRN, Be and B production is expected to be secondary (Vangioni-Flam et al., 1990). That is, Be, B O2. Furthermore, if the production of Fe is related to the production of O, so that O/Fe is constant with respect to Fe, then Be, B Fe2 as well. However, the data tend to show a behavior which is primary in nature, Be Fe (Rebolo et al., 1988; Ryan et al., 1990, 1992; Gilmore et al., 1992; Boesgaard & King, 1993; Thorburn & Hobbs, 1996; Molaro et al., 1997; Boesgaard et al., 1999b; Primas et al., 2000b, a; King, 2001; Rich & Boesgaard, 2009; Smiljanic et al., 2009; Boesgaard et al., 2011). Similarly for boron (Duncan et al., 1997, 1998; Garcia Lopez et al., 1998; Primas et al., 1999).
However, data also indicate that there is some scaling of [O/Fe] vs [Fe/H] (Israelian et al., 1998; Boesgaard et al., 1999a; Israelian et al., 2001; Nissen et al., 2002). As a result it is in principle possible for Be and B to appear primary with respect to Fe, and yet secondary with respect to O (Fields & Olive, 1999). Current data seem to favor a scaling somewhere in between pure primary and secondary and may even indicate a change in the logarithmic slope at low metallicity (Fields & Olive, 1999; Boesgaard et al., 1999b; Fields et al., 2000; Rich & Boesgaard, 2009; Boesgaard et al., 2011).
As we will see below, the need for a primary component for Be and B resides at low metallicity. A possible source for a primary component is the infusion of low energy nuclei (LEN) (Cassé et al., 1995; Vangioni-Flam et al., 1996; Ramaty et al., 1996; Vangioni-Flam et al., 1998) or a low energy component (LEC) as it will be referred to here. The origins of the LEC are in superbubbles of hot metal-rich gas swept out by the collective effects of stellar winds and supernova explosions (Vangioni-Flam et al., 1998; Higdon et al., 1998) which were originally motivated by gamma-ray observations from Orion (Bloemen et al., 1994; Ramaty et al., 1995; Fields et al., 1996; Parizot, 1998). Other primary sources for have also been considered (Banerjee et al., 2013).
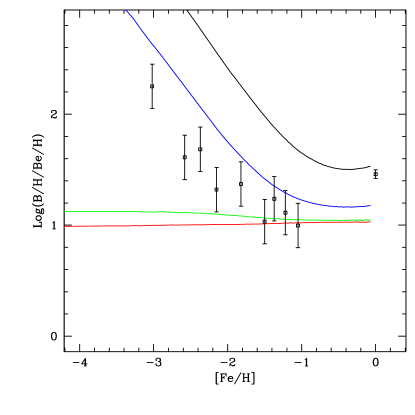
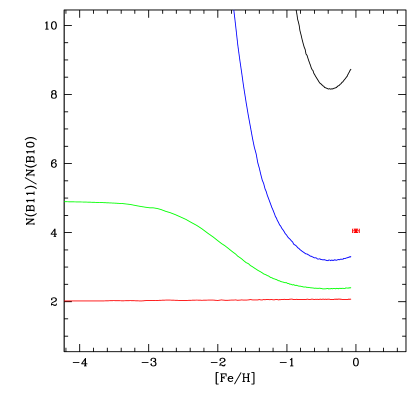
While the evolutionary behavior of Be and B with respect to either Fe or O is improved with the inclusion of a LEC, standard GCRN still suffers from two problems. The first, the isotopic ratio of 11B/10B, is predicted to be 2.5 (Meneguzzi et al., 1971; Meneguzzi & Reeves, 1975; Walker et al., 1985; Abia & Canal, 1988; Steigman & Walker, 1992; Walker et al., 1993) in contrast to the observed value of 4 (Chaussidon & Robert, 1995). The second problem is the overall ratio of B/Be which is generally predicted to be about 10 independent of metallicity (Walker et al., 1993; Fields et al., 1995) whereas observations place the ratio at or above 20, though there is some some model dependence in the prediction and considerable scatter in the data.
A neat solution to both problems is an additional source of 11B (Olive et al., 1994) from the -process during supernovae explosions (Woosley et al., 1990; Heger et al., 2005; Sieverding et al., 2018; Langanke et al., 2019; Kusakabe et al., 2019). Neutrino spallation on heavier elements leads to an addition source of 11B as well as and 19F. There is, however, considerable uncertainty in the yields of these isotopes due to the uncertainty in the neutrino temperature and flux. As we will argue below, we can fix the -process yields to avoid the overproduction of . This leaves us with definite predictions for the production of and F.
Indeed, the production of F as it relates to GCRN is the focus of the work here. F is produced in both massive stars (see e.g. Woosley & Weaver (1995)) and in asymptotic giant branch (AGB) stars (Karakas, 2010; Karakas & Lattanzio, 2014). The -process adds an additional source for F (Woosley & Haxton, 1988), and carries similar uncertainties stemming from the neutrino flux and energy. There have been several studies on the evolution of F in the Galaxy including the -process (Kobayashi et al., 2011a, b). Recently, Spitoni et al. (2018) have studied the chemical evolution of fluorine in the solar neighborhood considering different nucleosynthetic stellar yields finding that the fluorine production is dominated by AGB stars at solar metallicity. Neither of these studies tied the -process contribution to GCRN and the LiBeB elements.
Here, we combine a simple galactic chemical evolution model with a model of GCRN to track the evolution of the LiBeB elements together with metallicity tracers such as O and Fe. We include the yields from AGB stars and the -process along with the output of core collapse supernovae. In particular, we consider the evolution of F keeping track of its production from all three sources. We use the / ratio to fix the -process contribution which is ultimately small compared with the AGB contributions from intermediate mass stars.
In what follows, we first describe our model for GCRN and chemical evolution. In section 3, we discuss our treatment of the evolution of the fluorine abundance and review the existing data on fluorine. Our results are presented in section 4. In section 4.1, we consider the basic GCRN model with and without the LEC component and neglect the -process. In sections 4.2, we show the effects of including the -process. In section 4.3, we show our results on the evolution of F and we compare the relative contributions to the F abundance. Our conclusions are given in section 5.
2 Galactic Cosmic Ray Nucleosynthesis
2.1 Chemical Evolution
We consider here, a simple, one-zone, closed box, chemical evolution model. The model is described in detail in Lemoine et al. (1998), Fields & Olive (1999) and also used in Fields et al. (2000). The mass in gas, , changes due to the star formation rate, which we take as , where we use and , and the mass ejection rate from deaths of stars with mass . The ejection rate is a convolution of the star formation rate and the initial mass function (IMF), times the mass ejected as a function of the initial stellar mass, . The lifetime of the star is taken into account to determine the ejection rate. We use a simple power law IMF, which is normalized by integrating over the mass range . While there is a slight difference in the Be and B abundances when we consider an open box model with outflows (Fields & Olive, 1999), that will not be our focus here.
The element isotopes we consider here are H, He, C, N, O, and Fe, as well as Li, Be, B, and F which are affected by cosmic ray nucleosynthesis (in the case of Li, Be, and B) and the -process (in the case of Li, B, and F). We use the yields tabulated in Woosley & Weaver (1995) for the high mass stars () produced by Type II supernovae. We use the yields from Karakas (2010); Karakas & Lattanzio (2014) for intermediate mass stars () which are particularly important for the evolution of F. The importance of intermediate stellar mass yields was recently demonstrated for the production of the heavier Mg isotopes (Vangioni & Olive, 2019). Finally, we use the recent set of yields from Sieverding et al. (2018) for the -process yields of , , and F. Due to the sensitivity to the high energy tail of the neutrino energy distributions, these authors provide two sets of yields denoted as low and high energy which depend on their choice of neutrino temperatures. In this work, we consider both sets of yields. We also considered the yields in Woosley & Weaver (1995) for the -process. We find that these result in abundances which are very similar to the abundances found using the high energy yields of Sieverding et al. (2018).
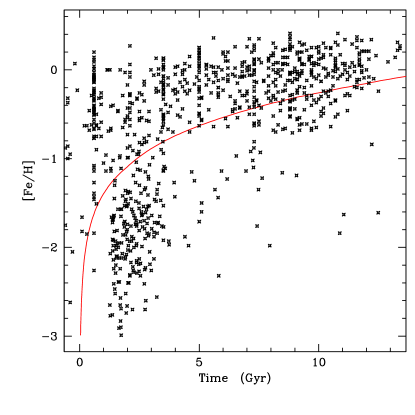
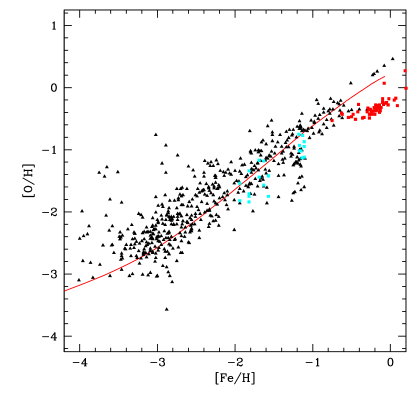
The top panel of Fig. 1 shows the resulting evolution of [Fe/H] with respect to time. The data are taken from Rafelski et al. (2012); Bensby et al. (2014). The lower panel shows the evolution of [O/H] with respect to [Fe/H]. The oxygen data are taken from Frebel et al. (2007); Penprase et al. (2010); Cooke et al. (2011). As one can see, both O and Fe are reasonably well fit in this simple model. Note that in the lower panel, we have also included O and Fe data taken from the fluorine studies discussed below. We only remark here, that the oxygen abundance in these data are systematically low with respect to other data and to our evolutionary curve. This is particularly true at higher metallicity. Though we do not show it here, the present day gas mass fraction is 6%.
2.2 GCRN
Despite the many uncertainties that go into the origin and propagation of cosmic rays, the results of cosmic ray nucleosynthesis are relatively robust. Here, we use the formalism outlined in Fields et al. (1994); Lemoine et al. (1998); Fields et al. (2000).
The production rate of a particular isotope per unit volume is
| (1) |
where is the ISM number density of species , is the cosmic ray flux for particle species , and is the cross section for the spallation reaction (Read & Viola, 1984). The factor is the probability that the daughter nucleus is stopped and thermalized in the ISM before it can escape from the Galaxy. The cosmic ray flux is determined from an initial source spectrum which is proportional to the star formation rate. The source spectrum is taken as a power law in energy (Ellison et al., 1997) and propagated in a leaky box model. Important processes include cosmic ray on C,N,O in the interstellar medium (ISM) as well as reverse processes of cosmic ray C,N,O on ISM and , though in standard GCRN, these are subdominant. Also of importance for the production of Li is + .
As noted earlier, an additional contribution to the production of the LiBeB elements can come from the acceleration of particles within superbubbles formed by the collective explosions of supernovae. While particle production within the superbubble is rare due to low density in these regions, the synthesis of LiBeB occurs as highly enriched supernova ejecta escape the superbubble and traverse the more dense outer shells. We assume that the composition of this ejected material is the same as that of a star and use the yields in Woosley & Weaver (1995). This is a primary source for Be and B.
Finally, we include the -process in our calculation of the yields for Li and B. The neutrino process (Woosley et al., 1990) provides a primary source of production for and in supernovae. As it streams from the supernova core, a flux of neutrinos traverses the outer shells of material. As neutrinos pass through the carbon shell, they collide inelastically with the nuclei, and by removing a nucleon: make primary . Removing a neutron produces which decays to . Some and are also produced but little survives the final explosive process. Thus the -process is an efficient mechanism for altering both the / and B/Be ratios.
Some is also produced in the He shell. He is spalled by neutrinos to make 3He and 3H which is subsequently burned to and (which decays to ) as well as some production of and . As we will see, however, the amount of produced is relatively minor if the production of is limited by the / ratio. F is predominantly produced in the Ne shell by neutrino spallation making both 19F and 19Ne which decays to 19F.
We use both the low and high energy yields of Sieverding et al. (2018). The latter produce results similar to that using the Woosley & Weaver (1995) yields. We view the difference in these yields as an inherent uncertainty in the -process. As a result we interpolate between the two sets of yields to obtain the correct / ratio.
Each of our three components used in the production of the LiBeB elements carries some uncertainty. As in Fields et al. (2000), we fix the normalizations of each component as follows. As we noted earlier, the overall cosmic ray flux is proportional to the star formation rate, and while the shape of the spectrum is fixed its overall normalization is adjusted so that the Be abundance today is matched to the observed value. Our second normalization concerns the LEC. The relative amount for primary production is also uncertain, and we add this component so that at the slope of [Be/H] vs [Fe/H] matches the observed slope (which lies between purely primary and secondary). Finally, we interpolate between the low (L) and high (H) -process yields so that the adopted yield is L + (1 - ) H. Thus corresponds to the low energy yields while corresponds to the high energy yields. The same interpolation is made for all -process products.
3 Fluorine
3.1 Sources for Fluorine
Of the elements produced in stars (), the abundance of fluorine is anomalously low. This is mainly due to the fact that fluorine is easily destroyed through either or captures. As hinted above, there are (at least) three sources of elemental fluorine. Fluorine is produced in massive stars in the helium burning shell (Meynet & Arnould, 2000). While the yields of F in stars with masses are relatively low, more massive stars which become Wolf-Rayet stars can eject F through stellar winds. The production of 19F proceeds through one of several nuclear chains. For example,
| (2) |
Although 19F is easily destroyed through 19FNe, the strong winds in massive stars allow fluorine to be ejected before its destruction.
The second and most dominant source of fluorine is the production during thermal pulses on the AGB (Forestini et al., 1992; Mowlavi et al., 1996). In this case, the fluorine survives so long as the destruction timescale is shorter than the pulse time. This implies that 19F production is most efficient in the early AGB stages before the temperatures exceed K. Here we use the yields from Karakas (2010); Karakas & Lattanzio (2014) for intermediate mass stars.
The third possible source for F is the neutrino process (Woosley & Haxton, 1988). Neutrinos emerging from core collapse, inelastically scatter with nuclei (of interest here is 20Ne) producing an excited state which subsequently decays to either 19F or 19Ne through or emission respectively. Much of the 19Ne is destroyed by subsequent nuclear reactions. The most significant uncertainty is the temperature of the neutrinos. Additional destruction of both 19F and 19Ne occurs during the passage of the shock. Since AGB stars provide both primary and secondary sources of F, it is difficult to use observations to distinguish between the AGB and SN sources for F (which are primary). For the supernova yields of F, we use Sieverding et al. (2018) who provide yields for F (as well as and ) neglecting the neutrino process, and for two sets of neutrino temperatures. We perform calculations using all three sets of yields.
3.2 Fluorine Data
The first observations of fluorine outside the solar system were made using the infra-red vibration-rotation line of the molecule HF in several K stars and AGB stars (Jorissen et al., 1992). The data from these observations show a correlation between F/O and C/O and confirmed AGB stars as (at least) one source of fluorine production. These observations also support the correlation between F and s-process production (Mowlavi et al., 1998). While observations reported in Abia et al. (2011); Recio-Blanco et al. (2012); D’Orazi et al. (2013) show a correlation with the s-process, it is argued that the dependence on metallicity differs from the predictions of low metallicity AGB models.
Measurements of the fluorine abundance outside the Galaxy and in the globular cluster Centauri were made in Cunha et al. (2003). On the basis of a large scatter of [F/H] with respect to [Fe/H] and depleted values of [F/H[ in Centauri, these authors argued against AGBs as a dominant source of F. Instead, they argued that the trend in the data agree reasonably well with chemical evolution models including the -process (Timmes et al., 1995; Alibés et al., 2001), though the present day abundance falls short of solar. Li et al. (2013) provide data from low metallicity giants and argue for some -process contributions at least at low metallicity. However, when the data was compared with more recent chemical evolution models which incorporate both massive and intermediate mass stars, the AGB contribution was found to be essential (Renda et al., 2004, 2005). We note that some earlier data on F abundances are systematically off due to the use of inconsistent molecular data (Guerço et al., 2019).
Measurements of fluorine in the ISM along the line of sight of a region affected by past supernovae showed no sign of enhanced F (Federman et al., 2005; Snow et al., 2007), also disfavoring the -process as a dominant source. In contrast, Werner et al. (2005) found enhanced fluorine abundances in hot post-AGB stars supporting evidence for AGB production. More recent data in C-rich low metallicity stars (Lucatello et al., 2011), carbon stars at low and solar metallicity (Abia et al., 2015), and in extragalactic AGB stars (Abia et al., 2011) also point to AGB production as do observations in the solar neighborhood (Jönsson et al., 2014b; Jönsson et al., 2017). Data from the globular cluster M22 (Alves-Brito et al., 2012; D’Orazi et al., 2013) show considerable dispersion and fluorine there is also ascribed to AGB production. Recently, data from the globular cluster M4 is given in Guerço et al. (2019).
Finally, a number of recent observations of fluorine point to sources other than AGB stars. These include open clusters (Nault & Pilachowski, 2013), the thin disk (Pilachowski & Pace, 2015), and the bulge (Jönsson et al., 2014a), where the latter point specifically to Wolf-Rayet contributions. We note that these are relatively high metallicity systems.
As one can see, despite a growing body of data, a complete understanding of the origin of fluorine remains lacking. Though, there is most certainly a strong contribution to present-day fluorine from AGB nucleosynthesis, the role of the -process remains uncertain. In what follows, we will tie the strength of the -process contribution to F to the GCRN production of .
4 Results
4.1 Standard Cosmic Ray Nucleosynthesis
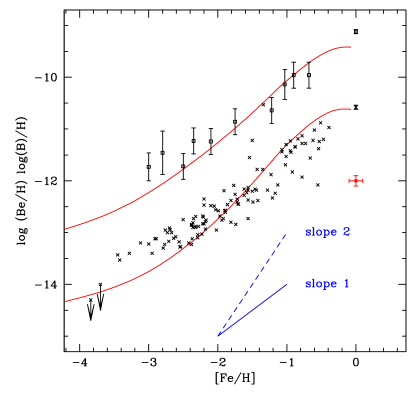
We start by considering the production of Be and B in standard GCRN embedded in a simple model of chemical evolution as described above. The evolution Be/H and B/H with respect to [Fe/H] is shown in Fig. 2. The two red curves show the evolution of B (upper) and Be (lower) ignoring any LEC or -process contributions. The B data are the upper set of points (with error bars) taken from Duncan et al. (1992, 1997); Garcia Lopez et al. (1998), and the Be data correspond to the lower set of points taken from Boesgaard et al. (2011); Ito et al. (2009); Spite et al. (2019). The typical error bar for the Be data is shown by the cross at (0,-12). For ease of comparison, the blue line segments show the slope for primary (1) and secondary (2) evolutions. As expected, in standard GCRN, both B and Be evolve as secondary elements, and while the evolutionary curves match the data reasonably well at higher metallicities ([Fe/H] ), they fall well short at low metallicities. Solar data is taken from Anders & Grevesse (1989).
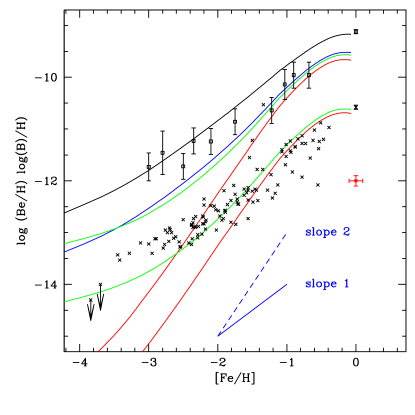
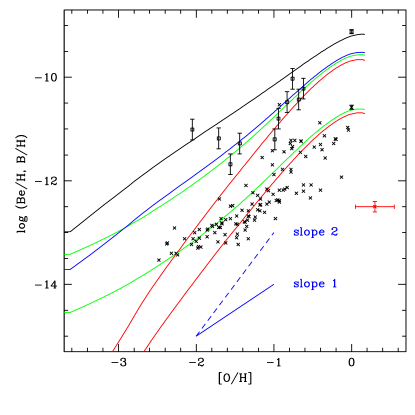
As first argued in Fields & Olive (1999), the correlation of Be and B is more naturally matched to oxygen than it is to [Fe/H]. In Fig. 3, we show the evolution of Be/H and B/H as a function of [O/H]. While the computed slope is still 2 (secondary production), the data for Be/H fall off more steeply with decreasing [O/H] as the [O/Fe] is not constant at low [Fe/H]. The curves only fall significantly below the data for [O/H] . Thus there appears to be evidence for some primary component at low metallicity (Cassé et al., 1995; Vangioni-Flam et al., 1998; Fields et al., 2000; Parizot & Drury, 2000; Parizot, 2000; King, 2001). The green curves in both Figs. 2 and 3 include the LEC component which is effective primarily at low metallicity. Note that the overall cosmic ray flux has been normalized so that Be/H today match the observed data point at [Fe/H] = 0 when the LEC is included. The strength of the LEC component is normalized to produce the correct slope for Be/H at low metallicity.
When one compares the ratios of GCRN-produced elements and isotopes, it is clear that standard GCRN even with a LEC is insufficient for fully explaining the abundances of B. For example, consider the evolution of B/Be vs [Fe/H] as shown in Fig. 4. As in Fig. 2, the red curve corresponds to standard GCRN which predicts a B/Be ratio of about 10, independent of metallicity, and the green curves includes the LEC contribution. Here, we see again that the LEC is important at low metallicity. The data however, show B/Be ratios far in excess of 10. At low metallicity, some examples of B/Be are known. Thus it would appear that a source for B other GCRN is needed. The B/Be values correspond to the IRFM1 data described in detail in Fields et al. (2000).
A similar conclusion is drawn when we compare the isotopic ratio of / as shown in Fig. 5. Once again, the red curves show the evolution of the 11/10 ratio in standard GCRN and the green curve includes the LEC. GCRN predicts / = 2. While a LEC can amplify this ratio at low metallicity, it only marginally increases the solar ratio to roughly 2.5, whereas the observed solar value is (Chaussidon & Robert, 1995). Thus the data call specifically for additional source of with respect to standard GCRN.
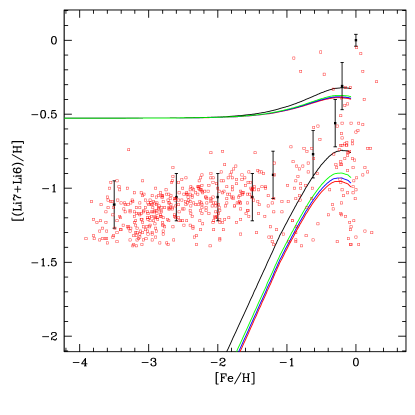
For completeness we show the evolution of with respect to [Fe/H] in Fig. 6. The LEC (green curve) adds very little Li to the standard GCRN production (red). Both of these ignore the primordial Li abundance which is added to the GCRN (and -process production) contributions in the nearly horizontal curves coming from BBN (Cyburt et al., 2016; Pitrou et al., 2018). The primordial lithium problem is clearly seen as the BBN abundance lies significantly above the data (Cyburt et al., 2008). Furthermore, the early evolution of Li is swamped by the primordial abundance leaving the plateau in tact. Note that even with the high -process yields (black curves), the solar abundance is not achieved implying the need for additional late time sources of Li.
4.2 -Process
From the above discussion, the addition of the -process production of can clearly remedy both problems relating to the B/Be and / ratios. As we indicated earlier, we use the -process yields given in Sieverding et al. (2018). Due to the sensitivity to and uncertainty in the neutrino temperatures, Sieverding et al. (2018) provide two sets of yields. Their high energy yields assume the following neutrino temperatures: MeV, MeV and MeV. These give results similar to those found in Woosley et al. (1990) and Heger et al. (2005). The low energy yields assume MeV, and MeV.
Our results including -process production of for B/H vs [Fe/H] are shown in Fig. 2. The blue (black) curves correspond to the low (high) energy yields given in Sieverding et al. (2018)111Note that the blue and black curves omit the LEC contribution, and show only the standard GCRN contribution augmented by the -process. This is the case in all figures showing the effect of the high and low -process yields.. As one can see, the low energy yields add little to the total B/H abundance whereas the high energy yields increase the B/H abundance by as much as a factor of 5. This effect is also seen in Fig. 3 for the evolution of B/H with respect to [O/H]. Similarly, for , the high energy yields increase the late-time abundance by a factor as seen in Fig. 6. When the BBN abundances are included, the effect is greatly diluted, and the increase in the abundance due to the -process is of order 15%.
More striking is the effect on the element ratios. In Figs. 4 and 5, we show the B/Be and / ratios as functions of [Fe/H] for the high (black) and low (blue) energy yields. As one can see, the B/Be ratio is significantly increased, and ratios higher than 20 are expected at low metallicity. Since the -process produces very little Be (and we have not included this contribution), boron (in the form of ) is expelled into the ISM very early (due to the first generations of type II supernovae) with very little Be present. The same is true for the ratio /.
One of our key motivations for including the -process is deficiency in the / ratio. Including the -process, we find that the present-day boron isotopic ratio is 8.7 for the high energy yields and 3.4 for the low energy yields. We normalize the “neutrino temperature” and interpolate between the two sets of yields. To that end, we assume that the true yield is given by
| (3) |
so that corresponds to using the low (high) energy yields. We fix the value of by demanding the correct / ratio today. We find to obtain / = 4.
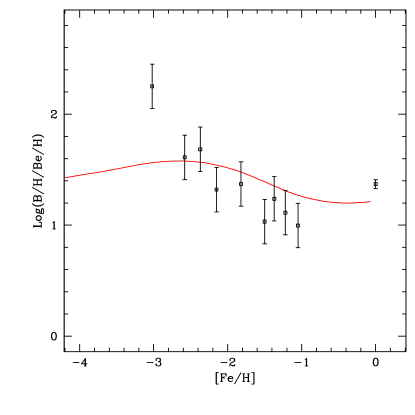
Our final results for the evolution of Be and B are shown in Figs. 7, 8, and 9. The single curve in each figure shows the evolution including standard GCRN normalized by the present Be abundance, an LEC component to match the slope of Be vs Fe at low metallicity, and the -process with to obtain the correct / ratio. As seen in Fig. 7, the evolution of B and Be are in reasonably good agreement with the data.
4.3 Fluorine
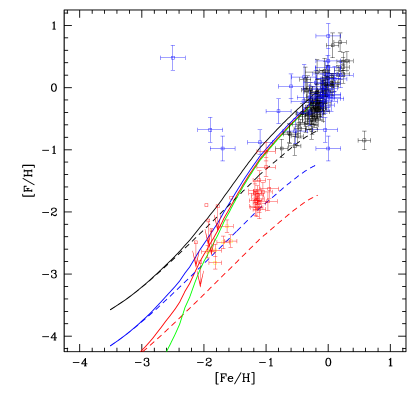
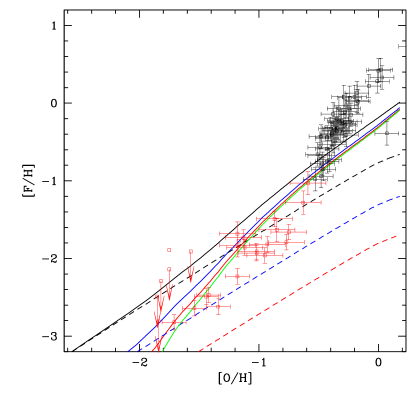
Finally, we present our results for the evolution of fluorine. In the upper panel of Fig. 10, we show the evolution of [F/H] vs [Fe/H]. The dashed curves show the evolution in the absence of any AGB production of F. The green, blue and black curves correspond to no -process, low energy, and high energy yields respectively. Taken alone, the -process contributes substantially to the F abundance at low metallicity. The lower panel is similar and shows the evolution of [F/Fe] vs [Fe/H]. While the neutrino-process may be capable of explaining some data at low metallicity, even the high energy yields fall far short of the abundances at (and above) solar metallicity. The F data are taken from i) Abia et al. (2011); Abia et al. (2015), blue points, ii) Recio-Blanco et al. (2012); Jönsson et al. (2014a); Jönsson et al. (2014b); Jönsson et al. (2017), black points and iii) Yong et al. (2008); D’Orazi et al. (2013); Li et al. (2013); Guerço et al. (2019), red points.
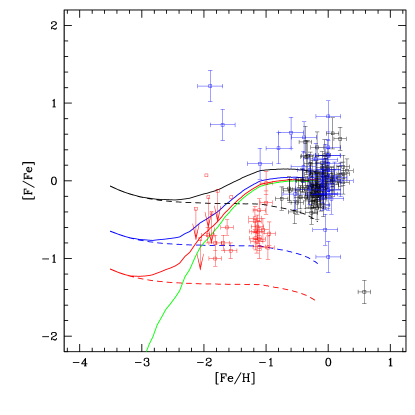
The lone thin green curve shows only the contribution from AGB stars. As one can see by comparing this curve with the dashed curves, the -process only dominates at [Fe/H] for the low yields, and for the high yields. The thicker solid curves show the evolution including AGB and the 3 cases shown by the dashed curves. As one can see, when the AGB contribution is included, the evolutionary curves fit the data quite well at all metallicities up to and including solar values. Because of the dispersion at solar metallicity, it is not possible to distinguish the -process contributions at [Fe/H] = 0.
In Fig. 11, we show the evolution of fluorine with respect to [O/H]. In the upper panel, we plot [F/H[ vs. [O/H] and in the lower panel, we plot [F/O] vs. [O/H]. In both panels, we see that the upper limits at low metallicity are respected, and the curves pass through much of the data at [O/H] , though there is considerable scatter in the data. At near solar metallicity, it would appear the models fall well short of the observed data. However if we recall the position of this data in the [O/H] vs [Fe/H] plot shown in Fig. 1, we see that these points are deficient in oxygen relative to their iron abundance. For this reason, the evolution with respect to [Fe/H] fits the data, and the data show low oxygen with respect to the model prediction for a given fluorine abundance. The data in Fig. 11 are taken from i) Recio-Blanco et al. (2012); Jönsson et al. (2014a); Jönsson et al. (2014b); Jönsson et al. (2017) black points and ii) Yong et al. (2008); D’Orazi et al. (2013); Li et al. (2013); Guerço et al. (2019) red points.
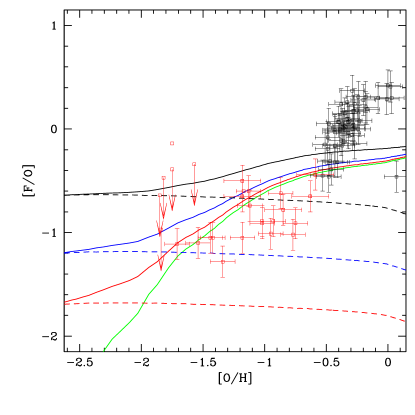
As in Fig. 10, the dashed show the evolution neglecting the AGB contribution (which alone is shown by the thin green line). We see that the -process dominates only for [O/H] ] for the low yields, and for the high yields. The solid curves in Fig. 10 show the fluorine evolution with AGB and -process contributions included. Once again, at low metallicity, the fluorine abundance is dominated by supernovae (and the -process.). Our conclusion is that the present fluorine abundance is heavily dominated by AGB production which minimizes the difference between the high and low energy -process yields.
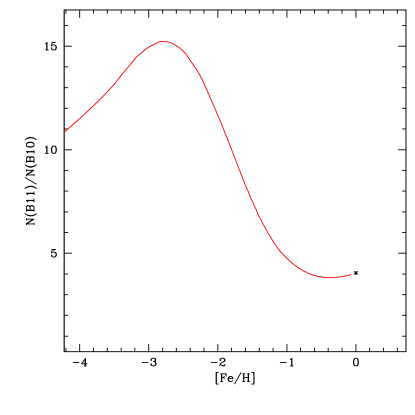
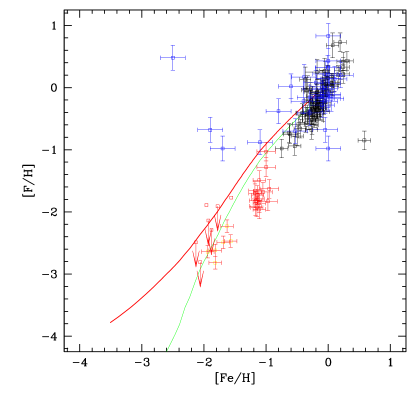
In Fig. 12, we show our final result for the evolution of F. The neutrino process yield is normalized with to fix the / ratio, and hence there are no additional normalization adjustments possible for the evolution of F. With the exception of some upward scatter at low metallicity, the evolution which includes both AGB and -process contributions fits the data well.
5 Conclusion
The relatively low abundances of fluorine make it difficult to observe, and at the same time, make it difficult to firmly establish the source of fluorine production. We have considered three sources for fluorine. The production of F in intermediate mass stars in the AGB phase, the production in massive stars, and additional production in massive stars due to the neutrino process during supernovae. The -process contribution always dominates the massive star yield of F assuming that the low energy yields of Sieverding et al. (2018) are minimal.
We can resolve the current uncertainty in the -process yields by recognizing the important contribution of this process to the production of (Olive et al., 1994; Vangioni-Flam et al., 1996). To this end, we have incorporated the process in a chemical evolution model which follows GCRN. The latter explains well the abundance and evolution of Be. However, the B/Be ratio as well as the isotopic / ratio are both predicted to be smaller than observed values. Remarkably, the -process production of provides a substantial increase in both ratios. Playing on the uncertainty of the -process yields, we are able to fit the / ratio, with yields slightly above the low energy yields derived in Sieverding et al. (2018). Once fixed, the B/Be is fully predicted as is the the abundance and evolution of F.
While the -process is the dominant production mechanism at low metallicity, the present-day abundance of F, it almost entirely a result of AGB production. Even using the higher energy yield neutrino yields would make a marginal increase in total present day F abundance.
Our understanding of the evolution of F or any of the element abundances clearly relies heavily on observation. Our results show it is clear that the late abundances of F are dominated by AGB production. Thus the theoretical yields in intermediate mass stars are of prime importance. The potential importance of the -process in the production of F can only be ascertained with future abundance measurements of F, particularly at low metallicity.
Acknowledgements
This work is made in the ILP LABEX (under reference ANR-10-LABX-63) supported by French state funds managed by the ANR within the Investissements d’Avenir programme under reference ANR-11-IDEX-0004-02. The work of K.A.O. was supported in part by DOE grant DE–SC0011842 at the University of Minnesota.
References
- Abia & Canal (1988) Abia C., Canal R., 1988, A&A, 189, 55
- Abia et al. (2011) Abia C., Cunha K., Cristallo S., de Laverny P., Domínguez I., Recio-Blanco A., Smith V. V., Straniero O., 2011, ApJ, 737, L8
- Abia et al. (2015) Abia C., Cunha K., Cristallo S., de Laverny P., 2015, A&A, 581, A88
- Alibés et al. (2001) Alibés A., Labay J., Canal R., 2001, A&A, 370, 1103
- Alves-Brito et al. (2012) Alves-Brito A., Yong D., Meléndez J., Vásquez S., Karakas A. I., 2012, A&A, 540, A3
- Anders & Grevesse (1989) Anders E., Grevesse N., 1989, Geochimica Cosmochimica Acta, 53, 197
- Banerjee et al. (2013) Banerjee P., Qian Y.-Z., Haxton W. C., Heger A., 2013, Phys. Rev. Lett., 110, 141101
- Bensby et al. (2014) Bensby T., Feltzing S., Oey M. S., 2014, A&A, 562, A71
- Bloemen et al. (1994) Bloemen H., et al., 1994, A&A, 281, L5
- Boesgaard & King (1993) Boesgaard A. M., King J. R., 1993, AJ, 106, 2309
- Boesgaard et al. (1999a) Boesgaard A. M., King J. R., Deliyannis C. P., Vogt S. S., 1999a, AJ, 117, 492
- Boesgaard et al. (1999b) Boesgaard A. M., Deliyannis C. P., King J. R., Ryan S. G., Vogt S. S., Beers T. C., 1999b, AJ, 117, 1549
- Boesgaard et al. (2011) Boesgaard A. M., Rich J. A., Levesque E. M., Bowler B. P., 2011, ApJ, 743, 140
- Cassé et al. (1995) Cassé M., Lehoucq R., Vangioni-Flam E., 1995, Nature, 373, 318
- Chaussidon & Robert (1995) Chaussidon M., Robert F., 1995, Nature, 374, 337
- Clayton (1983) Clayton D. D., 1983, Principles of stellar evolution and nucleosynthesis
- Cooke et al. (2011) Cooke R., Pettini M., Steidel C. C., Rudie G. C., Nissen P. E., 2011, MNRAS, 417, 1534
- Cunha et al. (2003) Cunha K., Smith V. V., Lambert D. L., Hinkle K. H., 2003, AJ, 126, 1305
- Cyburt et al. (2008) Cyburt R. H., Fields B. D., Olive K. A., 2008, J. Cosmology Astropart. Phys., 2008, 012
- Cyburt et al. (2016) Cyburt R. H., Fields B. D., Olive K. A., Yeh T.-H., 2016, Reviews of Modern Physics, 88, 015004
- D’Orazi et al. (2013) D’Orazi V., et al., 2013, ApJ, 763, 22
- Duncan et al. (1992) Duncan D. K., Lambert D. L., Lemke M., 1992, ApJ, 401, 584
- Duncan et al. (1997) Duncan D. K., Primas F., Rebull L. M., Boesgaard A. M., Deliyannis C. P., Hobbs L. M., King J. R., Ryan S. G., 1997, ApJ, 488, 338
- Duncan et al. (1998) Duncan D. K., Rebull L. M., Primas F., Boesgaard A. M., Deliyannis C. P., Hobbs L. M., King J. R., Ryan S. G., 1998, A&A, 332, 1017
- Ellison et al. (1997) Ellison D. C., Drury L. O., Meyer J.-P., 1997, ApJ, 487, 197
- Federman et al. (2005) Federman S. R., Sheffer Y., Lambert D. L., Smith V. V., 2005, ApJ, 619, 884
- Fields & Olive (1999) Fields B. D., Olive K. A., 1999, ApJ, 516, 797
- Fields et al. (1994) Fields B. D., Olive K. A., Schramm D. N., 1994, ApJ, 435, 185
- Fields et al. (1995) Fields B. D., Olive K. A., Schramm D. N., 1995, ApJ, 439, 854
- Fields et al. (1996) Fields B. D., Cassé M., Vangioni-Flam E., Nomoto K., 1996, ApJ, 462, 276
- Fields et al. (2000) Fields B. D., Olive K. A., Vangioni-Flam E., Cassé M., 2000, ApJ, 540, 930
- Forestini et al. (1992) Forestini M., Goriely S., Jorissen A., Arnould M., 1992, A&A, 261, 157
- Frebel et al. (2007) Frebel A., Johnson J. L., Bromm V., 2007, MNRAS, 380, L40
- Garcia Lopez et al. (1998) Garcia Lopez R. J., Lambert D. L., Edvardsson B., Gustafsson B., Kiselman D., Rebolo R., 1998, ApJ, 500, 241
- Gilmore et al. (1992) Gilmore G., Gustafsson B., Edvardsson B., Nissen P. E., 1992, Nature, 357, 379
- Guerço et al. (2019) Guerço R., et al., 2019, ApJ, 876, 43
- Heger et al. (2005) Heger A., Kolbe E., Haxton W. C., Langanke K., Martínez-Pinedo G., Woosley S. E., 2005, Physics Letters B, 606, 258
- Higdon et al. (1998) Higdon J. C., Lingenfelter R. E., Ramaty R., 1998, ApJ, 509, L33
- Israelian et al. (1998) Israelian G., García López R. J., Rebolo R., 1998, ApJ, 507, 805
- Israelian et al. (2001) Israelian G., Rebolo R., García López R. J., Bonifacio P., Molaro P., Basri G., Shchukina N., 2001, ApJ, 551, 833
- Ito et al. (2009) Ito H., Aoki W., Honda S., Beers T. C., 2009, ApJ, 698, L37
- Jönsson et al. (2014a) Jönsson H., et al., 2014a, A&A, 564, A122
- Jönsson et al. (2014b) Jönsson H., Ryde N., Harper G. M., Richter M. J., Hinkle K. H., 2014b, ApJ, 789, L41
- Jönsson et al. (2017) Jönsson H., Ryde N., Spitoni E., Matteucci F., Cunha K., Smith V., Hinkle K., Schultheis M., 2017, ApJ, 835, 50
- Jorissen et al. (1992) Jorissen A., Smith V. V., Lambert D. L., 1992, A&A, 261, 164
- Karakas (2010) Karakas A. I., 2010, MNRAS, 403, 1413
- Karakas & Lattanzio (2014) Karakas A. I., Lattanzio J. C., 2014, Publ. Astron. Soc. Australia, 31, e030
- King (2001) King J. R., 2001, AJ, 122, 3115
- Kobayashi et al. (2011a) Kobayashi C., Karakas A. I., Umeda H., 2011a, MNRAS, 414, 3231
- Kobayashi et al. (2011b) Kobayashi C., Izutani N., Karakas A. I., Yoshida T., Yong D., Umeda H., 2011b, ApJ, 739, L57
- Kusakabe et al. (2019) Kusakabe M., et al., 2019, ApJ, 872, 164
- Langanke et al. (2019) Langanke K., Martinez-Pinedo G., Sieverding A., 2019, arXiv e-prints, p. arXiv:1901.03741
- Lemoine et al. (1998) Lemoine M., Vangioni-Flam E., Cassé M., 1998, ApJ, 499, 735
- Li et al. (2013) Li H. N., Ludwig H. G., Caffau E., Christlieb N., Zhao G., 2013, ApJ, 765, 51
- Lucatello et al. (2011) Lucatello S., Masseron T., Johnson J. A., Pignatari M., Herwig F., 2011, ApJ, 729, 40
- Meneguzzi & Reeves (1975) Meneguzzi M., Reeves H., 1975, A&A, 40, 99
- Meneguzzi et al. (1971) Meneguzzi M., Audouze J., Reeves H., 1971, A&A, 15, 337
- Meynet & Arnould (2000) Meynet G., Arnould M., 2000, A&A, 355, 176
- Molaro et al. (1997) Molaro P., Bonifacio P., Castelli F., Pasquini L., 1997, A&A, 319, 593
- Mowlavi et al. (1996) Mowlavi N., Jorissen A., Arnould M., 1996, A&A, 311, 803
- Mowlavi et al. (1998) Mowlavi N., Jorissen A., Arnould M., 1998, A&A, 334, 153
- Nault & Pilachowski (2013) Nault K. A., Pilachowski C. A., 2013, AJ, 146, 153
- Nissen et al. (2002) Nissen P. E., Primas F., Asplund M., Lambert D. L., 2002, A&A, 390, 235
- Olive & Schramm (1992) Olive K. A., Schramm D. N., 1992, Nature, 360, 439
- Olive et al. (1994) Olive K. A., Prantzos N., Scully S., Vangioni-Flam E., 1994, ApJ, 424, 666
- Parizot (1998) Parizot E. M. G., 1998, A&A, 331, 726
- Parizot (2000) Parizot E., 2000, A&A, 362, 786
- Parizot & Drury (2000) Parizot E., Drury L., 2000, A&A, 356, L66
- Penprase et al. (2010) Penprase B. E., Prochaska J. X., Sargent W. L. W., Toro-Martinez I., Beeler D. J., 2010, ApJ, 721, 1
- Pilachowski & Pace (2015) Pilachowski C. A., Pace C., 2015, AJ, 150, 66
- Pitrou et al. (2018) Pitrou C., Coc A., Uzan J.-P., Vangioni E., 2018, Phys. Rep., 754, 1
- Primas et al. (1999) Primas F., Duncan D. K., Peterson R. C., Thorburn J. A., 1999, A&A, 343, 545
- Primas et al. (2000a) Primas F., Molaro P., Bonifacio P., Hill V., 2000a, A&A, 362, 666
- Primas et al. (2000b) Primas F., Asplund M., Nissen P. E., Hill V., 2000b, A&A, 364, L42
- Rafelski et al. (2012) Rafelski M., Wolfe A. M., Prochaska J. X., Neeleman M., Mendez A. J., 2012, ApJ, 755, 89
- Ramaty et al. (1995) Ramaty R., Kozlovsky B., Lingenfelter R. E., 1995, ApJ, 438, L21
- Ramaty et al. (1996) Ramaty R., Kozlovsky B., Lingenfelter R. E., 1996, ApJ, 456, 525
- Read & Viola (1984) Read S. M., Viola V. E. J., 1984, Atomic Data and Nuclear Data Tables, 31, 359
- Rebolo et al. (1988) Rebolo R., Molaro P., Abia C., Beckman J. E., 1988, A&A, 193, 193
- Recio-Blanco et al. (2012) Recio-Blanco A., de Laverny P., Worley C., Santos N. C., Melo C., Israelian G., 2012, A&A, 538, A117
- Reeves et al. (1970) Reeves H., Fowler W. A., Hoyle F., 1970, Nature, 226, 727
- Renda et al. (2004) Renda A., et al., 2004, MNRAS, 354, 575
- Renda et al. (2005) Renda A., et al., 2005, Nuclear Phys. A, 758, 324
- Rich & Boesgaard (2009) Rich J. A., Boesgaard A. M., 2009, ApJ, 701, 1519
- Ryan et al. (1990) Ryan S. G., Bessell M. S., Sutherland R. S., Norris J. E., 1990, ApJ, 348, L57
- Ryan et al. (1992) Ryan S. G., Norris J. E., Bessell M. S., Deliyannis C., 1992, ApJ, 388, 184
- Sieverding et al. (2018) Sieverding A., Martínez-Pinedo G., Huther L., Langanke K., Heger A., 2018, ApJ, 865, 143
- Smiljanic et al. (2009) Smiljanic R., Pasquini L., Bonifacio P., Galli D., Gratton R. G., Randich S., Wolff B., 2009, A&A, 499, 103
- Snow et al. (2007) Snow T. P., Destree J. D., Jensen A. G., 2007, ApJ, 655, 285
- Spite et al. (2019) Spite M., Bonifacio P., Spite F., Caffau E., Sbordone L., Gallagher A. J., 2019, A&A, 624, A44
- Spitoni et al. (2018) Spitoni E., Matteucci F., Jönsson H., Ryde N., Romano D., 2018, A&A, 612, A16
- Steigman & Walker (1992) Steigman G., Walker T. P., 1992, ApJ, 385, L13
- Suda et al. (2008) Suda T., et al., 2008, PASJ, 60, 1159
- Thorburn & Hobbs (1996) Thorburn J. A., Hobbs L. M., 1996, AJ, 111, 2106
- Timmes et al. (1995) Timmes F. X., Woosley S. E., Weaver T. A., 1995, ApJS, 98, 617
- Vangioni & Olive (2019) Vangioni E., Olive K. A., 2019, MNRAS, 484, 3561
- Vangioni-Flam et al. (1990) Vangioni-Flam E., Cassé M., Audouze J., Oberto Y., 1990, ApJ, 364, 568
- Vangioni-Flam et al. (1996) Vangioni-Flam E., Cassé M., Fields B. D., Olive K. A., 1996, ApJ, 468, 199
- Vangioni-Flam et al. (1998) Vangioni-Flam E., Ramaty R., Olive K. A., Cassé M., 1998, A&A, 337, 714
- Walker et al. (1985) Walker T. P., Viola V. E., Mathews G. J., 1985, ApJ, 299, 745
- Walker et al. (1993) Walker T. P., Steigman G., Schramm D. N., Olive K. A., Fields B., 1993, ApJ, 413, 562
- Werner et al. (2005) Werner K., Rauch T., Kruk J. W., 2005, A&A, 433, 641
- Woosley & Haxton (1988) Woosley S. E., Haxton W. C., 1988, Nature, 334, 45
- Woosley & Weaver (1995) Woosley S. E., Weaver T. A., 1995, ApJS, 101, 181
- Woosley et al. (1990) Woosley S. E., Hartmann D. H., Hoffman R. D., Haxton W. C., 1990, ApJ, 356, 272
- Yong et al. (2008) Yong D., Meléndez J., Cunha K., Karakas A. I., Norris J. E., Smith V. V., 2008, ApJ, 689, 1020