Beam-beam effects on the luminosity measurement at LEP and the number of light neutrino species
Marking the 30th anniversary of the first Z detected at LEP on 13 August 1989
Abstract
In collisions, electromagnetic effects caused by large charge density bunches modify the effective acceptance of the luminometer system of the experiments. These effects consequently bias the luminosity measurement from the rate of low-angle Bhabha interactions . Surprisingly enough, the magnitude of this bias is found to yield an underestimation of the integrated luminosity measured by the LEP experiments by about 0.1%, significantly larger than the reported experimental uncertainties. When accounted for, this effect modifies the number of light neutrino species determined at LEP from the measurement of the hadronic cross section at the Z peak.
keywords:
1 Introduction
The Large Electron-Positron (LEP) collider was operated at CERN between and , and delivered collisions to four experiments, at centre-of-mass energies that covered the resonance, the threshold, and extended up to GeV. The first phase (LEP1), at and around the pole, provided a wealth of measurements of unprecedented accuracy [1]. In particular, the measurement of the hadronic cross section at the Z peak, , has been used to derive the number of light neutrino species from
| (1) |
where is the ratio of the hadronic-to-leptonic Z branching fractions; is a small correction; and is the ratio of the massless neutral-to-charged leptonic Z partial widths predicted by the Standard Model (SM). The combination of the measurements made by the four LEP experiments leads to [1]:
| (2) |
consistent within two standard deviations with the three observed families of fundamental fermions.111The expression in Eq. 1 was chosen to minimize the dependence of on SM parameters. With up-to-date calculations of higher-order corrections to [2] and recent measurements of the Higgs boson and top quark masses, the number of light neutrino species slightly increases from 2.9840 to 2.9846. The more parameter-dependent global fit of Ref. [2], which also includes the Z width measurement and the world-average value of the strong coupling constant, yields , with a similar sensitivity to the LEP integrated luminosity [3]. This observable is directly affected by any systematic bias on the integrated luminosity through . Indeed, the integrated luminosity uncertainty saturates the uncertainty on , and is the largest contribution to the uncertainty.
At LEP, the luminosity was determined by measuring the rate of the theoretically well-understood Bhabha-scattering process at small angles, , in a set of dedicated calorimeters (LumiCal), possibly completed with tracking devices, situated on each side of the interaction region. These luminometers covered polar angle ranges from about to mrad ( to mrad for DELPHI) from the beam axis. The Bhabha events were selected with a "narrow" acceptance on one side and a "wide" acceptance on the other, defined as shown in Table 1.
| Experiment | ALEPH [4] | DELPHI [5] | L3 [6] | OPAL [7] |
|---|---|---|---|---|
| Wide (mrad) | 26.2–55.5 | 37.0–127.0 | 27.0–65.0 | 27.2–55.7 |
| Narrow (mrad) | 30.4–49.5 | 44.9–113.6 | 32.0–54.0 | 31.3–51.6 |
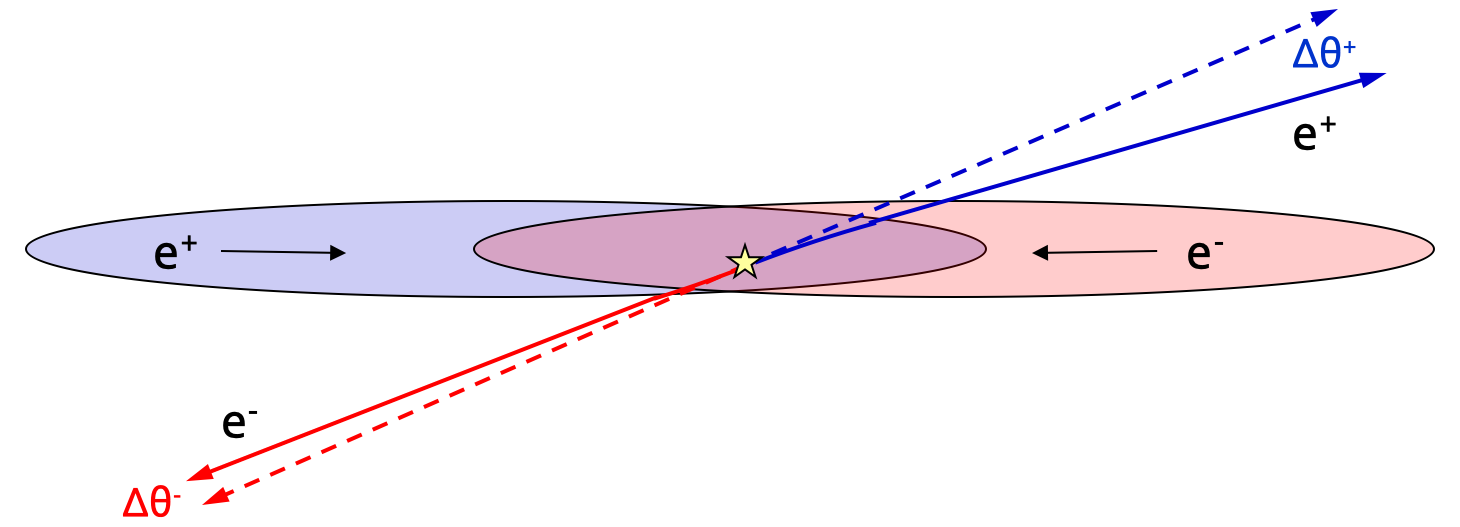
When the charge density of the beam bunches is large, beam-induced effects modify the effective acceptance of the LumiCal in a nontrivial way. The final state () in a Bhabha interaction, emitted at a small angle off the () beam, feels an attractive force from the incoming () bunch, and is consequently focused towards the beam axis.222The “repelling” effect of the particle’s own bunch is negligible because, in the laboratory frame, the electric and magnetic components of the Lorentz force have the same magnitude but opposite directions. In contrast, the electric and magnetic forces induced by the opposite charge beam point in the same direction and thus add up. This effect, illustrated in Fig. 1, leads to an effective reduction of the acceptance of the LumiCal, as particles that would otherwise hit the detector close to its inner edge are focused to lower polar angles and may therefore miss the detector.
This effect has been first realised in the context of the International Linear Collider (ILC) design study [8]. A detailed analysis of beam-induced effects on the luminosity measurement at the Future Circular Collider (FCC) has been recently carried out and is reported in Ref. [9], together with methods to measure and correct for them. In the context of that study, it has been realised that these effects were already significant at LEP. As shown below, they lead to a bias of the measured luminosity of the order of , which is large compared to the uncertainties reported by the experiments.333The most precise determination, from the OPAL experiment [7], quotes an experimental uncertainty of and a theoretical uncertainty of . Needless to say, beam-beam effects were already well-known at the time of LEP [10]. To our knowledge, however, this beam-induced bias of the luminosity measurement has not been taken into account by the LEP experiments.
In the study presented here, this bias is quantified with the Guinea-Pig code [11]. In Section 2, technical details are given on how this code is used to perform the numerical calculations. Detailed results of these calculations are presented in Section 3, for a representative situation corresponding to the OPAL luminosity measurement performed in , during which half of the LEP data at the peak was collected. This illustrative example assumes a polar angle acceptance between mrad and mrad (Table 1), and the set of beam parameters given in the third row of Table 2.
| Year | ( ) | ( m ) | ( m ) | ( mm ) | ( m ) | ( cm ) |
|---|---|---|---|---|---|---|
| 1993 | 1.207 | 213. | 10.3 | 2.5 | 5. | |
| 1994 | 1.280 | 171. | 10.0 | 2.0 | 5. | |
| 1995 | 1.155 | 206. | 10.5 | 2.5 | 5. |
The calculation is extended in Section 4 to the four LEP experiments and to the last three years of LEP1 operation (1993, 1994, and 1995), when the experimental precision of the integrated luminosity measurements was improved by up to one order of magnitude with the installation of second-generation LumiCals. A corrected number of light neutrino species from the combination of the LEP measurements is deduced. In Section 5, the systematic effects arising from the simplifying assumptions used to determine are evaluated and corrected for. A summary is given in Section 6.
2 Numerical Calculations
The Guinea-Pig code [11] was initially developed in the mid-nineties to simulate the beam-beam effects and the beam-background production in the interaction region of (future) electron-positron colliders. The Guinea-Pig algorithm groups particles from the incoming bunches into macro-particles, slices each beam longitudinally, and divides the transverse plane into a “grid” of cells. The macro-particles are initially distributed over the slices and the grid, and are tracked through the collision. The fields are computed at the grid points at each step of this tracking. Here, the dimensions of the grid are defined to contain the envelope of the beam in the longitudinal direction, and the and intervals in the transverse dimensions. The number of cells (slices) are such that the cell (slice) size, in both the and dimensions (along the axis), amounts to about of the transverse (longitudinal) bunch size at the interaction point.
In the context of the studies reported in Ref. [8], the C++ version of Guinea-Pig was extended in order to track Bhabha events, provided by external generators, in the field of the colliding bunches. This version of Guinea-Pig is used here. An input Bhabha event is associated to one of the interactions, i.e., is assigned a spatial vertex and an interaction time according to their probability densities. The electron and positron that emerge from this Bhabha interaction are subsequently transported as they move forward: the final state () potentially crosses a significant part of the () bunch, or travels for some time in its vicinity and, thereby, feels a deflection force.
Since the that emerge from a Bhabha interaction are emitted with a non-vanishing, albeit small, polar angle, they may exit the grid mentioned above, designed to contain the beams and in which the fields are computed, before the tracking ends. For this reason, the program can also extend the calculations of the fields to “extra” grids. For the settings used here, six extra grids are defined to sample larger and larger spatial volumes with accordingly decreasing granularity. The largest grid has equal dimensions in and , and a size twelve times larger than that of the first grid in . It safely contains the trajectory of Bhabha electrons during the whole tracking time for the range in polar angle of interest here.
A numerical integration code has also been developed, which uses the Bassetti-Erskine formulae [12] for the field created by a Gaussian bunch to determine the average effects that a particle would feel. The particle is defined by its velocity and spatial coordinates at a given time . The momentum kick that it gets between and a later time is obtained by integrating the Lorentz force during this interval [13]. More details are given in Ref. [9].
3 Electromagnetic focusing of final state leptons in Bhabha events
The Guinea-Pig code is used in this section to estimate the focusing of final-states leptons, first for leading-order Bhabha events (i.e., without initial- or final-state radiation), with the 1994 LEP beam parameters given in Table 2. The corresponding luminosity bias is evaluated for the illustrative example of the OPAL LumiCal narrow acceptance, mrad. In what follows, the polar angle of the electron (positron) emerging from a Bhabha interaction is always defined with respect to the direction of the () beam. The notation is used to denote the production angles in the frame where the initial pair is at rest, while labels these angles in the laboratory frame. The Guinea-Pig simulation includes the intrinsic transverse momentum of the particles in the bunches, so that the initial pair is not strictly at rest in the laboratory frame, which in turn creates a smearing by a few tens of rad around the production angle. The mean of is zero irrespective of the kinematic properties of the event.
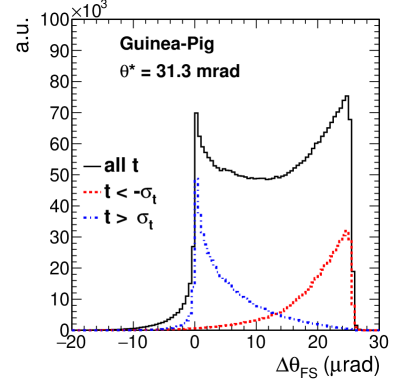
As depicted in Fig. 1, the electrons and positrons emerging from a Bhabha interaction experience the field of the opposite charge bunch. The left panel of Fig. 2 shows the distribution of the angular deflection of GeV electrons emitted at a fixed angle mrad, as predicted by Guinea-Pig. It is defined as the difference between the polar angle of the outgoing electron before and after this deflection, , where denotes the final polar angle, such that a positive quantity corresponds to a focusing deflection towards the beam direction.
For “late” interactions that occur after the cores of the two bunches have crossed each other, the final state do not see much of the bunch charge and many of them are minimally deflected. On the contrary, for “early” interactions that take place when the two bunches just start to overlap, the emitted travel through the whole bunch and are largely deflected. These observations explain the two peaks seen in Fig. 2.
 |
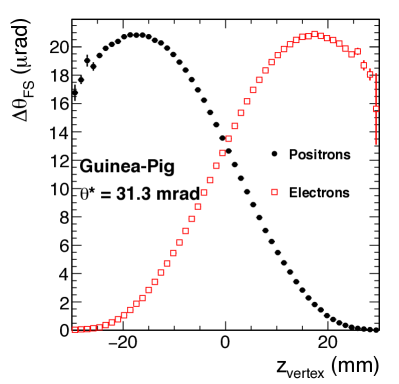 |
The right panel of Fig. 2 shows the average deflection of such electrons as a function of the interaction vertex position . Here, the positrons have a positive momentum in the direction, such that, when is large and negative, they cross the whole electron bunch. In contrast, they see little charge from this bunch when is large and positive, resulting in a vanishing deflection. The electron deflection follows a symmetric behaviour.
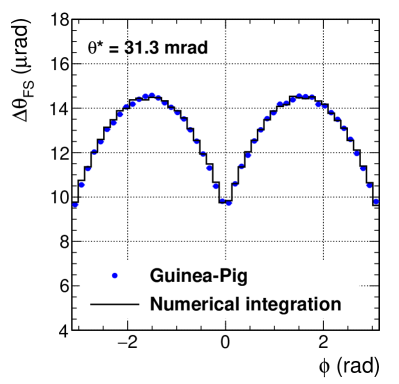
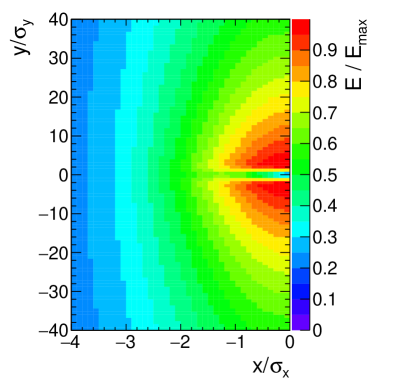
The left panel of Fig. 3 shows how the strength of the focusing strongly depends on the azimuthal angle of the electrons: it is maximal for electrons emitted vertically at and smaller by about for electrons emerging horizontally at or . This plot also shows that the Guinea-Pig simulation and the numerical integration mentioned in Section 2 are in agreement. The dependence reflects the fact that, since the bunches are flat with , the electromagnetic field created by the bunches is much stronger along the than along the direction, as illustrated in the right panel of Fig. 3.
 |
 |
For electrons emerging close to the lower (upper) edge of the narrow LumiCal acceptance, the average deflection amounts to rad (rad). The net effect is that the number of electrons detected in the LumiCal, in the range , is smaller than the number of Bhabha electrons emitted within this range, which leads to an underestimation of the luminosity. From the expression of the counting rate of leading-order Bhabha events in the LumiCal,
the bias induced by this angular deflection reads
| (3) |
which, numerically, leads to a bias of the measured luminosity by .
This effect is larger than the experimental uncertainty of the luminosity measurement reported in Ref. [7] for 1994.
To assess the effect of higher-order electroweak corrections (including initial-state and final-state radiation, ISR and FSR), a sample of about four million Bhabha events, produced with the BHLUMI 4.04 Monte-Carlo event generator [14], from which the LEP experiments determined their acceptance, was used to estimate a multiplicative “ factor” on the luminosity bias. Both ISR and FSR lead to softer electrons and positrons in the final state, which thus experience a stronger focusing. This effect tends to increase the luminosity bias by typically 5%. In addition, ISR causes a longitudinal boost of the final-state leptons, resulting in a nontrivial effect on the effective LumiCal acceptance and therefore on the luminosity bias, which gets reduced by typically 1.5%. Finally, FSR photons are usually emitted at a small angle with respect to the final state leptons, and smear their direction symmetrically at larger and smaller angles, yielding a second-order effect on average. A clustering algorithm is likely to merge the electron and the radiated photon into a single cluster, thereby compensating for this small effect. An accurate evaluation of the latter, which would probably require the BHLUMI events to be processed through a full simulation of the LumiCal and a cluster reconstruction algorithm to be run on the simulated energy deposits, is therefore not crucial.
The ISR/FSR-corrected luminosity bias is determined here with BHLUMI events from the kinematic properties of the final-state charged leptons only. With a loose lower-energy cut of GeV on the final-state leptons, a bias of is obtained. If it is required in addition, as in Ref. [7], that both leptons have an energy above ; that the average of their energies exceed , with ; and that their acoplanarity and acollinearity be smaller than 200 and 10 mrad, respectively; the resulting bias amounts to , corresponding to a factor of with respect to leading-order Bhabhas.
4 Luminosity bias and impact on the measurement of the number of light neutrino species
The calculation presented in the previous section for OPAL in 1994 was repeated for the four experiments and the last three years of LEP1 operation (1993–1995). The corresponding angular ranges are shown in Table 1, and the LEP beam parameters are given in Table 2. The luminosity biases determined from these inputs by Guinea-Pig with leading-order Bhabha events are displayed in Table 3 for GeV. The multiplicative correction factor, arising from higher-order effects and energy/angular cuts, as discussed in the previous section, is also indicated. The larger OPAL factor arises from the tight acollinearity requirement, absent from the selection criteria of the other experiments, which compensates for the reduction due to the initial-state radiation boost.
| Year | ALEPH | DELPHI | L3 | OPAL |
|---|---|---|---|---|
| 1993 | ||||
| 1994 | ||||
| 1995 | ||||
| factor |
The luminosity bias is proportional to the bunch population and is found to scale with the horizontal bunch size like , which explains the year-to-year variation. The dependence on the vertical bunch size and the bunch length is much milder, and amounts to about () when varying () by . The luminosity bias is also inversely proportional to the beam energy [9], as more energetic charged particles get less deflected by a given electromagnetic force. Each experiment collected data at the Z peak ( GeV) every year, but also off-peak data ( and GeV) in 1993 and 1995, when the luminosity bias was smaller. The luminosity biases at each centre-of-mass energy, averaged over the three years, are listed in Table 4.
| (GeV) | ALEPH | DELPHI | L3 | OPAL | LEP |
|---|---|---|---|---|---|
| 89.446 | |||||
| 91.224 | |||||
| 93.003 |
The number of light neutrino species was measured by each LEP experiment to be
| (4) | |||||
| (5) | |||||
| (6) | |||||
| (7) |
including a fully correlated uncertainty of that comes from the common Bhabha cross-section theory error (), the uncertainty on the QED corrections to the Z lineshape (), and the uncertainty on () [1]. An underestimation of the luminosity at the peak leads to an overestimation of and, therefore, to an underestimation of (Eq. 1), given by:444This relation is rounded in Ref. [1] to
| (8) |
The luminosity biases in Table 4 thus result in an increase of by in ALEPH, in DELPHI, in L3, and in OPAL, and yield an overall increase of the LEP average, with respect to Eq. 2. It was checked (Section 5) that the data recorded in the 1990-1992 period has a negligible impact on this estimate, because of the very significantly larger luminosity uncertainties (by a factor of 5 to 10) in the early LEP period [20]. On the other hand, the most up-to-date calculation of higher-order corrections and the most recent measurements of the Higgs boson and top quark masses yield a small change in from [1] to [2]. When this change is included, the correction to increases by to , and benefits from a small uncertainty reduction. Altogether, the combination of the four LEP experiments for the number of light neutrino species becomes
| (9) |
Equivalently, the luminosity biases in Table 4 result in a reduction of the peak hadronic cross section, , by pb, from nb to nb. It is also interesting to note that the smaller luminosity bias for off-peak data ( and ) than for on-peak data () causes the Z total decay width to slightly increase by MeV, from GeV [1] to GeV. The Z mass is insignificantly modified by keV. The correlations between the Z mass, the Z width, and the peak hadronic cross section remain untouched with respect to those given in Ref. [1]. Other electroweak precision observables (asymmetries, ratios of branching fractions) are not affected.
Crosscheck measurements of the Guinea-Pig calculations are in principle possible, by exploiting the focusing properties shown in Fig. 3 (left) and Fig. 2 (right). Unfortunately, the LEP statistics do not suffice to allow a data-driven determination of the luminosity bias. It would potentially be possible to see some evidence of the focusing effect by observing the modulation of the Bhabha counting rate resulting from the behaviour shown in Fig. 3. If the four experiments are combined, the significance of such a measurement would be about , assuming that potential misalignments of the luminometer system with respect to the interaction point can be corrected for.
It is also possible to define an asymmetry directly proportional to the luminosity bias. To do so, the sample of events selected for the luminosity measurement is split in two sub-samples, according to the sign of the of the events.555The of Bhabha events can be determined at LEP with a resolution of about mm, from the intersection of the line joining the two clusters and the axis in the plane. Four counts are defined, representing the number of (first subscript) measured in the narrow acceptance of one arm of the LumiCal in events with positive or negative (second subscript). The geometrical change in acceptance induced by the different selections can be corrected for on average. As shown in Fig. 2 (right), since the electrons with are more deflected than electrons with , , such that the asymmetry between these two numbers is proportional to the luminosity bias. The average between the asymmetries built from the electron counts and the positron counts would additionally allow misalignment effects to partially cancel. This asymmetry, which amounts to about , can be observed with a significance of using the statistics collected by the four experiments.
At a future linear collider, a precise measurement of this asymmetry may be possible, thereby offering an experimental cross-check of the luminosity bias determined by the calculations. Ways to determine the bias at the future circular collider exploit the crossing angle with which the bunches collide, and are described in Ref. [9].
5 Systematic studies
A number of simplifying assumptions are made in the previous sections to derive the result presented in Eq. 9. In Table 2, the average luminosity-weighted number of particles per bunch is inferred from measurements of bunch currents and instantaneous luminosities performed every 15 minutes and recorded in a private database [21]. This number was cross-checked to agree within a few per mil with an analytical calculation involving the mean value of the bunch current distributions in collisions [22, 23], the average coast duration [24] and the average luminosity lifetime .666The average luminosity lifetime is obtained by requiring the average bunch currents of Refs. [22, 23] to coincide every year with those computed from the average bunch currents measured at the beginning of the coasts [24]. The luminosity lifetime estimates ( hours in 1993, 15 hours in 1994, and 18 hours in 1995) are well-compatible with the relation [22], with an average vertical beam-beam tune shift of 0.027 in 1993, 0.034 in 1994, and 0.023 in 1995 [24], and with hours. The average horizontal bunch size and bunch length are derived from the variance of the primary vertex position distribution, measured by the experiments [7, 25, 26]. The values are taken from Ref. [24], and the vertical bunch size is obtained by the approximate relation [10]. In all instances, it was assumed that all these beam parameters stayed constant over each year.
The corresponding potential systematic effects were studied as explained below, and are summarized in Table 5.
-
1.
The bunch current in collisions was measured with an uncertainty of [21], which translates directly to the luminosity bias.
- 2.
-
3.
The horizontal bunch size and the bunch length agreed among the LEP experiments within 5%. The luminosity bias varies like , and is therefore uncertain by . The bias variation with is .
-
4.
The vertical bunch size was too small to be measured reliably by the experiments. The relation used above to infer assumes that the horizontal and vertical beam-beam tune shifts were equal [27]. At LEP, this was only approximately the case, with ratios of 1.3 or more [10]. Such a value causes to decrease by , and the luminosity bias to relatively increase by . An uncertainty of is assigned to this correction.
-
5.
The luminosity bias is, to first order, proportional to . It is determined above from the luminosity-weighted average of and , but a time-dependent analysis would be in order. In the beam-beam limit, the luminosity, the emittances, and the product approximately varied like the beam current [27], i.e., . The horizontal and the vertical bunch sizes therefore both varied like . The relative effect of a time-dependent analysis can therefore be estimated by comparing the ratio of to (time-independent), to (time-dependent), where means “luminosity-weighted average”. The time-dependent average is found to be smaller. Because the above time dependence of the luminosity and the horizontal bunch size is only approximate, an uncertainty of half the correction is assigned to this estimate.
-
6.
The “technical” accuracy of Guinea-Pig can be evaluated by comparing the Guinea-Pig predictions with those of the independent numerical integration shown in Fig. 3. For mrad, the predictions of the average deflection agree within . This comparison yields an uncertainty of , to which a statistical uncertainty of is added to account for the size of the BHLUMI event samples used to determine the factors.
-
7.
The values of and were made to vary by up to , independently at each interaction point, to equalize the luminosities in the four experiments. The luminosity bias is found to be immune to such changes (other things being equal).
-
8.
Non-Gaussian beam profiles and partial overlap of colliding bunches could also cause changes in the bias estimate. Regular “vernier” scans were performed to adjust the vertical overlap of the beams by varying in steps their vertical separation. The measured resulting beam-beam deflection [28] allowed the validity of the Gaussian beam profile assumption to be checked, and the vertical overlap to be adjusted to better than m, leading to negligible systematic effects.
-
9.
The acceptance of each of the LumiCals considered in Table 1 is rounded to the nearest tenth of a mrad, inducing a relative uncertainty of on the luminosity bias.
-
10.
The statistical, experimental, and theoretical uncertainties on the integrated luminosity, which enter the averaging procedure over all three years and all four experiments, were in general quoted in the LEP experiments’ publications in integer units of , and sometimes , for each LEP running period. The resulting uncertainty on the luminosity bias is evaluated to be .
- 11.
Other effects from, e.g., detailed electromagnetic shower simulation and clustering algorithms applied to final state prior to applying energy and angular selection criteria, are not easy to estimate precisely, and would require the participation of the LEP experiments. Conservatively, an uncertainty of is assigned to these effects.
| Source | Systematic effect |
|---|---|
| Bunch currents | |
| imbalance | |
| Horizontal bunch size | |
| Bunch length | |
| Vertical bunch size | |
| Time dependence | |
| Technical accuracy | |
| functions at IP | small |
| Bunch profiles | small |
| bunch overlap | small |
| LumiCal acceptance | |
| Averaging procedure | |
| 1990-1992 data | |
| Other effects | |
| Total |
The relative correction on the luminosity bias of (Table 5) yields a small decrease of by , which, everything considered, amounts to . When this correction is applied, the final LEP combination for the number of light neutrino species becomes
| (10) |
while the peak hadronic cross section and the Z width remain as indicated in Section 4.
6 Conclusions
The bias of the luminometer acceptance, induced by the focusing of the final state electrons and positrons from small angle Bhabha scattering by the opposite-charge bunches, has been quantified for the four experiments operating at LEP at and around the Z pole. The integrated luminosity at the peak has been found to be underestimated by about , a bias larger than the uncertainty reported by the experiments in this period. When this bias is corrected for, the number of light neutrino species determined by the combined LEP experiments from the invisible decay width of the boson increases by of its uncertainty. The corresponding long-standing deficit on is thereby reduced to about one standard deviation:
The luminosity biases at and off the Z peak have also been found to modify the hadronic cross section at the Z peak and the Z width, which become:
No other electroweak precision observable is affected. This result has been obtained from averaged LEP operation parameters for each year of the 1990–1995 period. The effects of using averaged values rather than carrying out a time-dependent analysis have been evaluated to be negligible at the level of the current accuracy on the number of neutrino species. Measurements of selected LEP operation parameters have been performed every 15 minutes between 1989 and 2000. These measurements were partially recorded in a private database that still exists, which opens the possibility of a time-dependent analysis.
Acknowledgements
We are grateful to Daniel Schulte, Helmut Burkhardt, Gianluigi Arduini, Nicola Bacchetta, Konrad Elsener, Dima El Khechen, Mike Koratzinos, Katsunobu Oide, Dmitry Shatilov, and Jörg Wenninger, for very useful discussions, suggestions and input that they have brought into this work.
References
- [1] ALEPH, DELPHI, L3, OPAL, SLD, LEP Electroweak Working Group, SLD Electroweak Group, SLD Heavy Flavour Group, S. Schael et al., Precision electroweak measurements on the Z resonance, Phys. Rept. 427 (2006) 257–454, [hep-ex/0509008].
- [2] Particle Data Group, M. Tanabashi et al., Review of Particle Physics (Electroweak Model and Constraints on New Physics from J. Erler and A. Freitas), Phys. Rev. D98 (2018) 030001.
- [3] J. Erler and A. Freitas. Private commnunication.
- [4] ALEPH Collaboration, D. Buskulic et al., Performance of the ALEPH detector at LEP, Nucl. Instrum. Meth. A360 (1995) 481–506.
- [5] T. Camporesi, V. Obratzsov, M. Paganoni, F. Terranova, M. Bigi, I. Gouz et al., “Luminosity measurement in 1994 with the STIC detector.” https://cds.cern.ch/record/2629467, 1997.
- [6] I. C. Brock, A. Engler, T. Ferguson, F. Filthaut, R. W. Krämer, M. Merk et al., Luminosity Measurement in the L3 Detector at LEP, Nucl. Instrum. Methods Phys. Res., A 381 (Jun, 1996) 236–266.
- [7] OPAL Collaboration, G. Abbiendi et al., Precision luminosity for line shape measurements with a silicon tungsten calorimeter, Eur. Phys. J. C14 (2000) 373–425, [hep-ex/9910066].
- [8] C. Rimbault, P. Bambade, K. Mönig and D. Schulte, Impact of beam-beam effects on precision luminosity measurements at the ILC, JINST 2 (2007) P09001.
- [9] G. Voutsinas, E. Perez, M. Dam and P. Janot, Beam-beam effects on the luminosity measurement at FCC-ee, Journal of High Energy Physics 2019 (Oct, 2019) 225, [1908.01698].
- [10] D. Brandt, H. Burkhardt, M. Lamont, S. Myers and J. Wenninger, Accelerator physics at LEP, Rept. Prog. Phys. 63 (2000) 939–1000.
- [11] D. Schulte, “Beam-Beam Simulations with GUINEA-PIG.” CERN-PS-99-014-LP, http://cds.cern.ch/record/382453, Mar, 1999.
- [12] M. Bassetti and G. A. Erskine, “Closed Expression for the Electrical Field of a Two-dimensional Gaussian Charge.” CERN-ISR-TH/80-06, https://cds.cern.ch/record/122227, 1980.
- [13] E. Keil, “Beam-beam dynamics.” CERN-SL-94-78-AP, Advanced accelerator physics. Proceedings, 5th Course of the CERN Accelerator School, Rhodos, Greece, September 20-October 1, 1993. Vol. 1, 2, Conf. Proc. C9309206 (1993) 539–547, https://cds.cern.ch/record/269336.
- [14] S. Jadach, W. Placzek, E. Richter-Was, B. F. L. Ward and Z. Was, Upgrade of the Monte Carlo program BHLUMI for Bhabha scattering at low angles to version 4.04, Comput. Phys. Commun. 102 (1997) 229–251.
- [15] L. Bugge, T. Buran, A. L. Read and E. Wilhelmsen, “The performance of the DELPHI SAT Tracker during 1991 and its contribution to the absolute luminosity measurement.” https://inis.iaea.org/collection/NCLCollectionStore/_Public/25/050/25050129.pdf?r=1&r=1, Jan, 1994.
- [16] ALEPH Collaboration, R. Barate et al., Measurement of the Z resonance parameters at LEP, Eur. Phys. J. C14 (2000) 1–50.
- [17] DELPHI Collaboration, P. Abreu et al., Cross-sections and leptonic forward backward asymmetries from the running of LEP, Eur. Phys. J. C16 (2000) 371–405.
- [18] L3 Collaboration, M. Acciarri et al., Measurements of cross-sections and forward backward asymmetries at the resonance and determination of electroweak parameters, Eur. Phys. J. C16 (2000) 1–40, [hep-ex/0002046].
- [19] OPAL Collaboration, G. Abbiendi et al., Precise determination of the Z resonance parameters at LEP: ’Zedometry’, Eur. Phys. J. C19 (2001) 587–651, [hep-ex/0012018].
- [20] B. Pietrzyk, High precision measurements of the luminosity at LEP, in LAPP-EXP-94-18, Proceedings, Tennessee International Symposium on Radiative Corrections: Status and Outlook, Gatlinburg, Tennessee, pp. 138–152, June 27 - July 1, 1994, http://cds.cern.ch/record/271909.
- [21] H. Burkhardt. Private commnunication.
- [22] H. Burkhardt, “What is the maximum bunch current we can collide at 45 GeV?.” CERN SL/95-08-DI, Proceedings of the fifth workshop on LEP performance, Chamonix, January 13-18, 1995, http://hbu.web.cern.ch/hbu/cham95mb.pdf.
- [23] H. Burkhardt, “Performance in physics.” CERN SL/96-005-DI, Proceedings of the sixth workshop on LEP performance, Chamonix, January 15-19, 1996, pp. 160-163, http://hbu.web.cern.ch/hbu/cham96pp.pdf.
- [24] G. Arduini et al., “LEP-1 operation, 1989-1995.” Proceedings, 5th European Conference, EPAC 96, Sitges, Spain, Vol. 1-3, Conf. Proc. C960610 (1996) 286-288, https://cds.cern.ch/record/307303.
- [25] M. Maggi, “Measured primary vertex smearing values in ALEPH.” http://aleph.web.cern.ch/aleph/aleph_general/kin/SVRT.html, 1999.
- [26] G. J. Barker, b-Quark Physics with the LEP collider: The Development of Experimental Techniques for b-Quark Studies from Z0 Decays, vol. 236, page 76. Springer Track in Modern Physics, 2010, 10.1007/978-3-642-05279-8.
- [27] H. Burkhardt, “Beam-beam tune shift, Emittance, and Lifetime.” CERN SL/94-06-DI, Proceedings of the fourth workshop on LEP performance, Chamonix, January 17-21, 1994, pp. 413-419, https://cds.cern.ch/record/261537.
- [28] C. Bovet, M. D. Hildreth, M. Lamont, H. Schmickler and J. Wenninger, “Luminosity optimisation using beam-beam deflections at LEP.” CERN-SL-96-025-OP, Proceedings of the 5th European Conference, EPAC 96, Sitges, Spain, June 10-14, 1996. Vol. 1-3, Conf. Proc. C960610 (1996), pp. 325-327, http://cds.cern.ch/record/306910.
- [29] R. Bailey, T. Bohl, F. Bordry, H. Burkhardt, P. Collier, K. Cornelis et al., “LEP Operation in 1993 with the Pretzel Scheme.” Proceedings of 4th European Particle Accelerator Conference, London, UK, 27 Jun - 1 Jul 1994, pp.439, https://cds.cern.ch/record/921985, 1994.
- [30] DELPHI Collaboration, P. Abreu et al., Improved Measurements of Cross-Sections and Asymmetries at the Resonance, Nucl. Phys. B 418 (Feb, 1994) 403–430.
- [31] L3 Collaboration, M. Acciarri et al., Measurement of cross sections and leptonic forward-backward asymmetries at the Z pole and determination of electroweak parameters, Z. Phys. C 62 (Mar, 1994) 551–576.