Value-added catalogs of M type stars in LAMOST DR5
Abstract
In this work, we present new catalogs of M giant and M dwarf stars from the LAMOST DR5. In total, 39,796 M giants and 501,152 M dwarfs are identified from the classification pipeline. The template-fitting results contain M giants with 7 temperature subtypes from M0 to M6, M dwarfs with 18 temperature subtypes from K7.0 to M8.5 and 12 metallicity subclasses from dMr to usdMp. We cross-matched our M-type catalog with the 2MASS and catalog to obtain infrared magnitude and colors. Adopting the distances derived from the parallaxes in Gaia DR2, the vs. diagram shows that there are also early-type stars and white dwarf-M dwarf binaries included in our M type stars sample, with a contamination rate of about for M giants and for M dwarfs. We found that CaH spectral indices are an efficient selection criteria for carbon stars. A total of 289 carbon stars were identified from the M giants sample, and further confirmed by LAMOST spectra.
1 Introduction
M giant stars are evolved objects with high luminosity (log 3-4), which enables them to be detected at large distances. Therefore, M giant stars are suitable as tracers for discovering and identifying the remnants of stellar streams in the Galactic halo, revealing the accretion and merging history of the Milky Way.
In the past two decades, a set of large-scale survey projects (e.g. 2MASS, UKIDSS, WISE, Pan-STARRS, Gaia ) gathered photometric data for thousands of M giants, which provide key support for the study of substructures, especially for the Sagittarius stream. By selecting candidates from the 2MASS, M giants were first used to map out the global view of the Sagittarius Dwarf Galaxy (Majewski et al., 2003). More recently, using UKIDSS, Bochanski et al. (2014) established a distant M giant sample to explore the Sagittarius accretion history in the outer halo of our Galaxy.
Compared to the photometrically derived samples, there are advantages to study Galactic substructures by using spectral data of M giants. First of all, the spectra provide more features for selecting a pure sample. Secondly, an estimate of the radial velocity derived from the spectra provides an important evidence for substructure membership identification. Third, chemical abundances measured from the spectra are more reliable, and thus useful for a more detailed study of substructures. Consequently, a spectral sample of M giants with large numbers and wide sky coverage has a great scientific value for the study of Galactic substructures.
A small catalog of M giants selected using SDSS and LAMOST DR1 spectra were used to detect members of the Sagittarius stream and identify new substructures (Chou et al., 2007; Bochanski et al., 2014; Li et al., 2016b, 2019). In order to make optimal use of the M giant sample in LAMOST, a clean and relatively complete M giant catalog with high precision distance estimates is highly desirable.
In this work, we present a much larger catalog of spectroscopic M giants than those available in the literature. The paper is organized as follows. In section 2, we describe how we select M giants and M dwarfs from LAMOST DR5. In section 3, we describe the separation between M giants, M dwarfs, and carbon stars using photometric and spectroscopic index features. A summary is presented in the last section.
2 Candidates selection in LAMOST DR5
As the most efficient spectroscopic survey telescope, the LAMOST, also named as Guo Shou Jing Telescope, has finished the first stage of its regular survey (LAMOST-I; 2011-2017; including the pilot survey), and provided 9,017,844 low-resolution (R 1,800) optical spectra in its fifth data release, of which 8,171,443 are stellar spectra. (Cui et al., 2012; Zhao et al., 2012; Luo et al., 2012)
In order to identify M-type stars from the LAMOST database, Zhong et al. (2015a) developed an automatic template-fitting algorithm to classify late-type stars. After performing the rest frame correction and the pseudo-continuum normalization of LAMOST spectrum in the range 6,000-8,000Å, values between the target spectrum and M-dwarf template spectra were calculated, with the best fit template defined as the template spectrum which corresponds to the minimum value. Because of the low surface temperature of M-type stars, the obvious characteristics of M-type spectra are molecular absorption features (e.g., CaH, TiO, VO). Stars were rejected when they do not display any molecular absorption features and the best fit template is a non-M dwarf template (e.g., K-type stars or hotter stars). Only stars whose spectrum has molecular absorption features were labelled as M-type stars.
Using the M-type spectra identified from LAMOST DR1, Zhong et al. (2015b) found that M giants and M dwarfs can be well discriminated in the CaH2+CaH3 vs.TiO5 spectral indices diagram. Then, a set of M giant templates with high signal-to-noise ratio were assembled, with spectral subtypes ranging from M0 to M6. Combining with the M giant templates and the previous M dwarf templates (Zhong et al., 2015a), an extended set of M-type spectral templates were used to perform the M-type stars identification and classification from LAMOST DR1. From that work, a total of 8,639 M giants as well as 101,690 M dwarfs were positively classified by the template-fitting algorithm (Zhong et al., 2015b).
Furthermore, using the confirmed M giants sample from LAMOST, Li et al. (2016a) found that the combination of WISE+2MASS bands is more efficient at selecting M giant samples than the 2MASS bands alone. Based on the revised infrared selection criteria, a relatively complete photometric sample of M giants was determined. Then, after combining with APOGEE data, a strong correlation between the W1-W2 color and [M/H] was found for M giants. Given the derived relation, Li et al. (2016a) estimated the photometric metallicity of M giants and further derived their photometric distances, which used the LMC, the SMC, and the Sagittarius core for calibration. The derived photometric distance uncertainties were estimated at 20%.
In this work we have adopted the same template-fitting pipeline combined with a classification algorithm (Zhong et al., 2015a) and revised M-type spectral templates (Zhong et al., 2015b) to identify and classify M-type stars from LAMOST DR5. Although the optimized template-fitting algorithm largely eliminates the majority of noisy spectra in LAMOST, a small fraction of weird spectra still remain in the M-type stars sample; most of these suffer low S/N or serious sky line contamination. To further purify the M-type stars sample, candidates have to meet the following two additional criteria: (i) the mean S/N in the range 6,000-8,000 Å must be greater than 5; (ii) the spectral indices must be located on the M-type stars locus (0 TiO5 1.2 0.6 CaH2+CaH3 2.4). After excluding outlier spectra and combining duplicated spectra, a total of 540,948 spectra were identified as M-type stars, including 39,796 M giant spectra and 501,152 M dwarf spectra.
3 Data analyses and classification results
3.1 M giants and M dwarfs
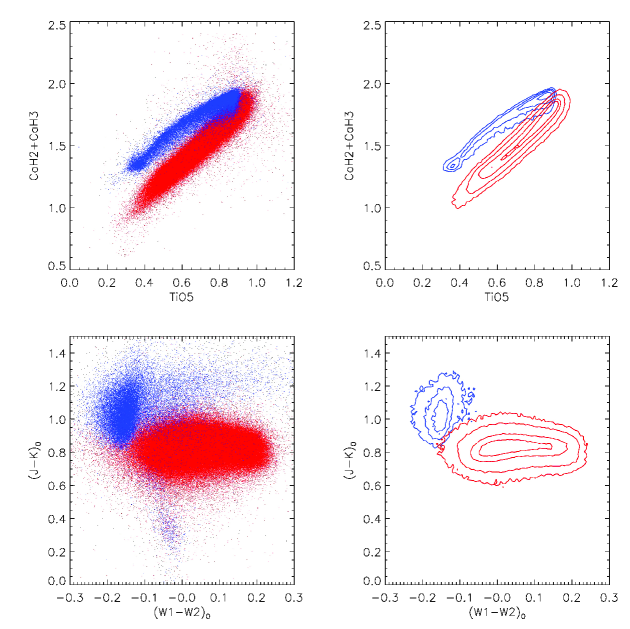
As we described in Zhong et al. (2015b); Li et al. (2016a), M giants and M dwarfs can be well segregated through the spectral indices diagram and the infrared color-color diagram. To verify the reliability of our classification results, we re-checked the distribution of M giants and M dwarfs with spectral indices and infrared colors as described below.
First, we cross-matched our M-type catalog with the 2MASS (Skrutskie et al., 2006) and WISE (Wright et al., 2010) infrared catalogs, using a search radius of 3. In order to correct the reddening of infrared colors, a 3D Galactic dust map is needed. Since the stellar distance is an important input parameter for calculating reddening in 3D dust maps, we adopted the estimated distances from Bailer-Jones et al. (2018), which were derived from the Gaia DR2 parallaxes (Gaia Collaboration et al., 2018). After further cross-matching our catalog with the value-added catalog (Bailer-Jones et al., 2018) in Gaia DR2 , the final common catalog contains 37,383 M giants and 472,418 M dwarfs. These number represent a loss of 6.0% M giants and 5.7% M dwarfs compared with the M-type star catalog in LAMOST DR5. This is because the magnitude of the excluded LAMOST M-type stars are located outside of the common magnitude range (e.g., either too faint for 2MASS/WISE catalog or too bright for Gaia catalog), or because the parallax uncertainty of those excluded stars is too large to derive a reliable distance (Bailer-Jones et al., 2018).
In order to derive the intrinsic and (W1-W2)0 of each M-type star, using the common catalog with multi-band photometry and stellar distance, we adopted the Galactic reddening E(B-V) in 3D dust maps of Green et al. (2018), in combination with the extinction coefficients which were determined by Yuan et al. (2013). The extinction in a given band were calculated as Ai=Ri E(B-V), where Ri is defined as the extinction coefficient of band relative to E(B-V). In order to estimate extinction and further derive de-reddened infrared magnitude , , , W10 and W20, the adopted extinction coefficient Ri for each band were 0.72, 0.46, 0.306, 0.18, and 0.16, respectively (Yuan et al., 2013).
In Figure 1 we use M-type stars in the common catalog to plot the spectral indices diagram (upper panels) and the de-reddened versus (W1-W2)0 color-color diagram (bottom panels). Throughout panels, the distributions of M giants and M dwarfs are represented as blue and red colors respectively, both of which were identified by our template-fitting algorithm. As expected, the majority of M giants and M dwarfs are well-separated in both the spectroscopic and photometric parameter space, which also clearly illustrates the different properties of these two populations. However, there are a few blue dots located on the lower color region with 0.8 in the lower-left panel. As pointed out in Li et al. (2016a), stars located on the blue region of the intrinsic color are more likely to be K-type stars, but have been misclassified as M giants in our sample.
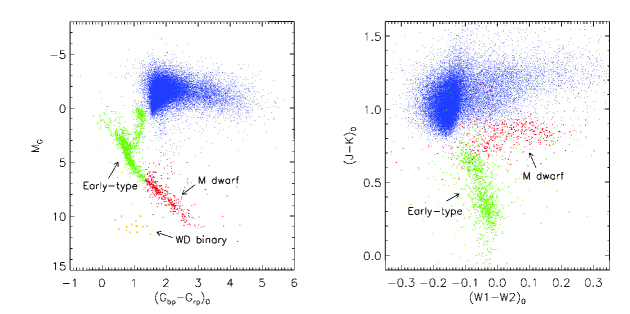
To further study the contaminants in our M giants sample, we calculate the absolute magnitude and intrinsic color of each M giant star. Distance modulus and 3D dust maps were determined by Bailer-Jones et al. (2018) and Green et al. (2018), while the extinction and reddening were calculated as = and (Casagrande & VandenBerg, 2018). The extra photometric and astrometric information provides a means of cross-validation of the spectral types and their properties.
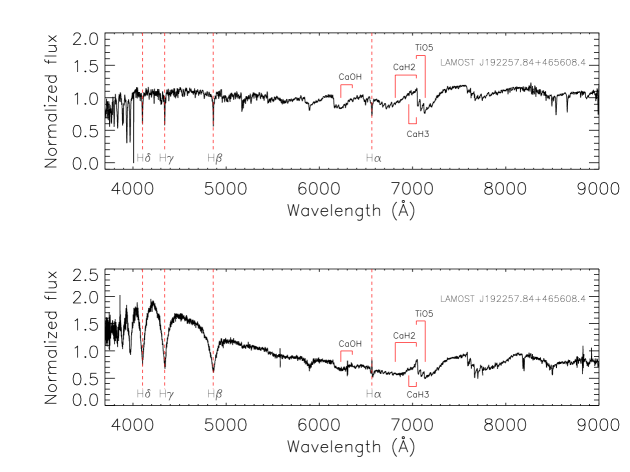
Figure 2 shows the distribution of M giants which were identified by our template-fitting algorithm. In the left panel, stellar locations in the MG versus diagram (Gaia Collaboration et al., 2018) indicate that there are indeed contaminants in the M giants sample, including early-type stars, M dwarfs, and a few white dwarfs. We replot the de-reddened versus (W1-W2)0 color-color diagram of M giants in the right panel. Early-type stars and M dwarfs which were labeled with green and red dots in the left panel also show different distributions from bona fide M giants in the infrared color-color diagram. Comparing with the distribution of K/M stars in Li et al. (2016a), the location of each stellar component is consistent with the reported region. Furthermore, we performed close visual inspection of the LAMOST spectra for each of these non-M giants. We find that a large fraction of identified early-type star candidates are main sequence-M giant binaries, and all labeled white dwarfs are white dwarf-M dwarf binaries. In Figure 3, we plot LAMOST spectra of these two kinds of binaries as examples. In particular, the early-type stars and M dwarfs in the M giants sample were labeled as non-M giants and the white dwarfs were labeled as white dwarf binaries in the M giants catalog (see Section 5).
The total number of non-M giant stars is 1,712 (including white dwarf binaries), corresponding to a contamination rate of about 4.6 in the M giants sample, which is similar with the contamination rate (4.7) reported in Zhong et al. (2015b).
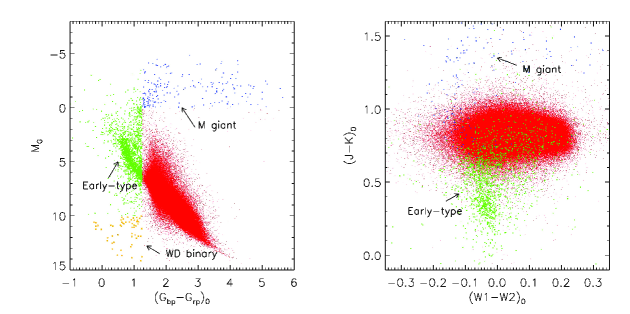
Similarly, figure 4 shows the color-magnitude distribution of all identified M dwarfs. In order to exclude misidentified sources from the M dwarfs sample, we use the following criteria to separate contaminants into three groups: for early-type sources; for white dwarf sources; for M giant sources. For those non-M dwarfs sources, we performed visual inspection of their corresponding LAMOST spectra. We find that a large number of non-M dwarf sources which were labeled as early-type or white dwarf are binaries. The total number of non-M dwarfs sources is 2281, corresponding to a contamination rate of 0.48% in the M dwarfs sample.
. Column Format Unit Description DESIGNATION string - object designation from the LAMOST DR5 RA float deg object right ascension in LAMOST DR5 (J2000) DEC float deg object declination in LAMOST DR5 (J2000) CaH2 float - spectral index of LAMOST spectrum CaH3 float - spectral index of LAMOST spectrum TiO5 float - spectral index of LAMOST spectrum SNR float - signal to noise ratio of i filter in LAMOST spectrum SpTy string - specral subtype classified by the template-fitting algorithm Gmag0 float mag dereddened G band magnitude from Gaia DR2 Gbp0 float mag dereddened BP band magnitude from Gaia DR2 Grp0 float mag dereddened RP band magnitude from Gaia DR2 J0 float mag dereddened J band magnitude from 2MASS H0 float mag dereddened H band magnitude from 2MASS KS0 float mag dereddened KS band magnitude from 2MASS W10 float mag dereddened W1 band magnitude from WISE W20 float mag dereddened W2 band magnitude from WISE EBV float mag reddening from the 3D dust map Dist float pc distance derived by the parallax in Gaia DR2 RV float km s-1 radial velocity measured from LAMOST spectrum float - estimated photometric metallicity of M giants X float pc Galactocentric coordinate points to the direction opposite to that of the Sun Y float pc Galactocentric coordinate points to the direction of Galactic rotation Z float pc Galactocentric coordinate points toward the North Galactic Pole U float km s-1 Galactic space velocity in X axis V float km s-1 Galactic space velocity in y axis W float km s-1 Galactic space velocity in Z axis SFLAG string - label of subsamples
3.2 Carbon stars
Carbon stars are peculiar objects which show an inversion of the C/O ratio (C/O 1). Since their spectra are dominated by strong carbon molecular bands (CH, CN or C2), many of them are considered as asymptotic giant branch (AGB) stars undergoing the third dredge-up process. Moreover, in the revised Morgan–Keenan (MK) classification system (Keenan, 1993), nearly half of the carbon star sequence corresponds to ordinary oxygen late-type stars because of their low surface temperature. We believe that a small number of late-type carbon stars were included in the M-type catalog and mis-classified as M giants in our sample.
Using the LAMOST spectroscopic data, carbon stars have been systematically investigated by a few authors. Si et al. (2015) found 183 carbon stars from the LAMOST pilot survey with an efficient manifold ranking algorithm. In the LAMOST DR2 catalog, Ji et al. (2016) reported identifying 894 carbon stars, using a series of spectral indices (C2 in 5,635 Å, Ba II in 4,554 Å, CN in 7,065 Å and 7,820 Å) as the selection criteria. Using an efficient machine-learning algorithm, Li et al. (2018) presented a catalog of 2,651 carbon stars from the LAMOST DR4. After de-duplicating these published catalogs, the number of carbon stars in LAMOST are 2,812 objects in total.
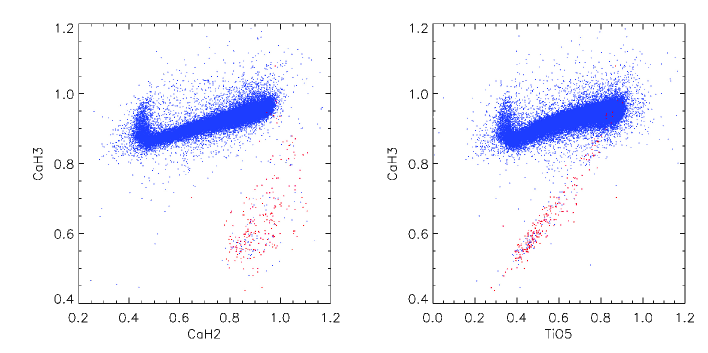
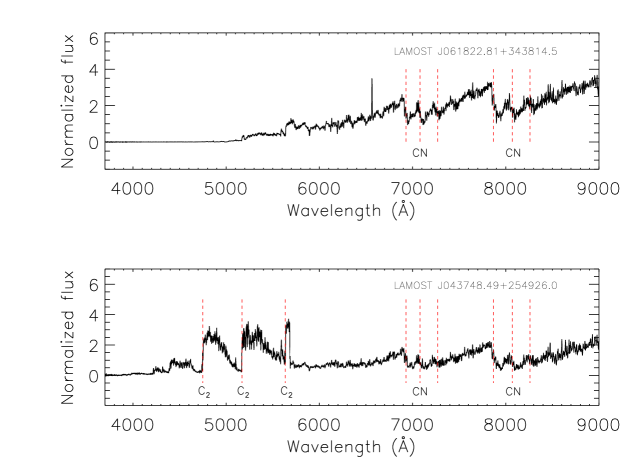
Combining with our M giants catalog and the published carbon stars catalog in LAMOST, 224 common stars were identified. Figure 5 shows the spectral indices of our M giants catalog, where known carbon stars are marked as red dots. The concentrated distribution of carbon stars strongly suggests that the CaH spectral indices is an efficient criteria for selecting carbon stars in the M giants sample. To do this simply, we select carbon star candidates whose spectral indices satisfy the following criteria [CaH3 - 0.8 CaH2 - 0.1] 0. Of the 314 carbon star candidates which passed through the selection criteria, 289 were confirmed as carbon stars by visual inspection of LAMOST spectra, while most of the excluded stars have low signal-to-noise ratio spectra. Two representative carbon spectra from LAMOST are shown in Figure 6 as examples.
| Source type | Label | M giants catalog | M dwarfs catalog |
|---|---|---|---|
| Confirmed M type stars | m | 35,382 | 470,137 |
| Non-M type stars | n | 1697 | 2224 |
| Carbon stars | c | 289 | 0 |
| White dwarf binaries | w | 15 | 57 |
| Unconfirmed M type stars | u | 2413 | 28,734 |
| Total | 39,796 | 501,152 |
4 Properties of M giants
4.1 Metallicity Estimation
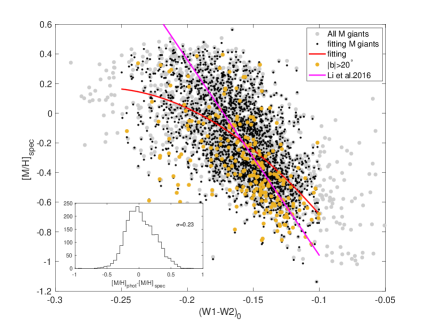
In this section, we compare the photometry of our M giants to the spectroscopic metallicity obtained using data from the SDSS project APOGEE (Holtzman et al., 2015). This survey is taking high-S/N and high-resolution (R=22,500) NIR spectra, resulting in detailed chemistry and a measurement of [M/H] to a precision of better than 0.1 dex. As in Li et al. (2016a), we cross-matched our M giant samples with APOGEE DR14, finding 2,895 stars in common, of which 2,689 are classified as true M giants, providing a much larger sample than used for fitting in Li et al. (2016a). Figure 7 shows the APOGEE metallicities of the resulting sample of 2,689 M giants as a function of color. The correlation with can be fit with the following polynomial relation:
| (1) |
As can be seen from the inset of Figure 7, the residual scatter about this relation is 0.23 dex. We compare the new result to the previous similar work in Li et al. (2016a), shown as a purple line in the figure. It should be noted that our fits are only effective in the [M/H] range from dex to dex.
4.2 Galactocentric coordinates and space motions
We calculate the Galactocentric coordinates (X,Y,Z) and space velocities (U,V,W) for all confirmed M giants. The solar position and the circular velocity at the solar location are adopted as R0=-8.34 kpc and Vc=240 km s-1 (Reid et al., 2014). To correct for the solar motion, we adopt the peculiar velocity of the Sun in the local standard of rest (U⊙, V⊙, W⊙)=(11.1, 12.24, 7.25) km s-1 (Schönrich et al., 2010).
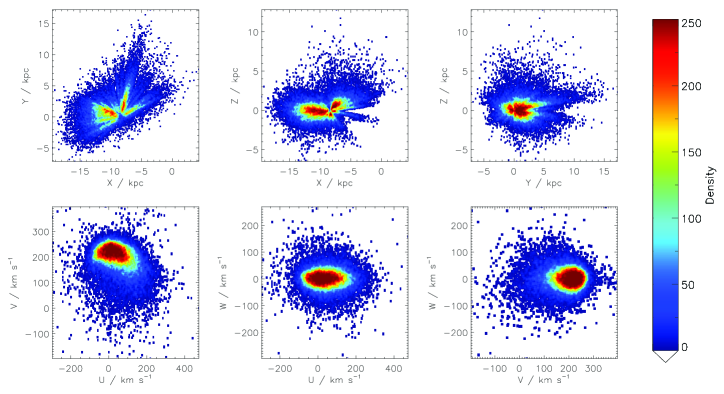
Figure 8 shows the Galactocentric spatial distribution and space velocity distribution for confirmed M giants. Since a large part of LAMOST observations are focused on the Galactic Anti-center, most of the identified M giants in our catalog are also located on this region. Another prominent clump of M giants is in the field, centered on , , which has been observed repeatedly by LAMOST. The spatial distribution of M giants clearly shows that most of M giants are located on the Galactic disk and that the Galactocentric distances are less than 18 Kpc.
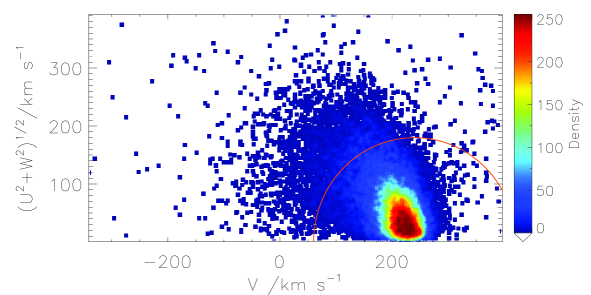
We summarize the kinematic components of the M giants sample with a Toomre diagram in Figure 9. The halo stars are defined as having V - V 180 km s-1 (Venn et al., 2004; Schönrich, & Binney, 2009), where VLSR=(0,240,0) km s-1. The total number of halo stars selected in this manner is 5,334, constituting about 14 of our M giants sample.
5 Catalog description
The complete catalog of M-type stars is provided in the electronic version of this paper, including 39,796 M giants and 501,152 M dwarfs. As described in Zhong et al. (2015a), the classification results contain M giants with 7 temperature subtypes from M0 to M6, as well as M dwarfs with 18 temperature subtypes from K7.0 to M8.5 and 12 metallicity subclasses from dMr to usdMp. Since the spectral templates were corrected to the rest frame, the radial velocity of M giants and M dwarfs were calculated with a measurement uncertainty of about 5 km s-1 (Zhong et al., 2015b). Spectral indices of CaH2, CaH3 and TiO5 were provided for measuring molecular features, which were defined by Reid et al. (1995) and Lépine et al. (2007). In addition, our catalog includes photometry in optical bands Gmag/Gbp/Grp from Gaia DR2, near infrared bands J/H/KS from 2MASS, infrared bands W1/W2 from WISE, and distance as derived from the parallax in Gaia DR2 (Bailer-Jones et al., 2018). In Section 3.1, the de-reddened magnitudes /////// and absolute magnitude for each star were calculated, thus all these derived magnitudes are provided in our catalog. In Table 1 we provide the description of each column of our catalog.
As discussed in Section 3, there are non-M type stars both in the M giants and M dwarfs catalog. In order to mark those non-M type stars and further purify the M type stars sample, we have added a column called ’sflag’ in the M-type catalog, including ’m’ as confirmed M type stars, ’n’ as non-M type stars, ’c’ as carbon stars, ’w’ as white dwarf binaries, and ’u’ as unconfirmed M type stars because of the lack of Gaia data. Table 2 shows the number of sources in each labeled subsample.
6 summary
We have used the template-fitting pipeline of our previous works to identify and classify M dwarfs and M giants in LAMOST DR5. A total of 39,796 M giants and 501,152 M dwarfs are provided. In addition to the large number of newly classified M-type stars, we demonstrate that M giants and M dwarfs can be well separated in the spectral indices diagram as well as in the infrared color-color diagram. However, using the Gaia DR2 data, the MG vs. (Gbp-Grp)0 diagram clearly shows that not only M type stars, but also early-type stars, and white dwarf-M dwarfs binaries were included in the M type sample. The contamination rates in the M giants and M dwarfs samples are about 4.6% and 0.48% respectively. In the published M-type catalog, ’sflag’ is used to mark the confirmed M type stars as well as other contamination sources. In particular, we found that the CaH spectral indices are efficient selection criteria for carbon stars. Finally, about 289 carbon stars were selected from the M giants sample, and further confirmed through visual inspection of LAMOST spectra.
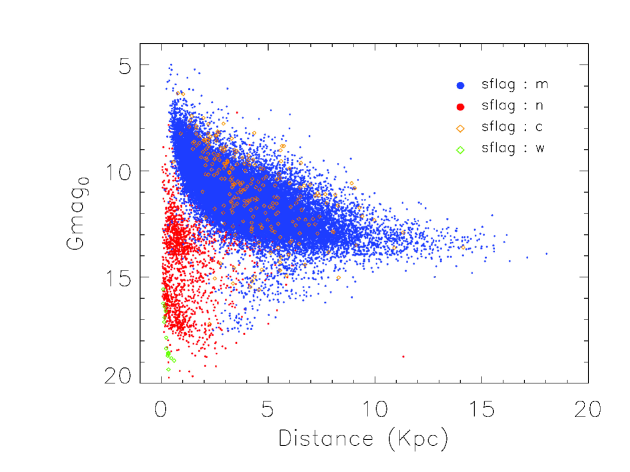
To verify the reliability of our classification results in the M giants catalog, we plot the dereddened Gmag vs. distance diagram in Figure 10. Colors represent different subsamples labeled in Table 2. The distance distribution of M giants extends from 1 to 15 kpc, with a peak at 2.5 kpc. As expected, faint stars with small distances were labeled as non-M giants in our catalog, including early-type stars, M dwarfs, and white dwarf binaries. A few M giants are located in the outlier region with Gmag0 greater than 14 and distance from 3 to 8 kpc. This is because the faint magnitude makes the parallax uncertainty of these M giants relatively large, which further leads to unreliable distance estimation. In addition, spectral visual inspection confirms that these outliers are M giants.
References
- Bailer-Jones et al. (2018) Bailer-Jones, C. A. L., Rybizki, J., Fouesneau, M., Mantelet, G., & Andrae, R. 2018, AJ, 156, 58
- Bochanski et al. (2014) Bochanski, J. J., Willman, B., West, A. A., Strader, J., & Chomiuk, L. 2014, AJ, 147, 76
- Casagrande & VandenBerg (2018) Casagrande, L., & VandenBerg, D. A. 2018, MNRAS, 479, L102
- Chen et al. (2001) Chen, B., Stoughton, C., Smith, J. A., et al. 2001, ApJ, 553, 184.
- Chou et al. (2007) Chou, M.-Y., Majewski, S. R., Cunha, K., et al. 2007, ApJ, 670, 346
- Cui et al. (2012) Cui, X.-Q., Zhao, Y.-H., Chu, Y.-Q., et al., RAA, 12, 1197
- Gaia Collaboration et al. (2018) Gaia Collaboration, Brown, A. G. A., Vallenari, A., et al. 2018, A&A, 616, A1.
- Gaia Collaboration et al. (2018) Gaia Collaboration, Babusiaux, C., van Leeuwen, F., et al. 2018, A&A, 616, A10
- Green et al. (2018) Green, G. M., Schlafly, E. F., Finkbeiner, D., et al. 2018, MNRAS, 478, 651
- Holtzman et al. (2015) Holtzman, J. A., Shetrone, M., Johnson, J. A., et al. 2015, AJ, 150, 148
- Ji et al. (2016) Ji, W., Cui, W., Liu, C., et al. 2016, ApJS, 226, 1
- Keenan (1993) Keenan, P. C. 1993, PASP, 105, 905
- Koposov et al. (2014) Koposov, S. E., Belokurov,V., Zucker, D. B., et al. 2014, MNRAS, 446, 3110
- Lépine et al. (2007) Lépine, S., Rich, R. M., & Shara, M. M. 2007, ApJ, 669, 1235
- Li et al. (2016a) Li, J., Smith, M. C., Zhong, J., et al. 2016, ApJ, 823, 59
- Li et al. (2016b) Li, J., Liu, C., Carlin, J. L., et al. 2016, Research in Astronomy and Astrophysics, 16, 125
- Li et al. (2018) Li, Y.-B., Luo, A.-L., Du, C.-D., et al. 2018, ApJS, 234, 31
- Li et al. (2019) Li, J., Liu, C., Xue, X., et al. 2019, arXiv:1902.07861
- Luo et al. (2012) Luo, A.-L., Zhang, H.-T., Zhao, Y.-H., et al. 2012, Research in Astronomy and Astrophysics, 12, 1243
- Majewski et al. (2003) Majewski, S. R.,Skrutskie, M. F., Weinberg, M. D.,& Ostheimer, J. C. 2003, ApJ, 599, 1082
- Minniti et al. (2011) Minniti, D., Saito, R. K., Alonso-García, J., et al. 2011, ApJ, 733, L43.
- Reid et al. (1995) Reid, I. N., Hawley, S. L., & Gizis, J. E. 1995, AJ, 110, 1838
- Reid et al. (2014) Reid, M. J., Menten, K. M., Brunthaler, A., et al. 2014, ApJ, 783, 130.
- Robin et al. (1992) Robin, A. C., Creze, M., & Mohan, V. 1992, ApJ, 400, L25.
- Schönrich, & Binney (2009) Schönrich, R., & Binney, J. 2009, MNRAS, 399, 1145.
- Schönrich et al. (2010) Schönrich, R., Binney, J., & Dehnen, W. 2010, MNRAS, 403, 1829.
- Si et al. (2015) Si, J.-M., Li, Y.-B., Luo, A.-L., et al. 2015, Research in Astronomy and Astrophysics, 15, 1671
- Skrutskie et al. (2006) Skrutskie, M. F., Cutri, R. M., Stiening, R., et al. 2006, AJ, 131, 1163
- Venn et al. (2004) Venn, K. A., Irwin, M., Shetrone, M. D., et al. 2004, AJ, 128, 1177.
- Wright et al. (2010) Wright, E. L., Eisenhardt, P. R. M., Mainzer, A. K., et al. 2010, AJ, 140, 1868
- Yuan et al. (2013) Yuan, H. B., Liu, X. W., & Xiang, M. S. 2013, MNRAS, 430, 2188
- Zhao et al. (2012) Zhao, G., Zhao, Y.-H., Chu, Y.-Q., et al. 2012, RAA, 12, 723
- Zhong et al. (2015a) Zhong, J., Lépine, S., Hou, J., et al. 2015, AJ, 150, 42
- Zhong et al. (2015b) Zhong, J., Lépine, S., Li, J., et al. 2015, Research in Astronomy and Astrophysics, 15, 1154