Photometric and Kinematic Misalignments and Their Evolution Among Fast and Slow Rotators in the Illustris Simulation
Abstract
We use the Illustris simulation to study the distributions of ellipticities and kinematic misalignments of galactic projections, as well as the intrinsic shapes and rotation of the simulated galaxies. Our results for the projections of galaxies display clear trends of an overall increase of kinematic misalignment and a slight decrease of ellipticity for fast rotators with increasing masses, while revealing no clear distinction between slow rotators of different mass. It is also found that the number of very slow rotators with large ellipticities is much larger than found in observations. The intrinsic properties of the galaxies are then analysed. The results for the intrinsic shapes of the galaxies are mostly consistent with previous results inferred from observational data. The distributions of intrinsic misalignment of the galaxies suggest that some of the galaxies produced by Illustris have significant rotation around their medium axes. Further analysis reveals that most of these galaxies display signs of non-equilibrium. We then study the evolution of the intrinsic misalignments and shapes of three specific Illustris galaxies, which we consider as typical ones, along the main progenitor line of their merger trees, revealing how mergers influence the intrinsic shapes and kinematics: the spin axis in general stays close to the shortest axis, and tends to quickly relax to such an equilibrium state within a few dynamical times of the galaxy after major perturbations; triaxiality and intrinsic flatness in general decrease with time, however, sometimes increases occur that are clearly seen to correlate with major merger events.
keywords:
galaxies: stellar content–galaxies: photometry–galaxies: fundamental parameters–galaxies: kinematics and dynamics–galaxies: structure–galaxies: evolution1 introduction
In recent years, numerous kinematical measurements of external galaxies have been conducted, thanks to the fast development of Integral Field Spectroscopy (IFS), which enables us to make velocity maps and other galactic kinematic measurements. Examples are the SAURON project (Bacon et al., 2001), the CALIFA survey (Sanchez et al., 2012), the ATLAS3D project (Cappellari et al., 2011), the SAMI Galaxy Survey (Bryant et al., 2015), the MASSIVE survry (Ma et al., 2014) and the SDSS-IV MaNGA Survey (Bundy et al., 2015). Emsellem et al. (2007) suggested using the rotational parameter as a measurement of how fast a galaxy rotates, which is now widely used in analysis of IFS measurement of galaxies. Emsellem et al. (2007), Cappellari et al. (2007), Emsellem et al. (2011) and Weijmans et al. (2014) studied the distributions of ellipticities and kinematic misalignments for the two types of rotators from SAURON and ATLAS3D respectively. Both results show that overall fast rotators tend to have a larger span of ellipticities and kinematic misalignment mostly close to 0, suggesting that they tend to be nearly oblate, while slow rotators are generally rounder with larger kinematic misalignments, displaying signs of triaxiality, implying that the two types of galaxies may have different formation paths. For a detailed review of the IFS studies of early type galaxies, see Cappellari (2016).
However, the intrinsic shapes and kinematics of galaxies, which give important information about their formation histories and evolution, can only be inferred from observational data of their line-of-sight projections with degeneracy. In some cases, dynamical modelling can be used to reduce the degeneracy (Van Den Bosch & Van De Ven, 2009). Various works have used obervational data to infer the distribution of 3-dimensional shapes and kinematics of galaxies, where simplifying assumptions are sometimes made to reduce the degeneracy. For example, Weijmans et al. (2014) inferred the distribution of the 3-dimensional shapes of the ATLAS3D galaxies under the assumption that both fast and slow rotators are oblate, and that the intrinsic misalignment is uniquely determined by the triaxiality . They then tested their assumption of oblateness by generalizing their method of inference, and found that fast rotating early type galaxies have similar intrinsic shape distribution as spiral galaxies and tend to be axisymmetric, whereas there are strong indications that slow rotators are more triaxial. Foster et al. (2017) used data from the SAMI project to infer the intrinsic shapes and rotation of galaxies by minimizing an error function, again assuming a one-to-one relation between intrinsic misalignment and triaxiality . Unlike the ATLAS3D data, their samples contain both early-type and late-type galaxies. Their results suggest that slow rotators are more likely to be triaxial, and fast rotators are typically flatter and axisymmetric. They also stated that the intrinsic shape of slow rotators is consistent with multiple dissipationless mergers, while that of fast rotators is consistent with high gas fractions, low merger frequencies and mass ratios. In order to confirm the triaxiality of slow rotators, Li et al. (2018b) used the MaNGA data to infer the distributions of intrinsic axis ratios and misalignments of slow rotating galaxies by assuming that each of those parameters follows an independent Gaussian distribution or the linear superposition of two Gaussian distributions, taking advantage of the large sample offered by MaNGA. It can be seen later that most of their results are consistent with our analysis of the Illustris galaxies.
Another approach of studying the intrinsic shapes and kinematics of galaxies is using computer simulations, such as N-body simulations specifically focused on the merger process of a relatively small number of galaxies (e.g. Naab & Burkert 2003; Naab et al. 2006; Jesseit et al. 2009; Moody et al. 2014), or large scale cosmological simulations, such as the Illustris project (Vogelsberger et al., 2014b), the EAGLE project (Schaye et al., 2014), the Magneticum project (Schulze et al., 2018), the Horizon-AGN project (Dubois et al., 2014) and the Hydrangea project (Bahe et al., 2017). Projections of galaxies generated by simulations can be compared with observational results (e.g. Choi et al. 2018; van de Sande et al. 2019). The comparison can be used test the reliability of simulations, and study how their intrinsic properties (shape and kinematics) are determined by their formation and evolution history, such as mergers. The shape and rotation of remnants of major binary mergers have been found in N-body simulations to depend on both the mass ratio and the gas content (Naab & Burkert, 2003; Naab et al., 2006; Jesseit et al., 2009). Moody et al. (2014) performed N-body hydrodynamical simulations of multiple merger pathways, and discovered that binary mergers usually produce fast rotating galaxies, with the exception of those with zero initial angular momentum and those with a low gas fraction, both of which produce highly elongated slow rotators incompatible with slow rotators observed in ATLAS3D. Conversely, they found that remnants of multiple mergers resemble observed slow rotators. In order to study the origin of massive prolate galaxies in slow rotating galaxies, Li et al. (2018a) looked into their evolution in the Illustris simulation, and showed that they are formed by major dry mergers from nearly radial collisions, consistent with results of Moody et al. (2014). Schulze et al. (2018) investigated early type galaxies at different redshifts in the Magneticum simulation, also to study the formation of slow rotating galaxies. They identified fast and slow rotators at , discovered the emergence and increase of slow rotators after redshift ; they further found that a large proportion of slow rotators are formed in short and distinguishable transitions from fast to slow rotators, which are associated with major mergers. Lagos et al. (2018) used the EAGLE and Hydrangea simulation data to study the formation of slow rotators, and also discovered that dry mergers and/or haloes with small spins dominate the formation paths of slow rotators.
In the present paper, we first focus on the mass dependence of the kinematic features (their distributions) of galactic projections from the Illustris simulation, and then study 3-dimensional features (shape, rotation) of Illustris galaxies and attempt to connect them by looking at the statistical relation between the properties of galactic projections to those of their corresponding galaxies in 3 dimensions, and we also study the evolution of these features using the merger tree provided by Illustris.
This paper is organized as follows. In Section 2 we give a brief introduction of the Illustris simulation that we use for our analysis, and also describe how the galaxies that we use are selected. Section 3 is a brief description of the properties of Illustris galaxies that we analyse in this paper. In Section 3.1, we describe the properties of the galactic projections that we adopt in our analyses, and also discuss an issue with the classification of fast and slow rotators. In Section 3.3 a brief description of the intrinsic properties of the galaxies that we use in our analysis is given. The results are then shown in Section 4. The distributions of the properties of the projections are presented and compared to observation results from the ATLAS3D project in Section 4.1. In Section 4.2 the distributions of the 3-dimensional intrinsic properties of the galaxies is given together with the relations of some of the 3-dimensional properties of galaxies to those of their corresponding projections. After this, in Section 4.3 the evolutions of the 3-dimensional properties of three Illustris galaxies, which we consider typical ones representative of their kinds, are briefly studied. In Section 5, we summarize our results and present the conclusions. In Appendix A, we present an analysis of the influence of pixel binning on the calculated parameters and thus the classification of rotators. In Appendix B, we look into the intrinsic nature of galaxies that show significant rotation around their medium axes.
2 the Illustris simulation
The Illustris project (Vogelsberger et al., 2014a, b; Genel et al., 2014; Nelson et al., 2015) is a series of large scale cosmological hydrodynamic simulations using the moving mesh code AREPO (Springel, 2010) to follow the coupled kinematics of DM (dark matter) and gas. The project consists of 6 separate simulations, with different resolutions and with/without baryons (some only consist of dark matter) and each contains detailed snapshots from redshift to (the present day). For our analysis the Illustris-1 simulation, which has the largest number of resolution elements and includes both DM and baryons, is used. This simulation has an average gas cell mass of and dark matter particle mass of . The comoving side length of the periodic box is 106.5 Mpc. The initial conditions are generated such that at (present) the energy densities of matter, vacuum and baryons are , and the Hubble constant equals , where (Vogelsberger et al., 2014b).
In our analysis, we use Illustris-1 galaxies at redshift zero (snapshot 135). As the calculation of the rotation parameter requires pixel binning, and in order to obtain reliable results, a sufficient number of star particles is needed to produce a reliable number of bins. Therefore, we select galaxies with stellar mass and divide them into two groups, one with and the other with . The numbers of galaxies in the two mass groups are 663 and 192, respectively.
3 methodology
In this paper, we first analyse the projections of Illustris galaxies and compare them to observational results, and then look into the intrinsic natures of the galaxies. In this section we introduce the projected properties and intrinsic properties of the galaxies that we will later investigate, and also explain how they are calculated in our study.
In our analysis of the galactic projections, galaxies are projected in 3 directions, the , and axes used in Illustris, and different projections of each galaxy are treated as independent projections. The properties of the projections that we analyse here are described below.
3.1 Ellipticity and Kinematic Misalignment
Assuming that the projection of a galaxy can be approximated by an ellipse, the photometric position angle (photometric PA, ) is defined as the position angle of the photometric major axis with respect to a specific axis , measured counterclockwise (the choice of the axis is, in fact, arbitrary, because what we are concerned with here is the kinematic misalignment which involves the difference of two angles). The ellipticity is defined by
| (1) |
where and are the major and minor axis of the projection of the galaxy, respectively. Both the photometric position angle and the ellipticity are determined by an iterative method, which is a two dimensional version of the approach outlined in Section 3 of Allgood et al. (2006), using an unweighted 2-dimensional inertia tensor and keeping the semi-major axis of the ellipse fixed at twice the 3-dimensional half stellar mass radius of the galaxy . The initial center of the ellipse is set as the position of the minimum gravitational potential of the galaxy. In each iteration, the center is reset as the center of stellar mass of the ellipse obtained in the previous iteration. For galaxies that are not too irregularly shaped (i.e. having a symmetric stellar distribution near the core), of course, the final center should still be very close to the position of the gravitational potential minimum. The errors for both the photometric PA and the ellipticity are determined by calculating them within ellipses with major axes 0.5, 1, 2 and 3 times the half mass radius, respectively, and taking the standard error, similar to the method adopted by Weijmans et al. (2014).
The kinematic position angle (kinematic PA, ) is defined as the position angle of the axis passing through the stellar center of mass along which the line-of-sight rotating velocity reaches a maximum (the kinematic axis), and is measured counterclockwise with respect to the axis chosen above. If figure rotation can be neglected, this axis is also perpendicular to the projection of the angular momentum vector of the galaxy. In our analysis, is calculated by the method described in Appendix B of Krajnovic et al. (2006), using the FIT_KINEMATIC_PA package developed by Michele Cappellari which requires pixel binning described in the next section. This method is capable of obtaining the error of the kinematic PA, also described in Appendix B of Krajnovic et al. (2006).
The kinematic misalignment is the angle between the kinematic axis and the photometric major axis, defined to be in the range of 0 and . This is equal to
| (2) |
The error of is also determined using Eq. (2), where, assuming and are independent variables, the error of is, obviously,
| (3) |
where is determined by the FIT_KINEMATIC_PA program and is calculated as described above.
Since what we present is the distributions of and rather than the individual values for the projections, the errors that we need is those associated with the histograms. Each of these errors consists of two parts: the first from the error of the sample data and the second from possible selection bias induced by a finite sample size. The method for determining the errors for individual sample data has been described above. To determine the errors for the distribution histograms caused by that of individual sample data, we use a Monte-Carlo simulation, with the probability distributions of both the ellipticity and the misalignment assumed to be Gaussians centered at the calculated values and with dispersions equal to their obtained standard deviations. The second part of the error of the histograms, which is due to selection bias, is calculated by assuming that the number of galaxies in each interval of the histogram obeys a Poisson distribution, therefore having a standard error equal to the square root of itself (Poissonian error). The two parts of error are then put together as independent sources of error by adding them in quadrature and taking the square root.
3.2 The Parameter and Classification of Rotators
The line-of-sight velocity maps of the projections of galaxies are binned for calculation of the rotational parameter and for use of the FIT_KINEMATIC_PA package. The binned area for each galaxy projection is a square region centered at the center of the ellipse obtained in the calculation of ellipticity (see Section 3.1) with sides parallel to the principal axes measuring . Each projection is first binned into square pixels, the number of which is chosen such that on average each pixel contains 80 star articles. We then use these regular pixels to create Voronoi bins (Cappellari & Copin, 2003) such that each bin contains star particles.
After the binning, the statistical results for the mean velocity and velocity dispersion are calculated for each Voronoi bin. The parameter, here adopted as a measurement of how fast the galaxies rotate, is defined by (Emsellem et al., 2011)
| (4) |
where , and are the brightness, mean velocity and velocity dispersion of all the star particles in the -th bin, and is the total number of bins. For simplicity, the brightness is assumed to be proportional to the number of star particles. The factor, being the ordered part of the angular momentum measured against the total contribution of both the ordered and the stochastic parts, gives a reliable measurement of how fast a rotator the galaxy is. For a detailed discussion of the parameter, see Appendix A of Emsellem et al. (2007).
The criterion for fast and slow rotators used here is the same as Eq. (3) in Emsellem et al. (2011), namely
| (5) |
with for fast rotators and for slow rotators. In our calculation, there are 1989 galaxy projections with , among which 1760 are fast rotators and 229 are slow rotators. The number of galaxy projections with is 576, with 313 fast rotators and 263 slow rotators. We caution readers that due to limited resolution as described in Appendix A, galaxies with very small ellipticity can be misidentified into fast ones.
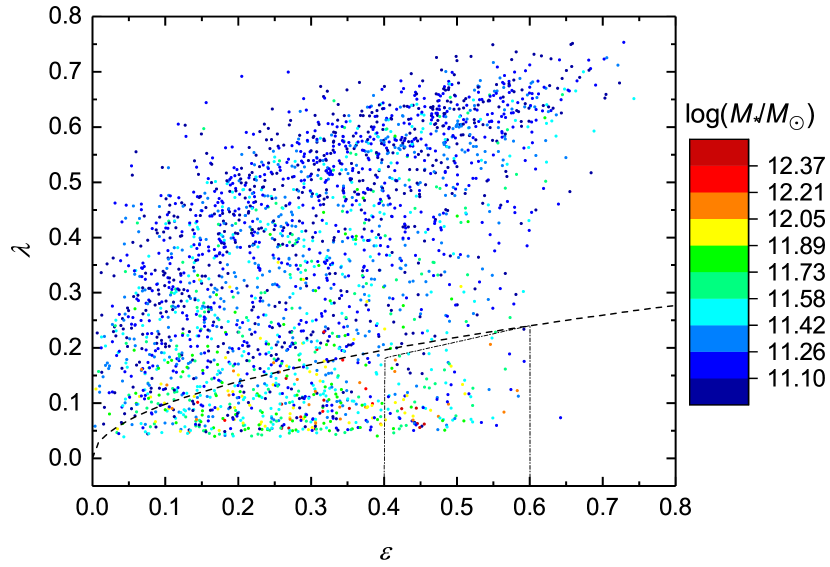
For an illustration of fast and slow rotators, the distribution for Illustris galaxy projections is plotted in Figure 1, where the criterion for fast and slow rotators, Eq. (5), is shown by a dotted curve, and the projections are color coded by the stellar mass of the corresponding galaxy. The distribution of the Illustris galaxy projections has been discussed in Li et al. (2018a), where it was noted that there exist a considerable number of extremely slow rotating samples with large ellipticities, enclosed in the trapezoidal region in Figure 1. Such galaxies are rarely seen in observations, e.g. Figure 13 of Cappellari (2016) for ATLAS3D+SAMI galaxies, Figure 1 of Falcon-Barroso et al. (2015) for CALIFA, Figure 6 of Veale et al. (2017) for MASSIVE and Figures 5 through 9 of Graham et al. (2018) for MaNGA. The same inconsistency is also present in several other studies, such as Lagos et al. (2018) for the EAGLE Ref-L050N752 simulation, the EAGLE Ref-L100N1504 simulation and the Hydrangea simulation (see their Figures 2 and 3), Figure 2 of Schulze et al. (2018) for the Magneticum simulation and Figure 3 of Choi et al. (2018) for the Horizon-AGN simulation. According to Moody et al. (2014), such elongated slowly rotating galaxies result from low gas (dry) binary mergers and binary mergers that happen to have a zero total angular momentum. It can thus be inferred that such occurrence might be connected to the rate of dry mergers being too high in simulations.
3.3 Intrinsic Shape and Rotation
We calculate the lengths and directions of the 3 principal axes of each galaxy to determine the 3-dimensional shape of the galaxy. The principal axes are again determined using the method described in Section 3 of Allgood et al. (2006), using the unweighted moment of inertia for star particles and keeping the semi-major axis of the ellipsoid twice the half mass radius, and still constantly changing the center of the ellipsoid as we did in the calculation of the ellipticity of the projections. The triaxiality of a galaxy is defined as
| (6) |
where are the major, medium and minor axes of the galaxy. Note that for oblate galaxies and for prolate ones. The intrinsic flattening of a galaxy is defined as , but when plotting its distribution histograms rather than is more often used, so as to have larger values for flatter galaxies. Together with triaxiality, uniquely determines the shape of the ellipsoid used to approximate the galaxy.
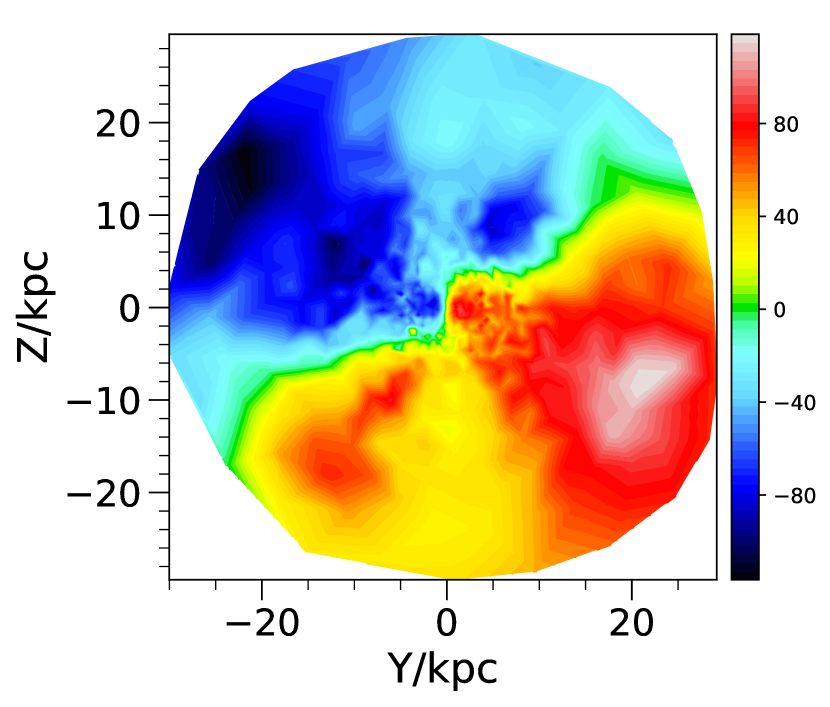
The rotation axis, defined here as the direction of the intrinsic angular momentum vector of all the stellar components within the ellipsoid described above, is then directly obtained through a calculation of the total angular momentum, where the masses of all stellar particles are again assumed equal for simplicity. The intrinsic misalignment is the direction of the angular momentum vector (or rotation axis) with respect to the three principal axes. It is specified by two parameters, and . is the angle between the angular momentum vector and the minor axis, and is the angle between the projection of the angular momentum vector onto the plane perpendicular to the minor axis and the major axis. This is illustrated in Figure 2,
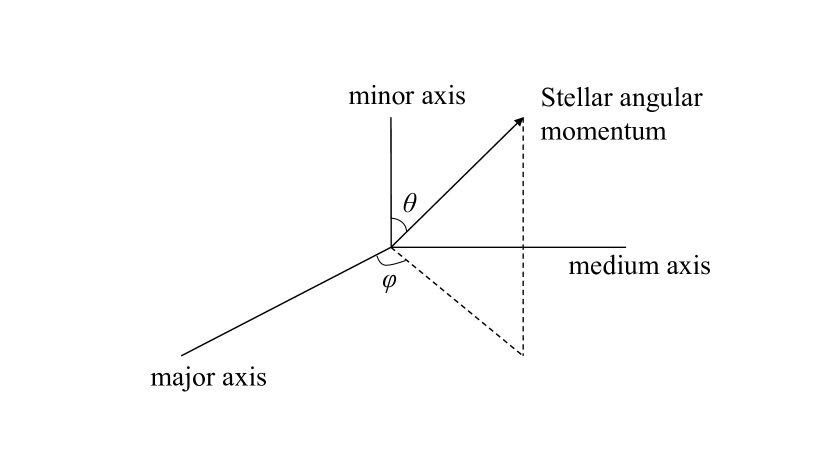
Both the nad angles are defined to be between 0 and .
4 results
In this section we present the results for both the projected and intrinsic features of Illustris galaxies that have been described in Section 3.
4.1 Projected Properties
In our analysis, there is a total number of 1989 galactic projections in the low mass group (), 229 out of which are slow rotators, and a total number of 576 galactic projections in the high mass group (), among which 263 are slow rotators. Note the increase of the proportion of slow rotators with galactic mass. We also compare the distributions for the lower mass group of Illustris galaxy projections with those of ATLAS3D [Krajnovic et al. (2011), Emsellem et al. (2011)], whose relevant data are provided on their official survey website, and the higher mass group with those of MASSIVE (Ma et al., 2014), whose data are given in Ma et al. (2018). The mass data for ATLAS3D galaxies, which are used to select galaxies with for direct comparison to our lower mass Illustris group, is not directly provided; we use the stellar mass-to-light ratio (Cappellari et al., 2013b) and the luminosity (Cappellari et al., 2013a) given for each galaxy to calculate its stellar mass. Since the MASSIVE survey focuses on galaxies with , which is close to the mass range of our higher mass group (), no mass selection is needed. In the mass range of , ATLAS3D has 31 galaxies, with 23 fast rotators and 8 slow rotators. In total, MASSIVE contains 25 fast rotators and 65 slow rotators. A possible issue is that both surveys only contain early-type galaxies, while in our analysis we do not select the early-type galaxies. However, this should make little difference to the comparison, since according to Li et al. (2018a), there are only a small number of late-type galaxies with (839 early-type galaxies vs 97 late-type galaxies).
4.1.1 Distributions of Ellipticity and Kinematic Misalignment
The distributions of ellipticity and kinematic misalignment are calculated separately for fast rotators and slow rotators of the two galaxy mass groups. The errors of the distributions are also calculated as described in Section 4.1.1.
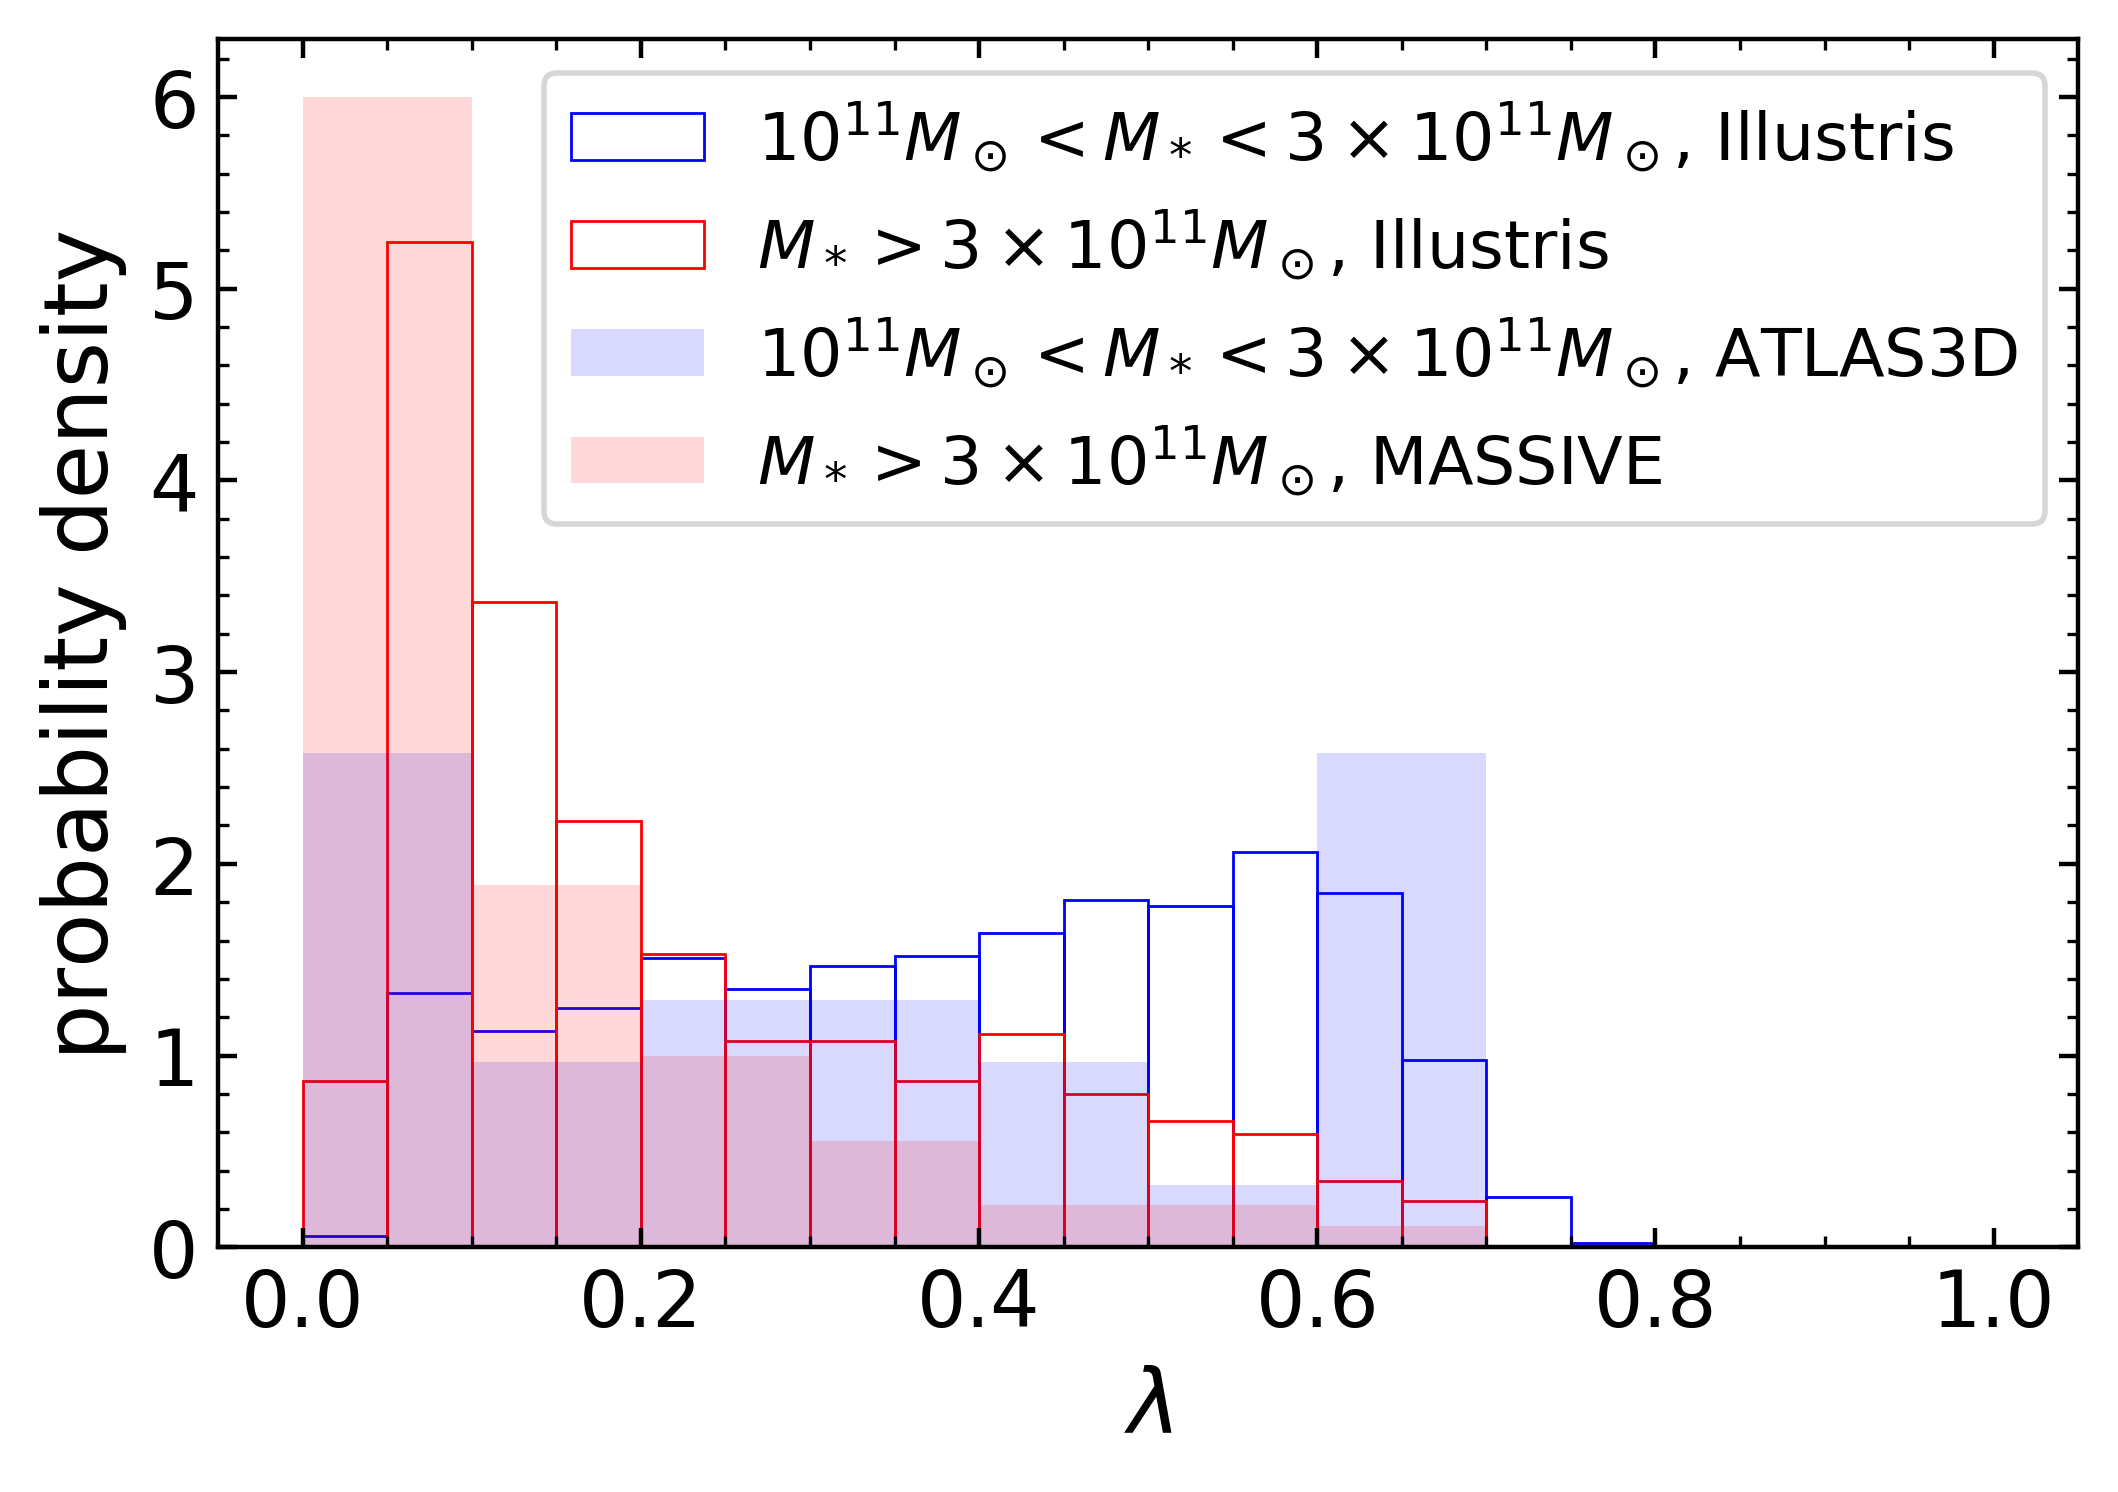
Shown in Figure 3 is the distribution of ellipticities of Illustris galaxies. As a comparison, the distributions for fast and slow rotating ATLAS3D galaxies with and MASSIVE galaxies (all of whose sample have ) are also presented. The lengths of the error bars are equal to the errors determined via the method described above.
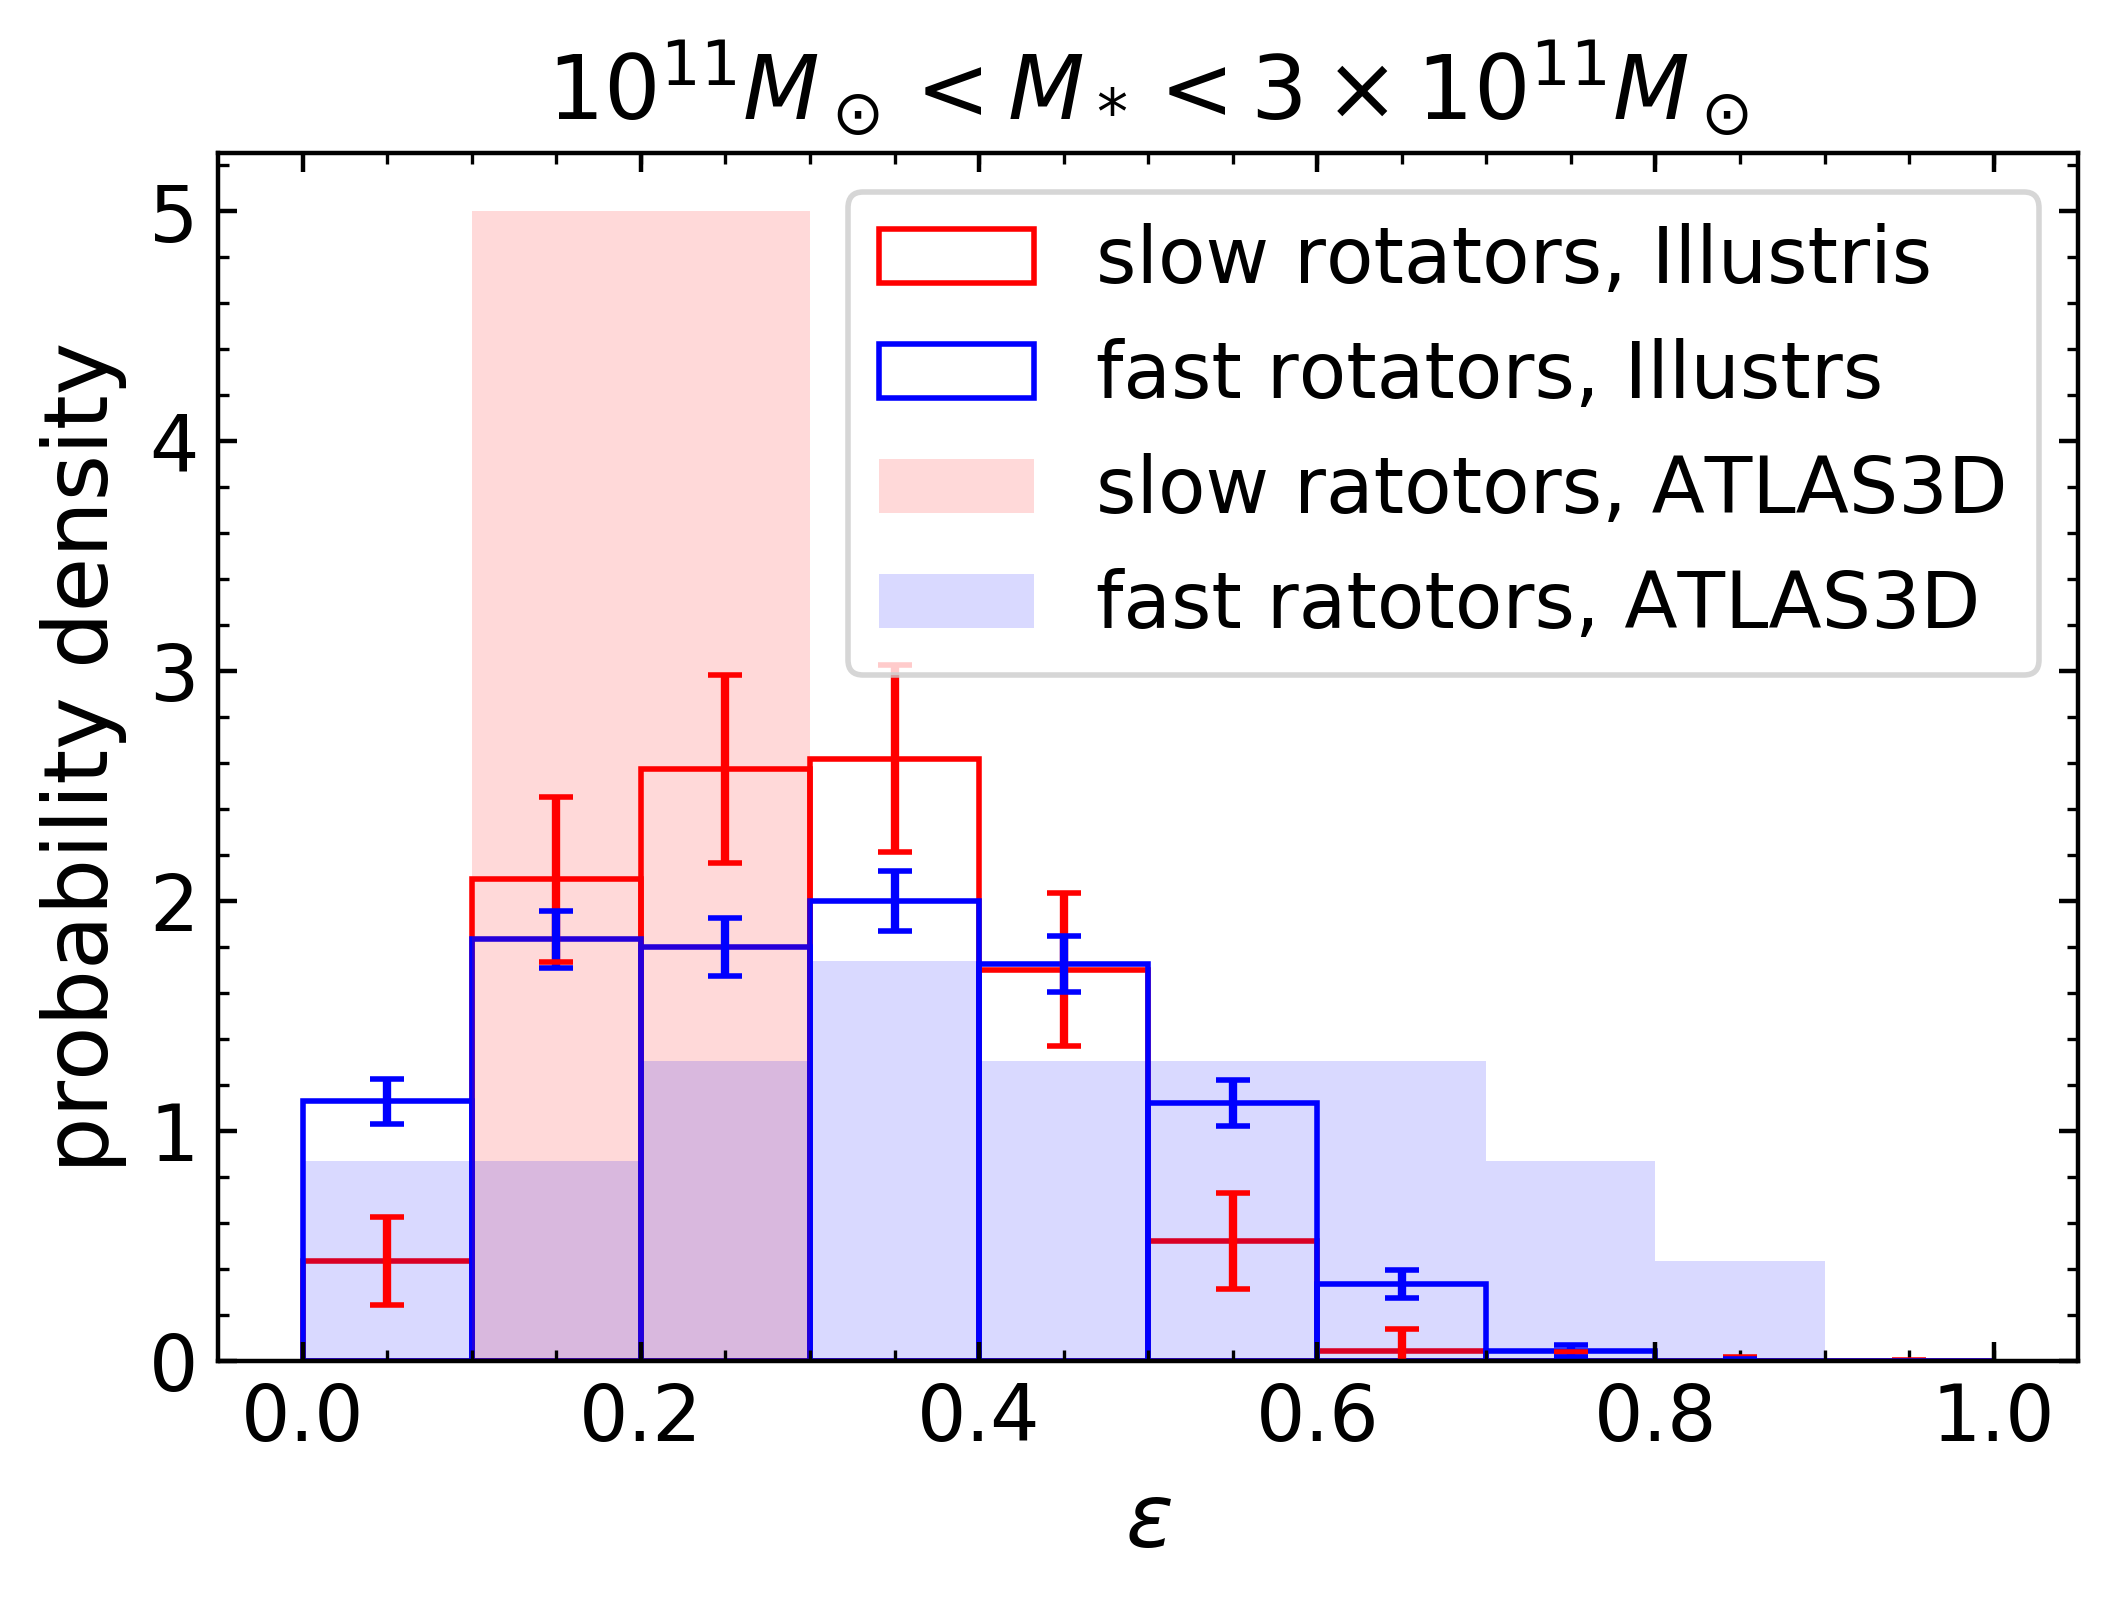
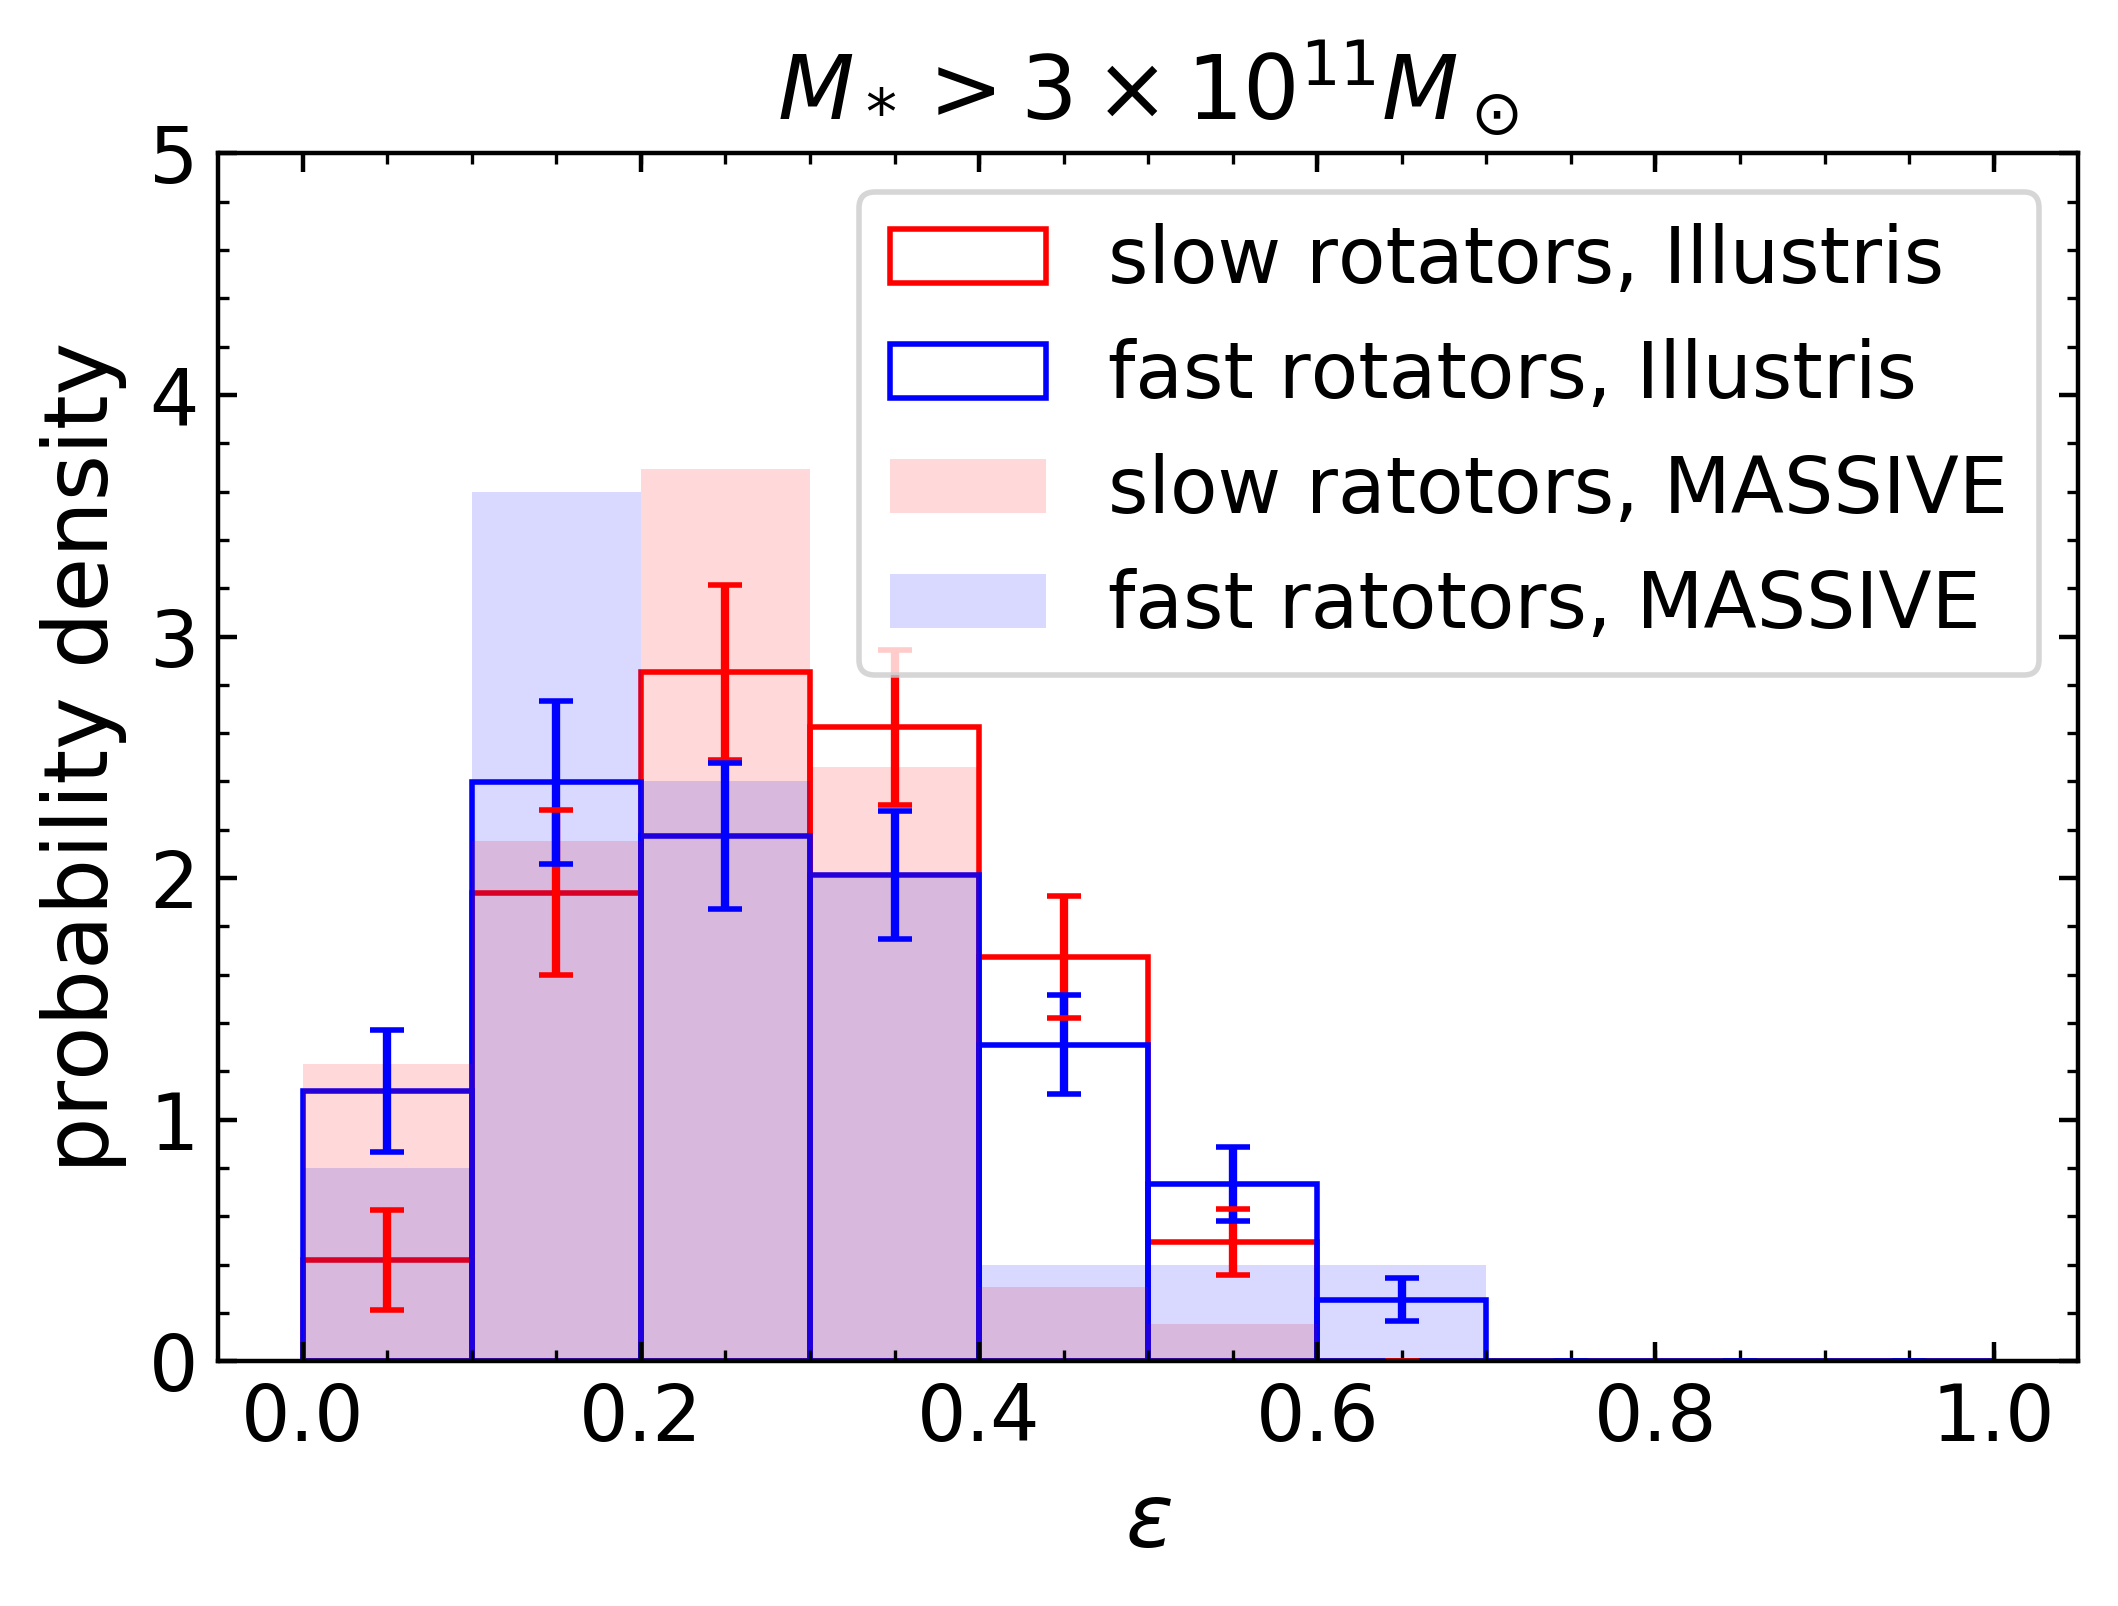
It can be seen that within Illustris galaxies, fast rotators have a wider range of ellipticities than slow rotators, consistent with the ATLAS3D and MASSIVE results.
However, there are some inconsistencies of the Illustris results with the observational ones. For fast rotators in the lower mass group, the shapes of the distributions of for Illustris and ATLAS3D galaxies are quite similar, but overall the ellipticities of Illustris fast rotators are slightly smaller than those of ATLAS3D. This can also be compared to §4.4 of van de Sande et al. (2019), where the observed ellipticities of galaxies with from SAMI are compared to those of projections of galaxies in the same mass range from EAGLE, Horizon-AGN and Magneticum. Although they did not separate the galaxies into fast and slow rotators, it is visible that both EAGLE and Horizon-AGN almost completely lack highly flattened galaxies with , which exist in Magneticum, though with the drawback of having a lower number of extremely round galaxies compared to observational data from SAMI. Lagos et al. (2018) concluded that such a shortage of highly flattened galaxies in EAGLE is caused by limitations of the modelling of ISM and cooling. van de Sande et al. (2019) inferred that Horizon-AGN also suffers from the same problem. It is visible from Figure 3 that our samples also show a shortage of highly flattened galaxies with , which might be caused by the same reason.
For slow rotators, the disagreement between galaxies from the two sources is greater, marked by the appearance of slow rotators with , which are not present in ATLAS3D and also extremely rare in MASSIVE. The top right panel of Figure 3 of Foster et al. (2017) gives the distribution of ellipticities for SAMI slow rotators, and it is visible there that slowly rotating galaxies with are also very rare. This inconsistency agrees with the plot of our samples, which we discussed in §3.2.
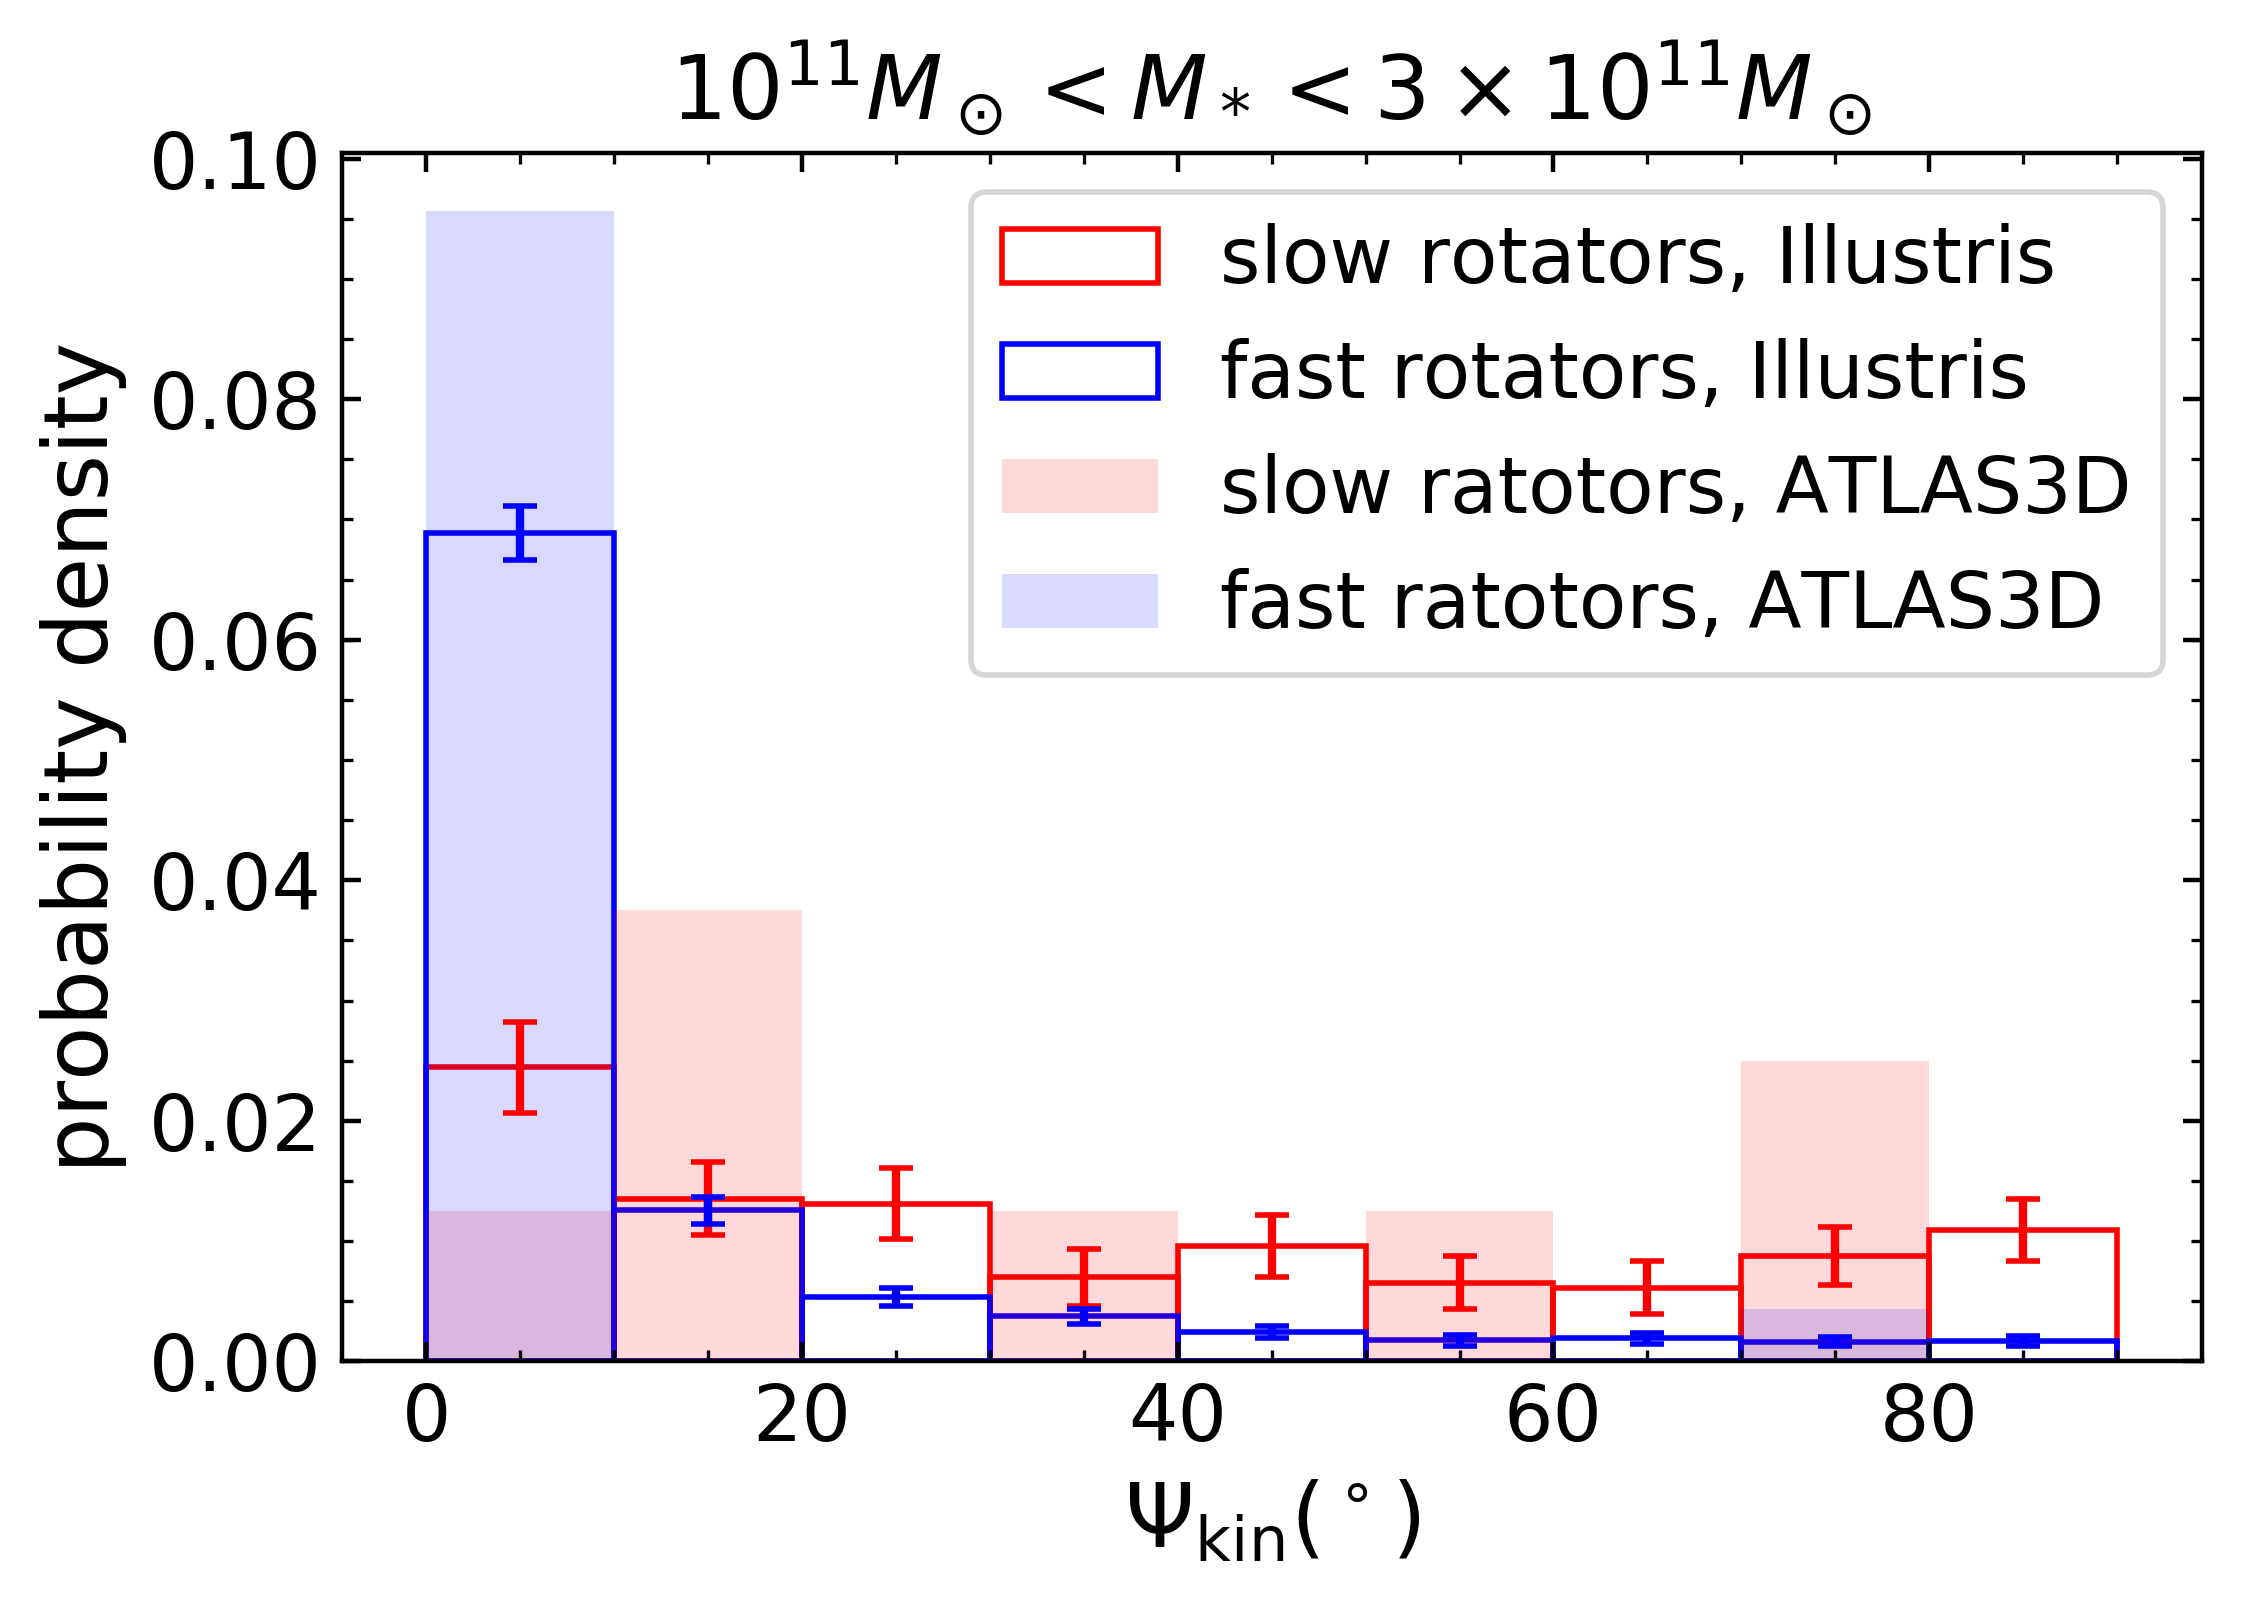
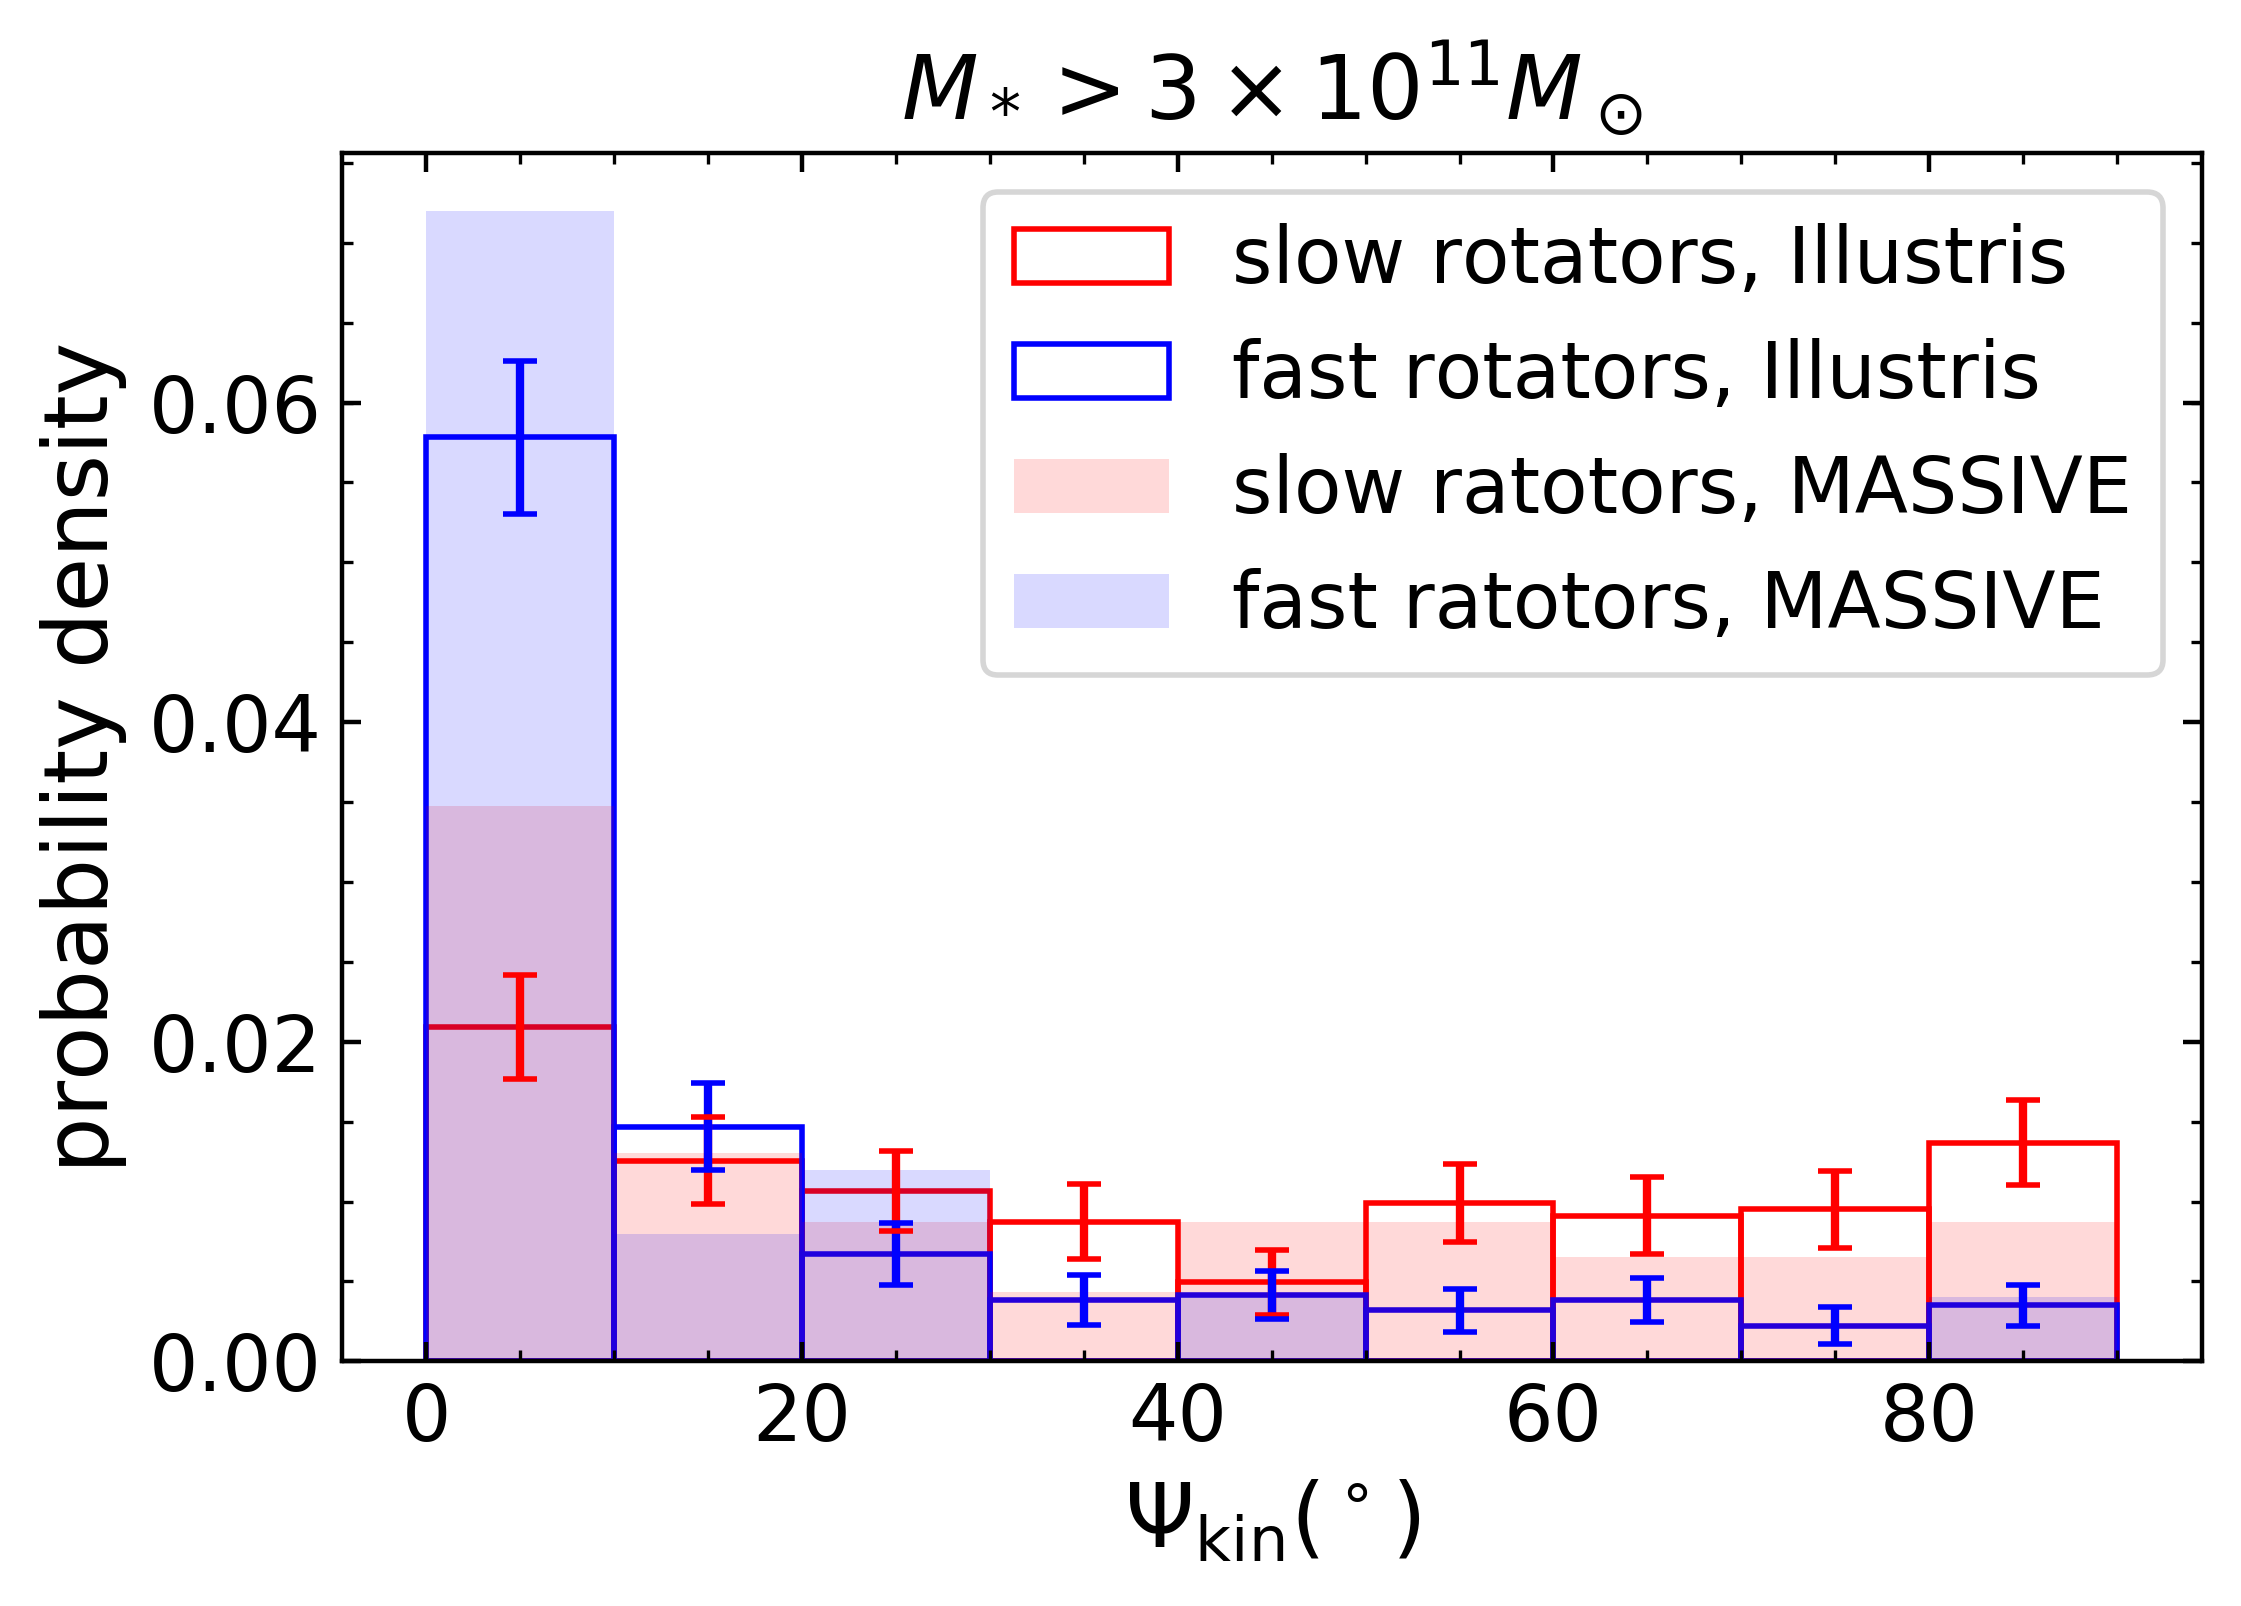
The distributions of the kinematic misalignment angles are illustrated in Figure 4. The distributions of for fast rotators show clear peaks at zero. On the contrary, for slow rotators, the distributions show double peaks at 0 and . Compared to previous studies of the projection of an intrinsically misaligned galaxy, such as those presented in section 3.3 of Franx et al. (1991), this corresponds to a tendency of minor axis rotation. A comparison of the distribution of for galaxies in the lower mass group from both Illustris and ATLAS3D shows that these two groups are mostly consistent with each other. The distributions of for galaxies in the higher mass group from both Illustris and MASSIVE also appear to be in good agreement with each other. Additionally, Figure 3 of Foster et al. (2017) also gives the distributions of the kinematic misalignments for both fast and slow rotators in the SAMI survey. It can be seen that our results for projections of Illustris galaxies also agree quite well with their results.
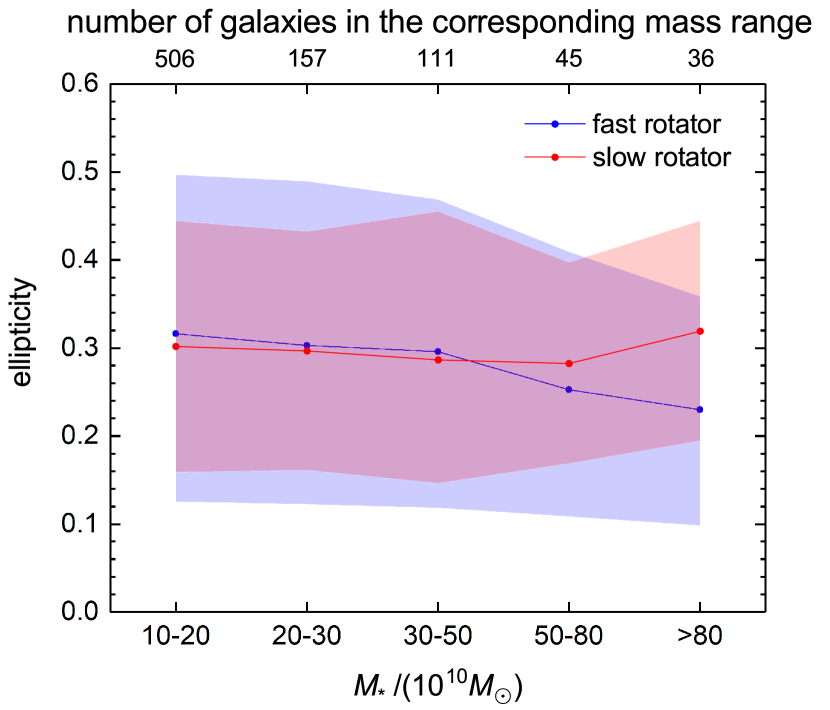
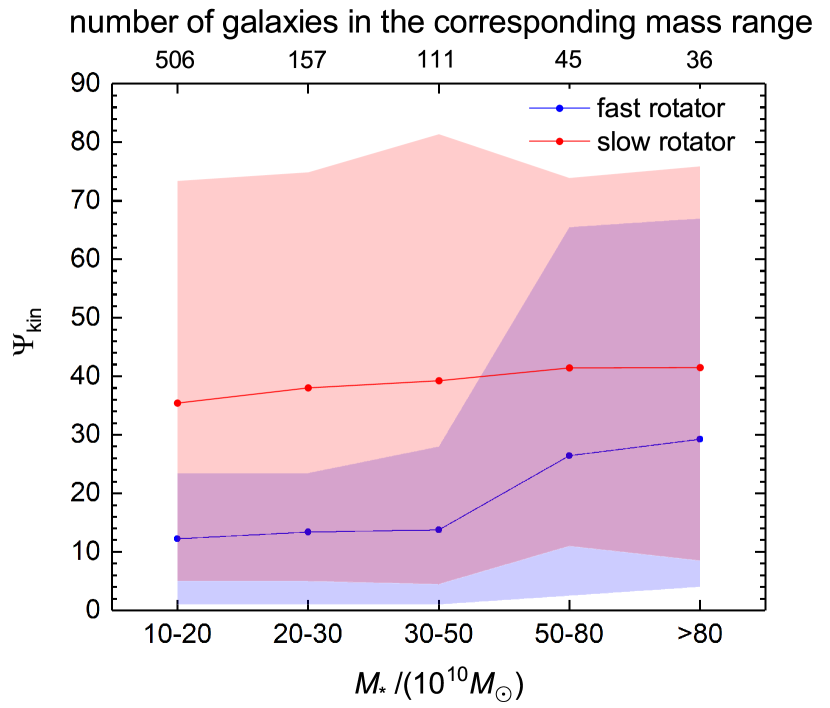
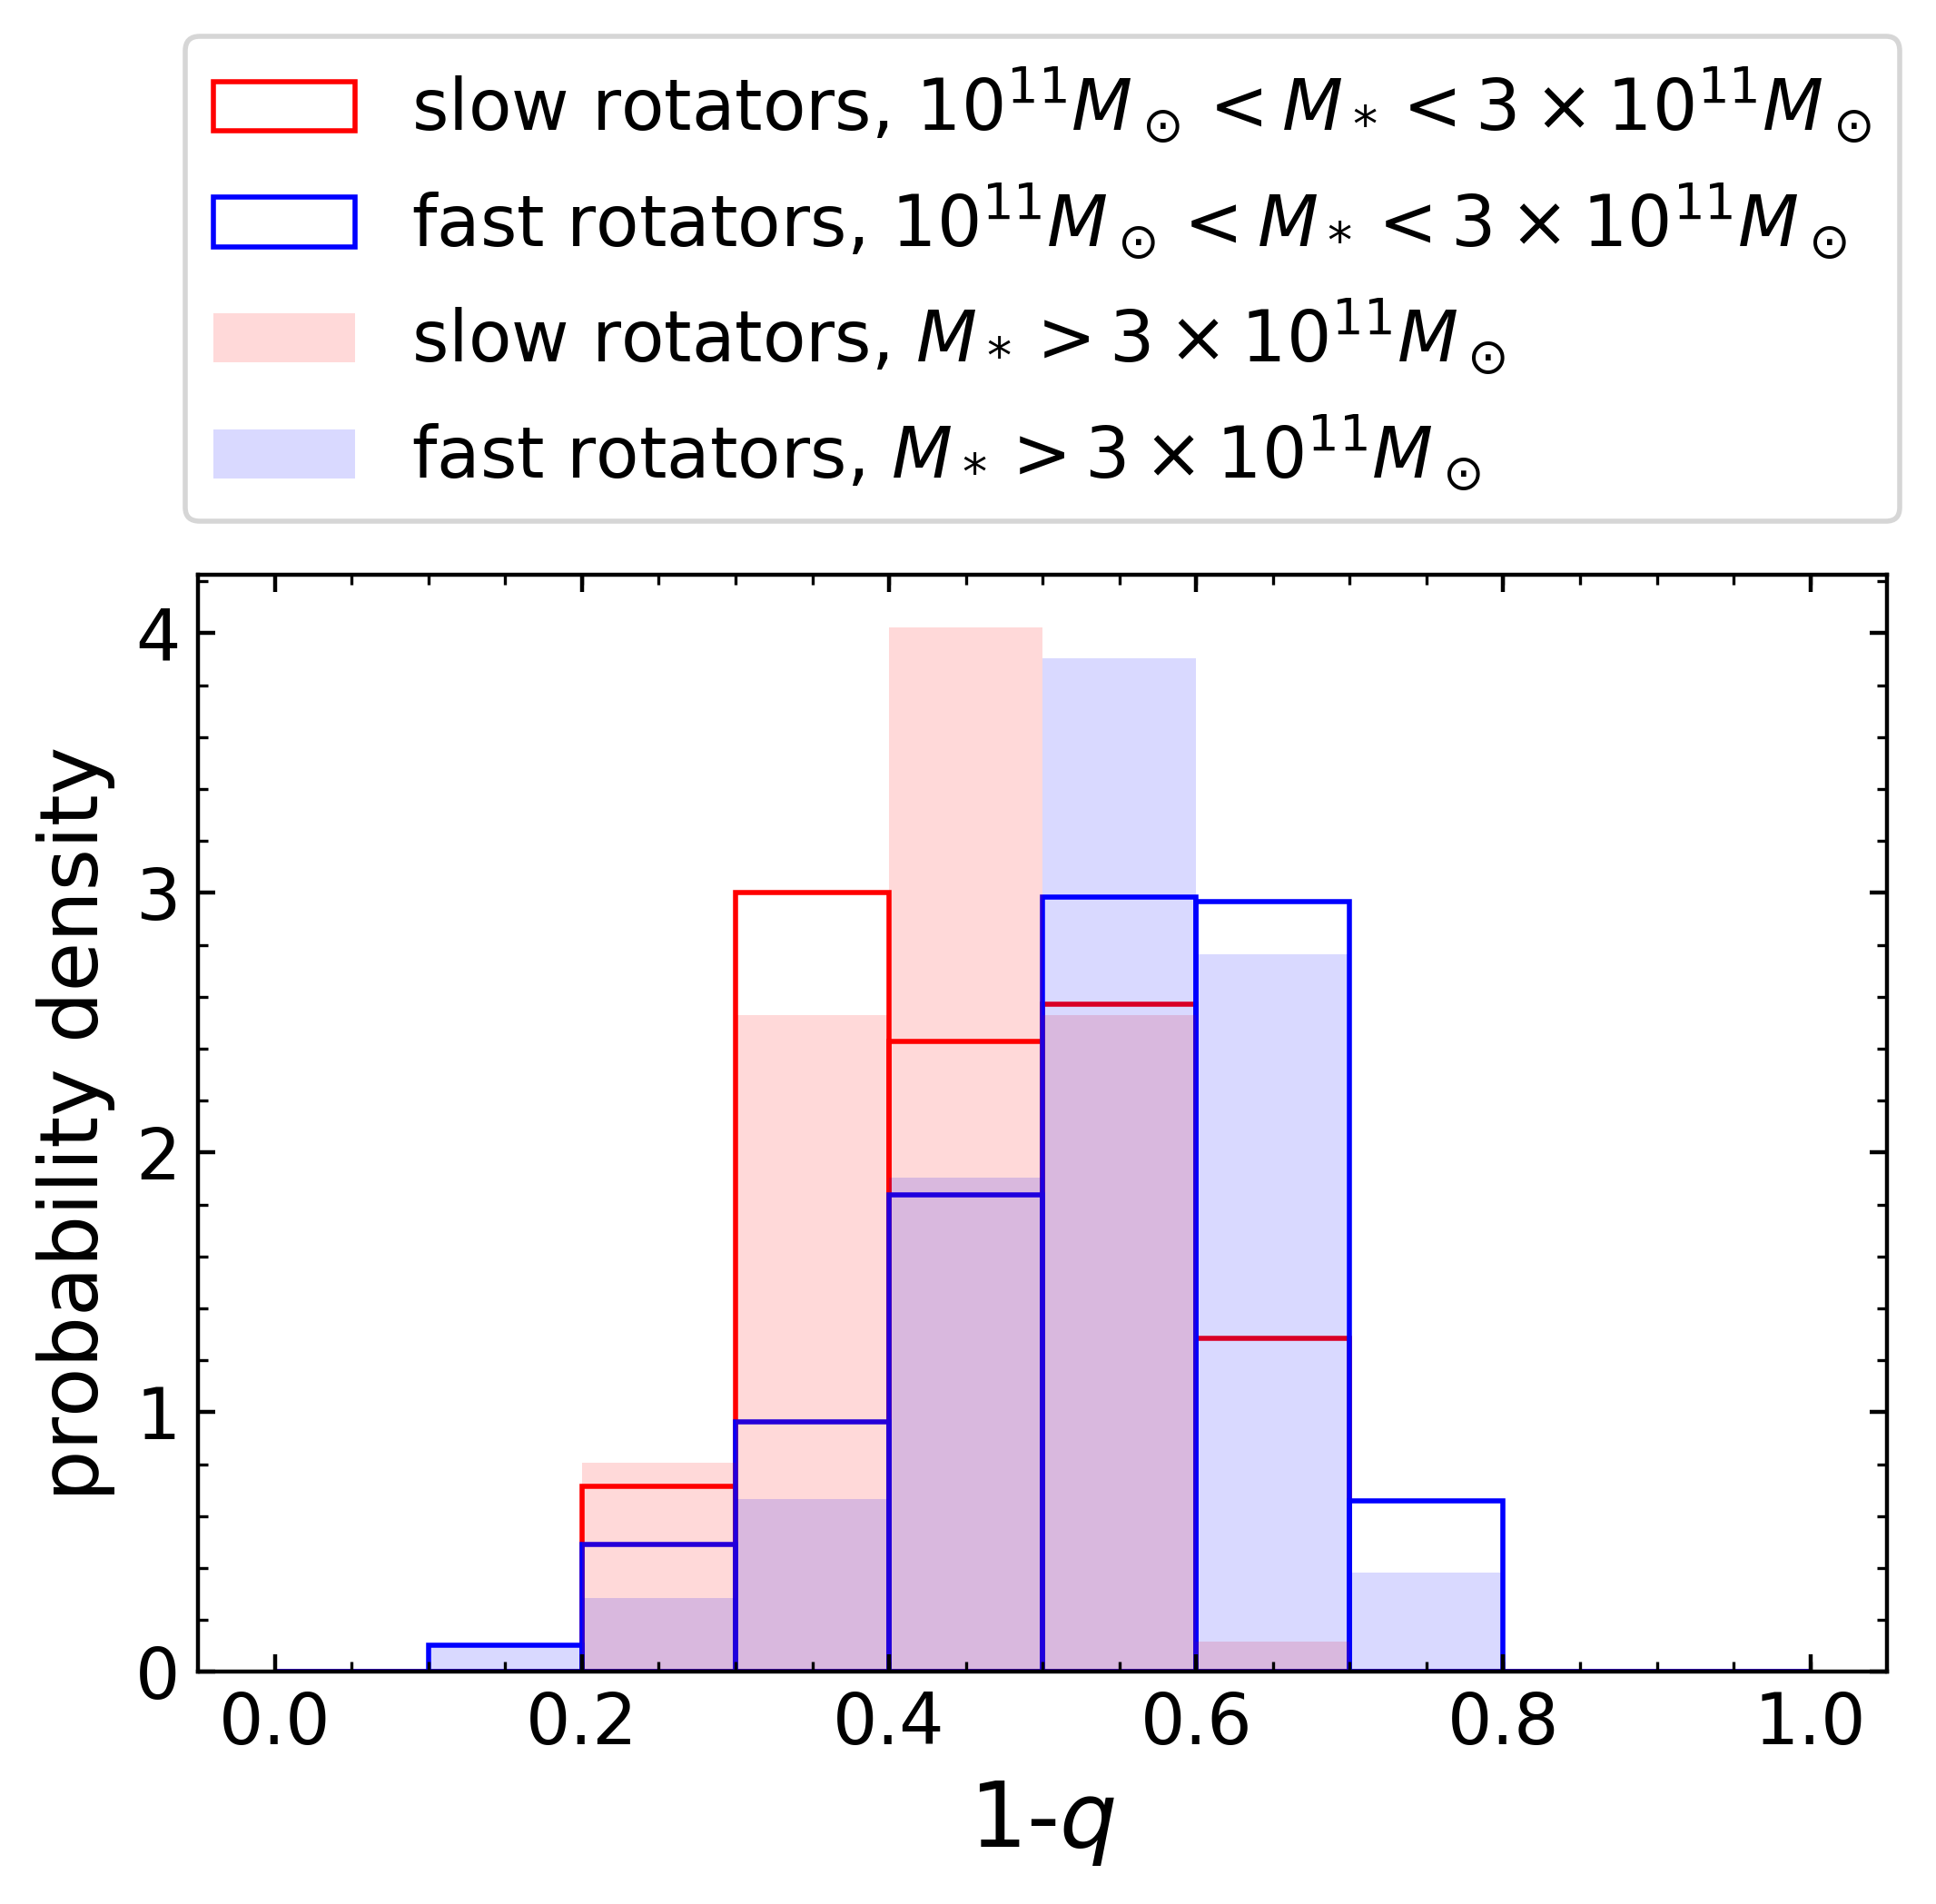
To further study the mass dependence of ellipticities and kinematic misalignments, we have calculated average values of these quantities for both kinds of rotators in different mass ranges, and the results are shown in Figures 5 and 6. It can be seen from Figure 5 that for the projections of galaxies with , the distinction between fast and slow rotators is not significant; only when surpasses do the ellipticities of slow rotators become noticeably higher than their fast rotating counterparts. For the mass dependence of kinematic misalignment shown in Figure 6, it is visible that for slow rotators in all the mass ranges are overall larger than those for fast rotators in the same mass ranges. Additionally, note the significant increase of both the average and 84% limit of for fast rotators as goes larger than , most probably in correspondence to the increase of the number of major mergers in the past, which can lead to kinematic distinct cores that might cause large kinematic misalignments.
4.1.2 Distribution of the Parameter
In the rest of this paper, unless otherwise stated, we will use to denote the parameter calculated within a radius from the galaxy center, . The distributions of the parameter for galaxies with masses and are plotted in Figure 7. The distribution of the parameter for ATLA3D galaxies (Emsellem et al., 2011) with and MASSIVE galaxies, with , are also plotted there. Note the unusual shortage of the slowest rotators () in Illustris projections, which is caused by the bias discussed in Appendix A that due to an insufficient number of star particles per pixel, systematic errors arise for the calculated values of for very slow rotators, thereby causing an apparent lack of the slowest rotators. It can also be seen from the histograms that Illustris galaxies with tend to have larger parameters than those with . Therefore, fast rotators tend to have smaller masses than slow rotators. This fact is further supported by the number of the two types of rotators from Illustris in each mass group: 229 slow rotators versus 1760 fast rotators for and 263 slow rotators versus 313 fast rotators for , the trend of which is also mentioned in Li et al. (2018a). Furthermore, this is consistent with observational findings [e.g. sec. 4.3 in Emsellem et al. (2007)]. However, a comparison of the distribution of for Illustris galaxies with observational results shows that there is some inconsistency between our lower mass group and that of ATLAS3D, as is clearly visible in Figure 7. While the ATLA3D data show distinctively slow and fast rotators, which correspond to the peak near 0 and the pattern at larger values, the distribution of for Illustris galaxies in the lower mass group does not show such pattern. This suggests that the two distinctive groups of fast (regular) and slow (irregular) galaxies presented in Figure 13b of Cappellari (2016) are not clearly separable in Illustris, which has a rather smooth distribution of for the lower mass group. In contrast, the consistency between the distributions of of our higher mass group in Illustris and the MASSIVE data is quite good, which is most likely due to the much larger proportion of slow rotators and shortage of very fast rotators in both groups that flatten the peaks representing different rotators.
4.2 Intrinsic Properties
When analysing the intrinsic properties, we still divide the galaxies according to their stellar masses into two groups: , which contains 663 galaxies, and , which contains 192 galaxies.
4.2.1 Distribution of Intrinsic Misalignment
The overall distributions of and for intrinsic misalignments of galaxies from each mass group is first calculated, and the results are shown in the left and middle panels of Figure 8. The distributions for both mass groups are strongly peaked at , with the group falling slighly faster than the group. This is consistent with our earlier result for the kinematic misalignment angles of the projections. On the contrary, the histograms of for galaxies from both groups seem quite smooth, only slightly varying at different values, corresponding to a mostly random distribution.
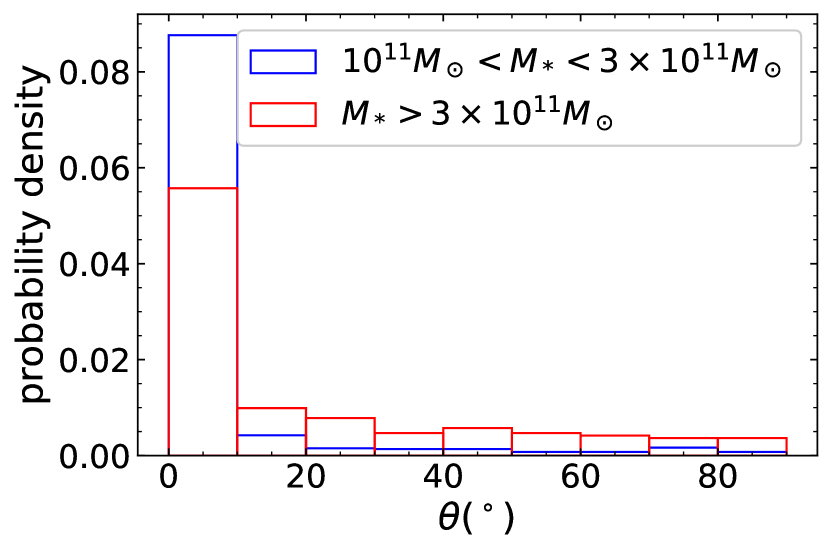
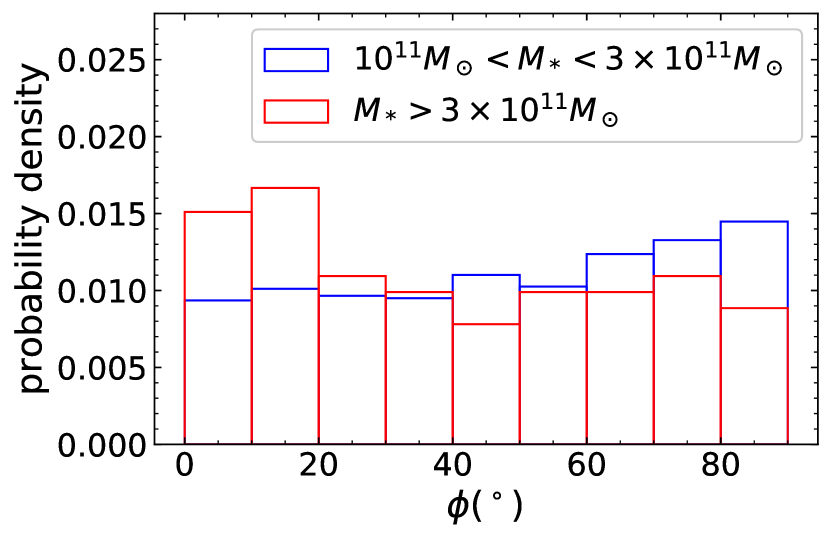
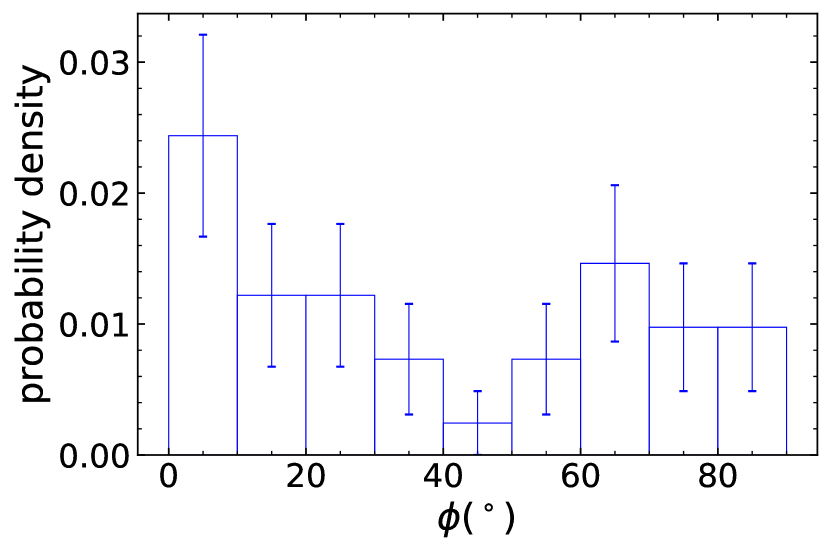
According to standard galactic models, there should be no significant rotation around the medium axis (axis ). For example, for the perfect ellipsoid model discussed in de Zeeuw (1985), it was shown that the projections of all types of orbits into the plane spanned by the major and medium axes have to be oscillatory rather than rotational, thus incapable of producing a considerable amount of angular momentum in the direction. If, as is the case for the vast majority of galaxies here, the angle is very small, meaning the galaxy mainly rotates around its short axis, then it is quite easy to imagine that the angle should be randomly distributed, because in this case there is no significant rotation around the or axes, causing fluctuations to dominate. On the contrary, fast rotating galaxies with both large and values are more interesting. We therefore select fast rotating galaxies (judged by the value calculated from their projection onto the plane of the simulation) with that have , and again plot the distribution in the right panel of Figure 8. In total, there are 41 such galaxies. It is clear from the histogram that for these galaxies the distribution of does show a peak at 0, but also shows a lower peak at larger than , with 21 of them having , thereby being inconsistent with the prediction from equilibrium theories that it should be close to 0.
To look into the intrinsic kinematics leading to such galaxies with and both very large, we study the density profiles and the velocity distributions of projections along the principal axes of these galaxies, along with the radial dependence of their kinematical parameters. Details of the study, along with 2 examples, are given in Appendix B. It is found that most of the galaxies with significant medium axis rotation show signs of non-equilibrium, marked by twists of density profiles and complex velocity distributions, some showing kinematically distinct cores, thereby the global kinematical parameters that we adopt for describing them are in fact not quite well-defined. Other galaxies showing medium-axis rotation are close to being prolate, with their medium axes almost having equal lengths to their minor axes, causing rotation around their medium axes and minor axes to be equally stable.
4.2.2 Distributions of Intrinsic Flattenings and Triaxialities
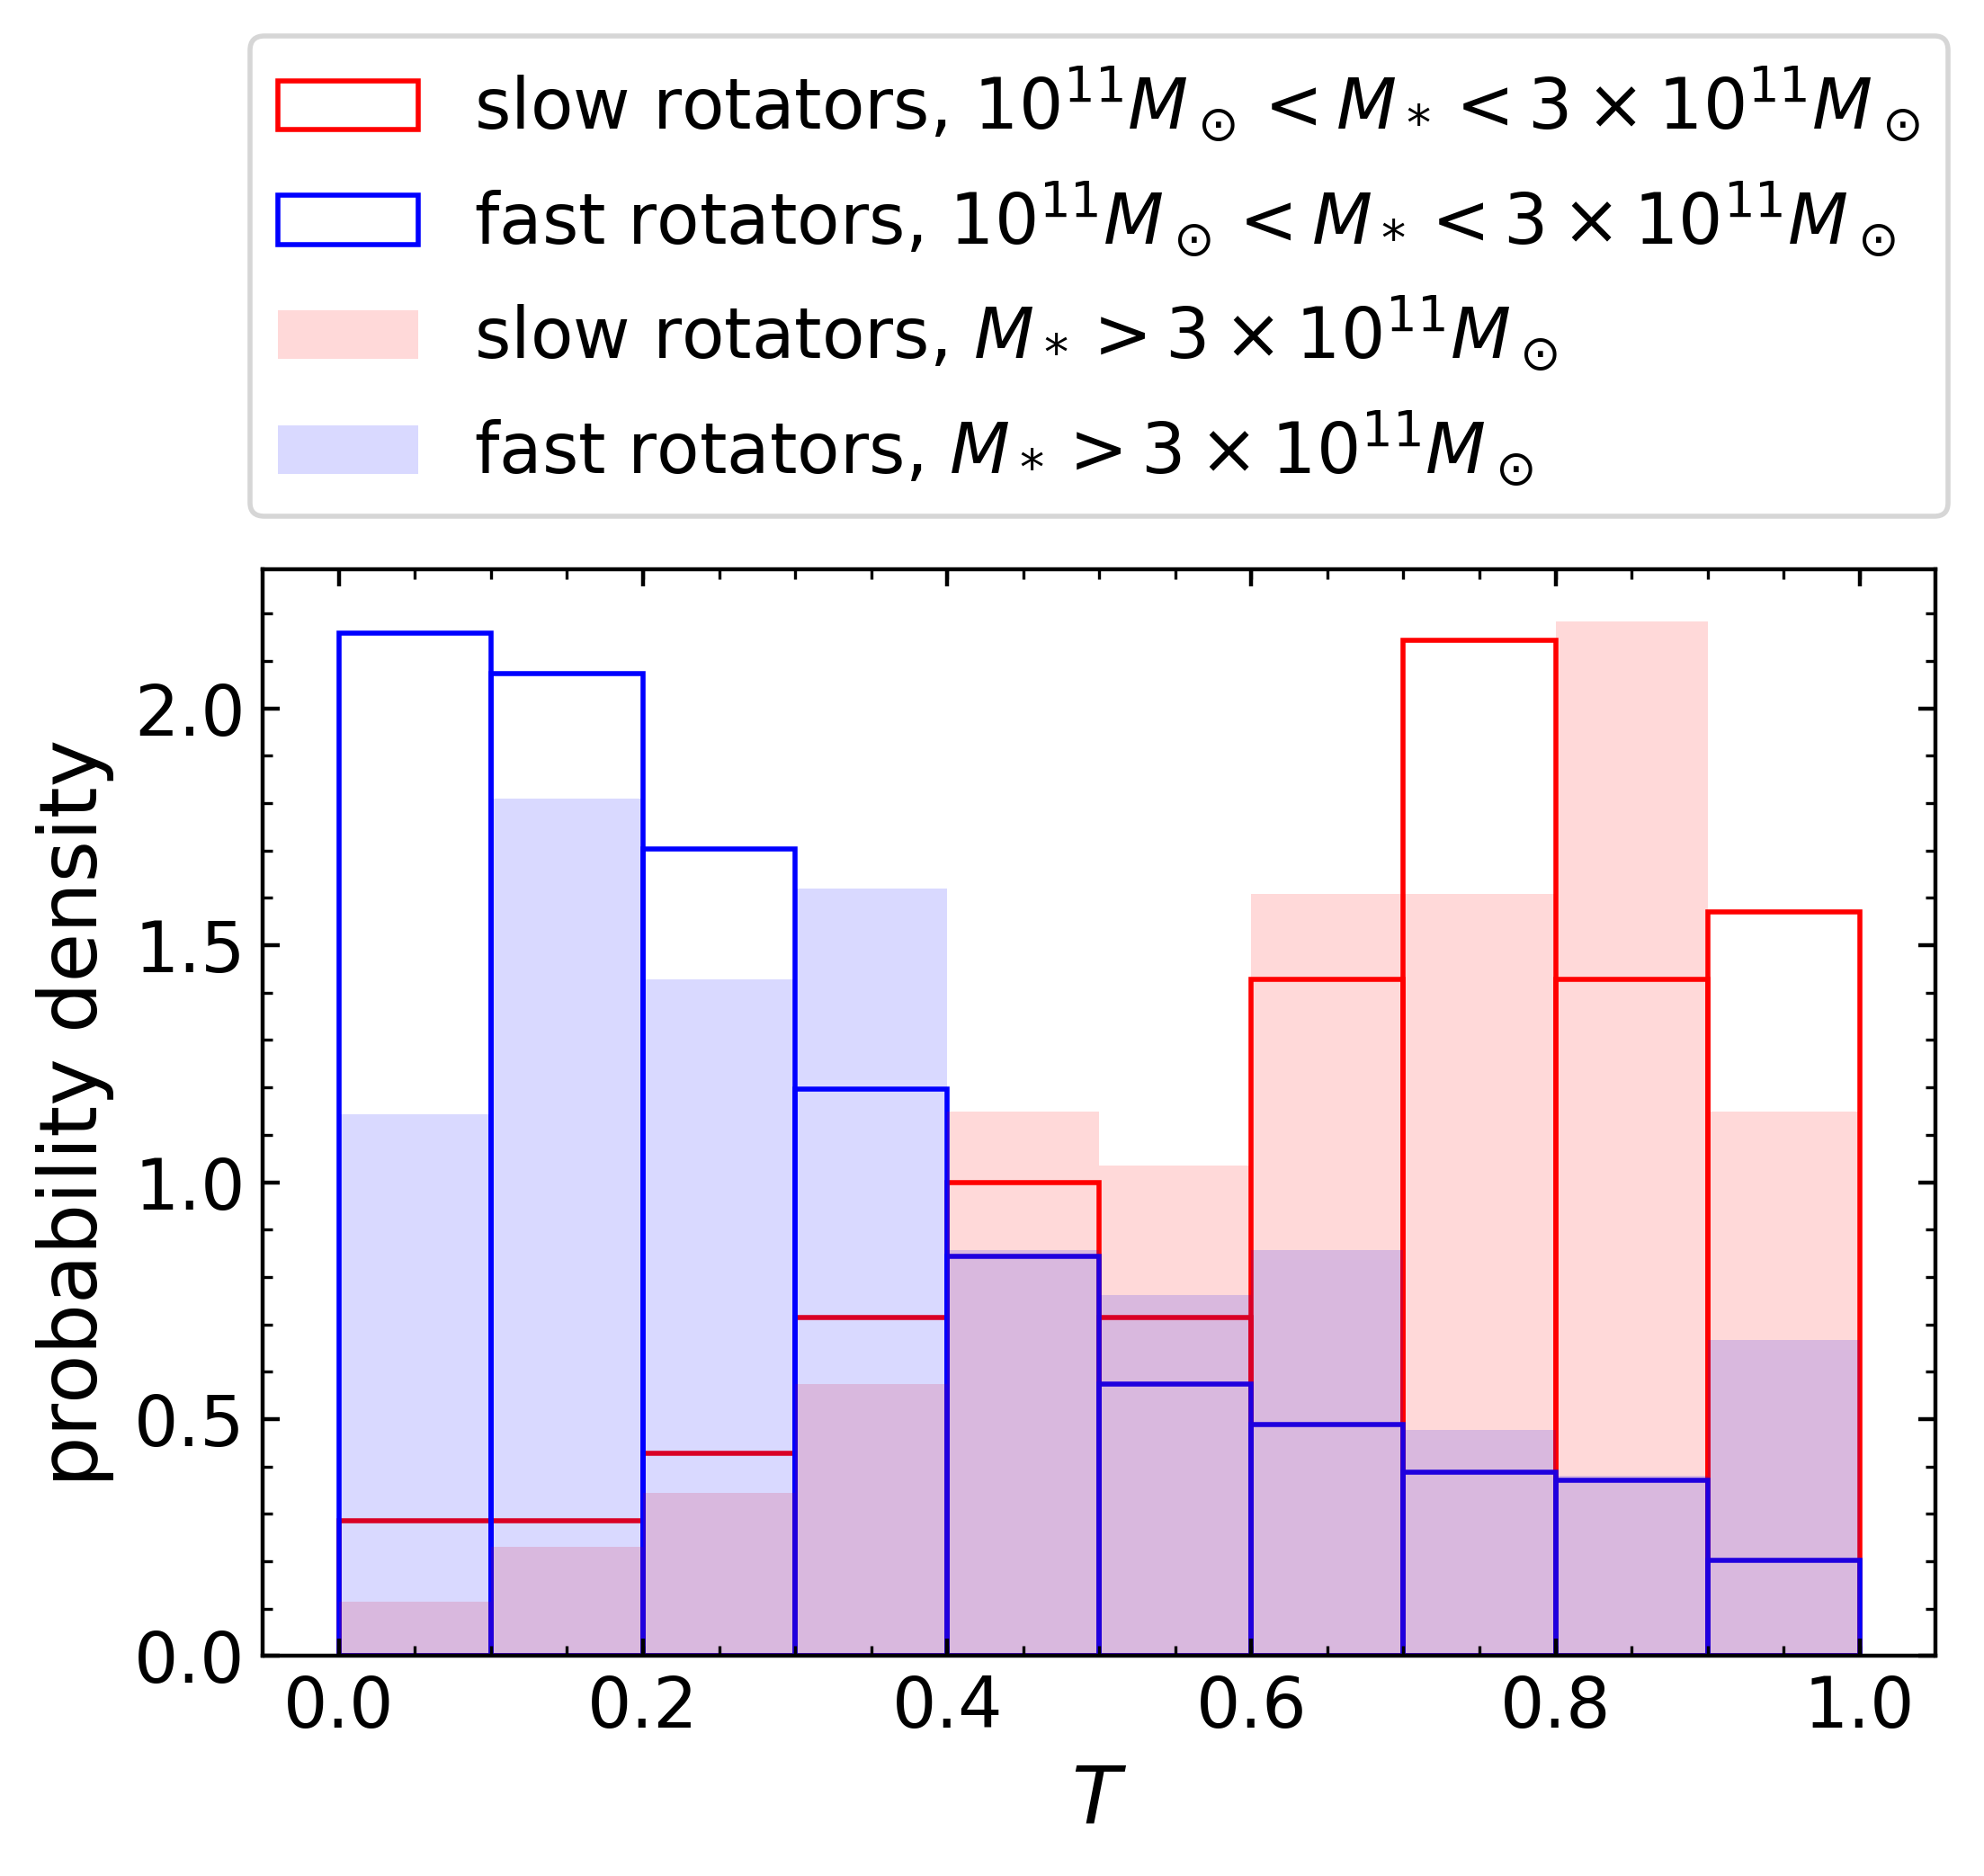
In order to study the relation of rotational speed to galactic shape, galaxies are again grouped into fast and slow rotators by the parameter calculated from their projections onto the plane. Among the 663 galaxies with , there are 593 fast rotators and 70 slow rotators. Among the 192 galaxies with , 105 are fast rotators and 87 are slow rotators. The results for the distributions of intrinsic flattenings and triaxialities are shown in Figures 9 and 10. It is obvious from Figure 9 that in both groups fast rotators tend to be flatter than slow rotators, and that overall fast rotators tend to be flatter than slow rotators.
Many works have inferred the distributions of the axis ratios of galaxies from the distributions of the observed ellipticities and kinematic misalignments of their projections. Compared to the intrinsic shapes of galaxies inferred from the ATLAS3D project (Figure 8 of Weijmans et al. 2014), the SAMI project (Figures 5 and 6 of Foster et al. 2017), the MASSIVE project (Figure 6 of Ene et al. 2018, only contains slow rotators) and the MaNGA project (Figures 2 through 4 of Li et al. 2018b, with only slow rotators), our results are qualitatively consistent with those inferred from observations, with fast rotators mostly oblate and flatter than slow rotators, which are more triaxial and prolate. However, as the case with the projections, Illustris still shows a shortage in very flattened fast rotators. It can be seen in Weijmans et al. (2014) and Foster et al. (2017) that their distributions of for fast rotators extend all the way to 0, while it is visible in Figure 9 that our flattest samples only have . In contrast, the fraction of flat slow rotators with in Illustris for both mass groups is significantly larger than that inferred from observations, which probably correspond to the highly elongated projections of slow rotators appearing in Figure 1.
4.3 Evolution of the Dynamics of Galaxies
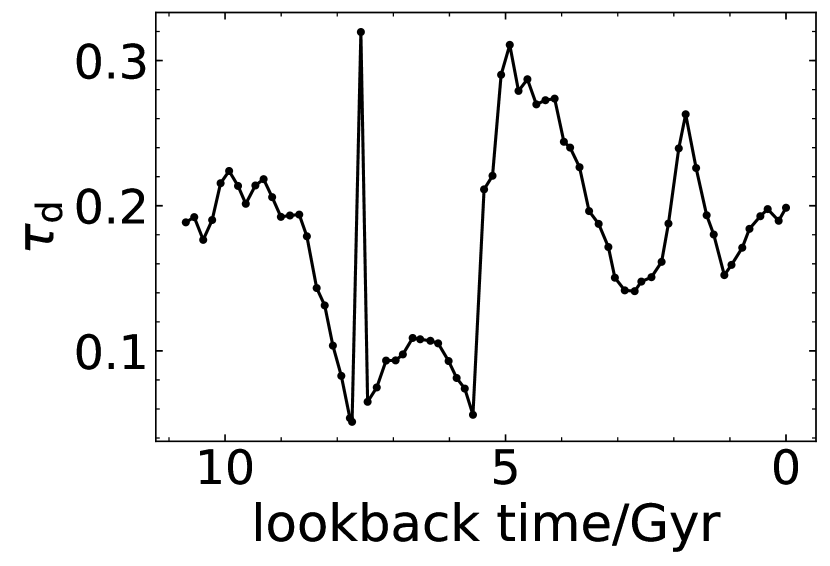
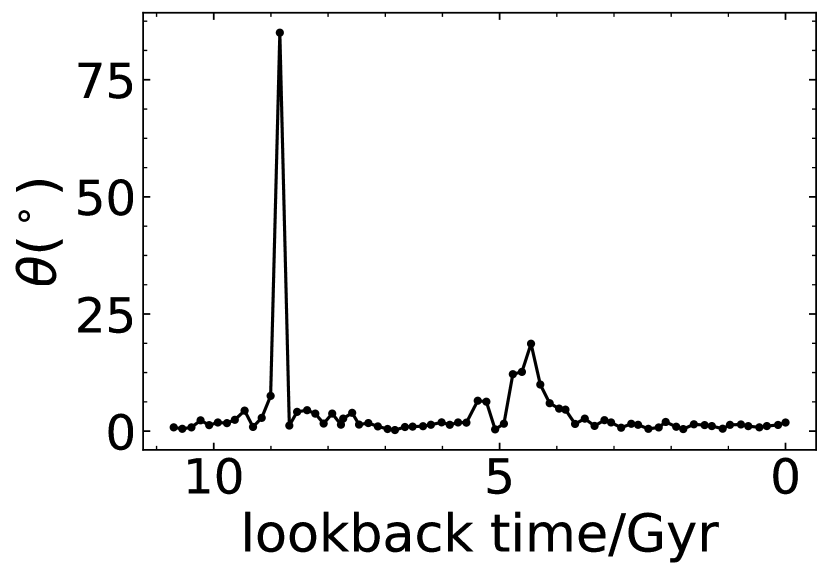
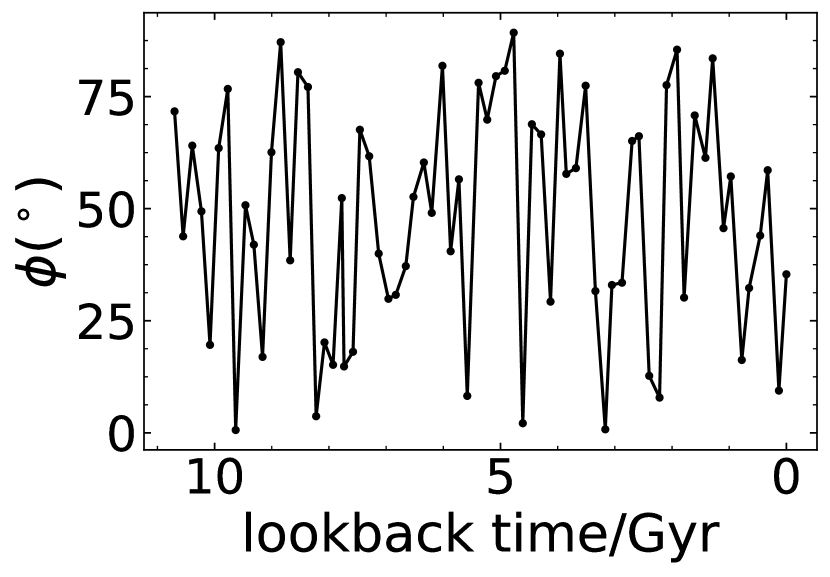
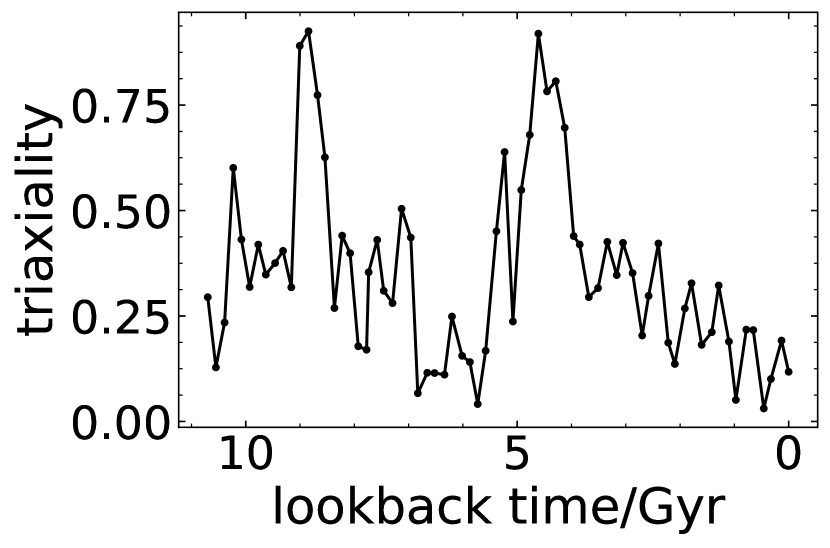
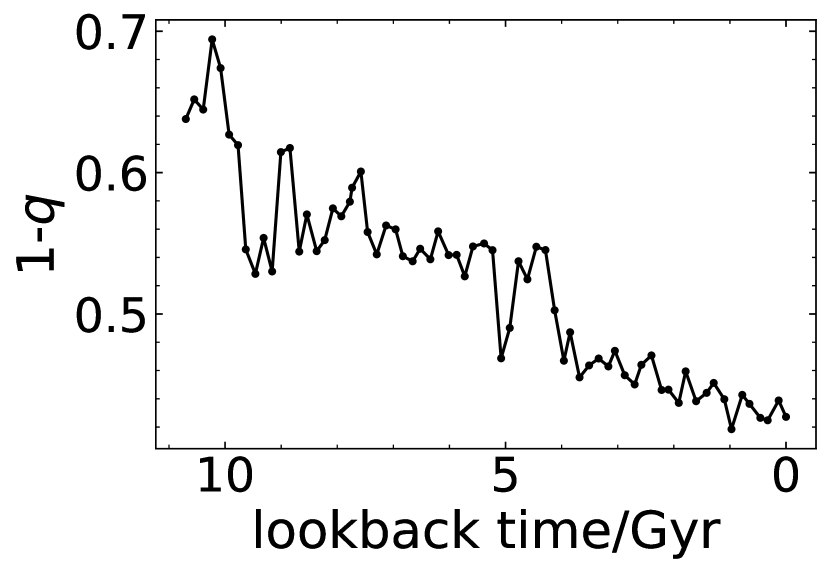
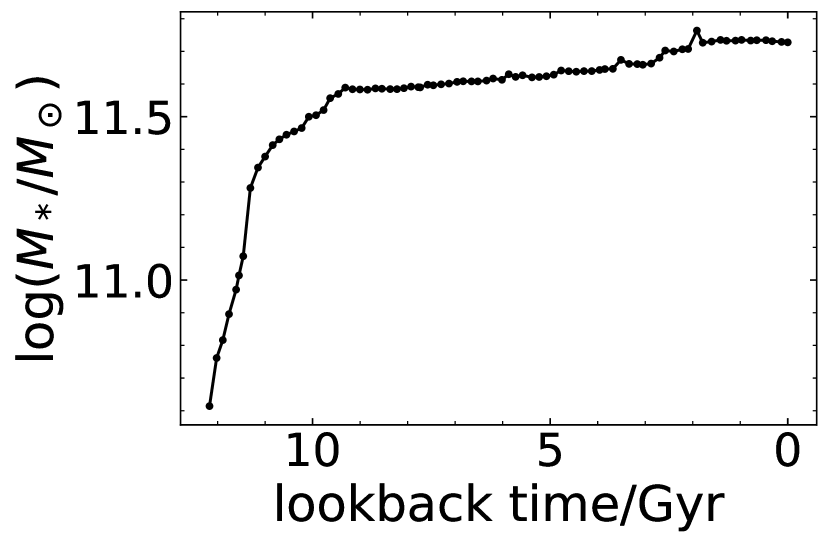
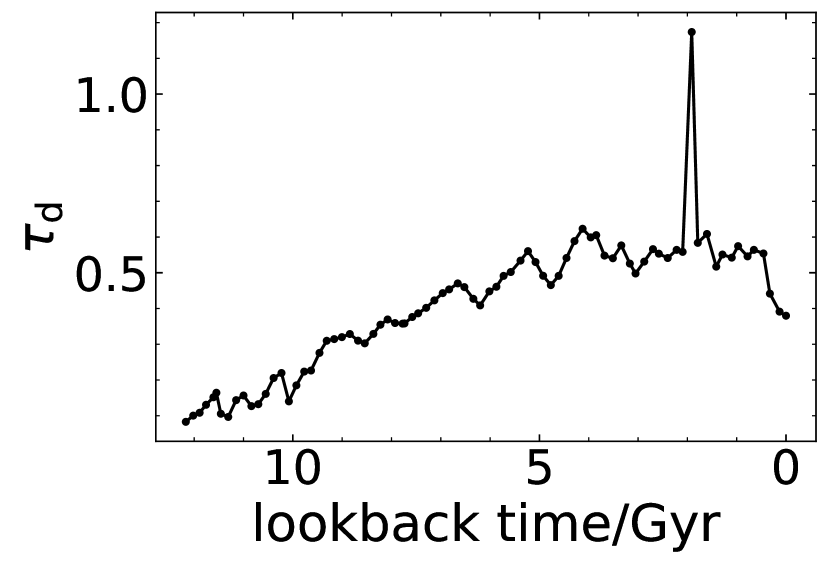
Using the merger tree, we trace the evolution history of the triaxialities, flattenings, azimuthal and polar angles of the intrinsic misalignment and for three specific galaxies, which we consider as typical representitives of their kinds, in snapshot 135 by traversing their main progenitor histories, with each data point corresponding to one snapshot. In order to understand how quickly changes may happen due to perturbation and how fast the original states would restore, we also calculated the dynamical time of a given galaxy at each snapshot. The dynamical time is estimated as
| (7) |
where is the scale factor at the time of the snapshot, is the half mass radius of the galaxy in comoving coordinates, and is its total mass.
Generally speaking, for most galaxies with clear rotation, the angles tend to have equilibrium values at 0, and when perturbed, they usually recover quickly, in most cases within times comparable to their dynamical timescales. This is, of course, consistent with our earlier results for the distributions of at snapshot 135, where the vast majority of galaxies have close to 0. There are also a few galaxies with large values, and at equilibrium, some with (rotating around an axis in the plane). But whatever the equilibrium values of are, they are typically quickly reached after perturbations, and do not evolve until the next major perturbation takes place. The equilibria of are generally also very stable, with only small fluctuations. The triaxialities and flattenings of different galaxies typically have different equilibrium values, show larger fluctuation, and in general slowly decreasing with time when there are no perturbations. Under major mergers, however, the triaxiality of a galaxy typically substantially increases to values close to 1 (corresponding to prolateness), and in some rare cases even finds a new equilibrium value close to 1 without resuming its value before the merger. In most cases, the triaxiality do resume, but both and usually recover slightly slower than after perturbations. On the contrary, for galaxies mostly rotating around their minor axes, i.e., with small , the values seem not to have an equilibrium value, and oscillate violently between 0 and without clear patterns for most galaxies. Below we show several typical examples of their dynamical evolution.
4.3.1 Subhalo #12: Ordinary Fast Rotating Galaxy
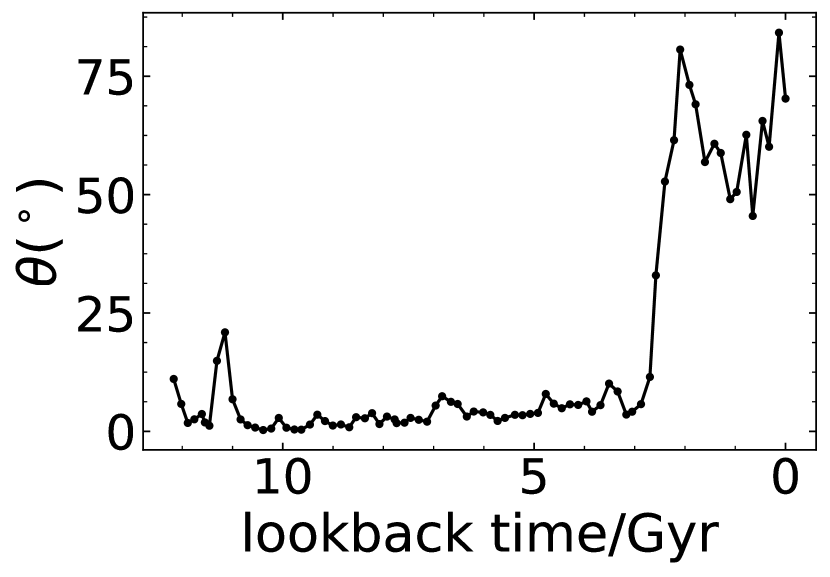
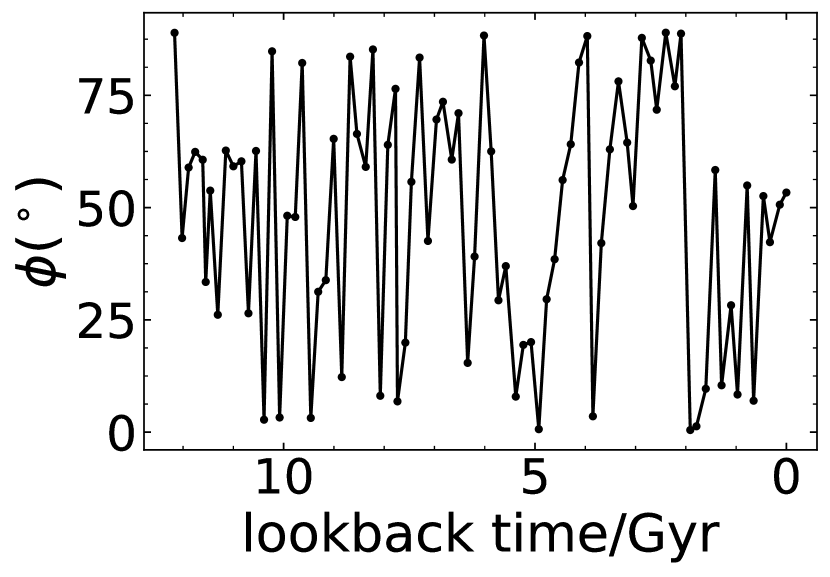
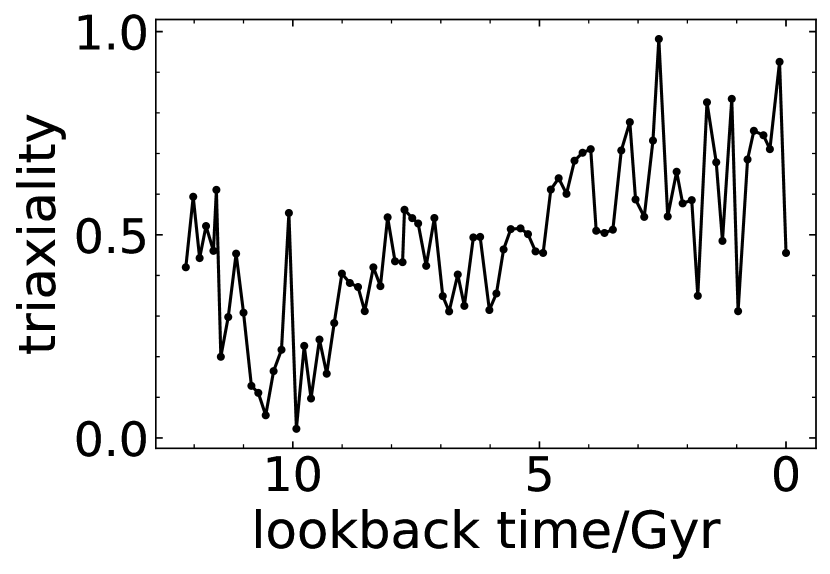
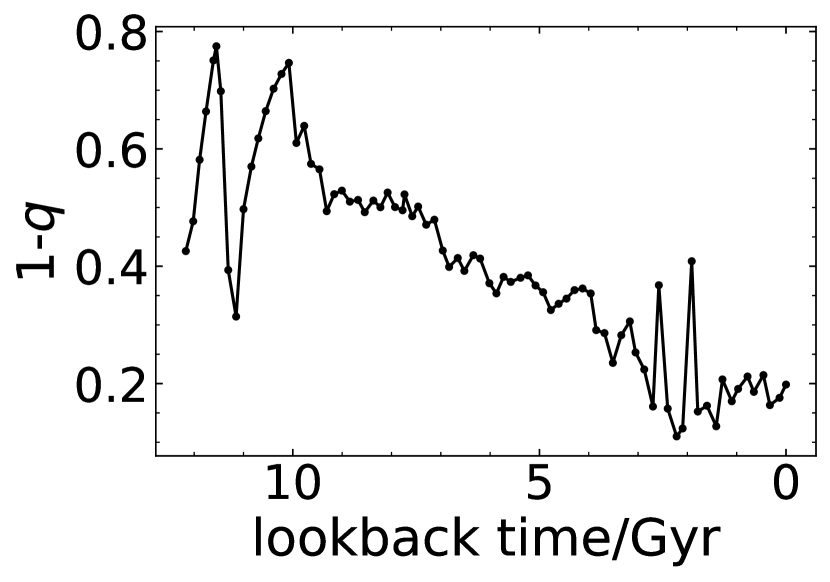
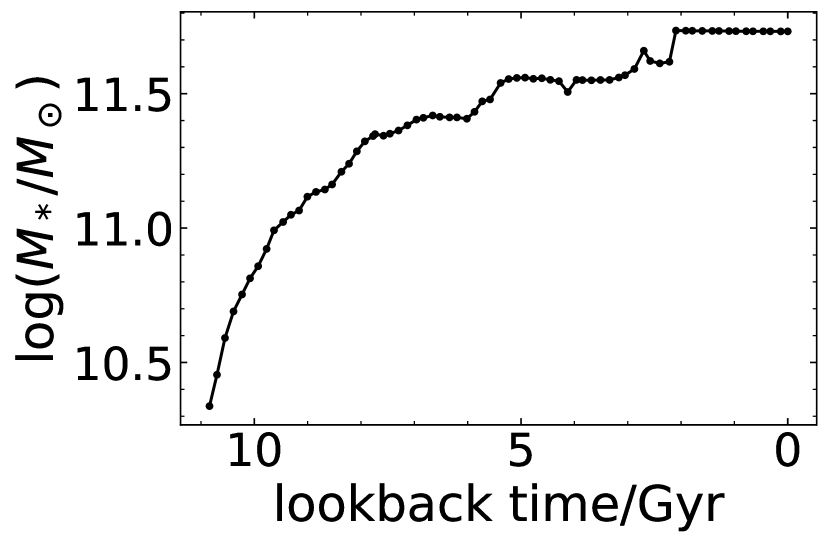
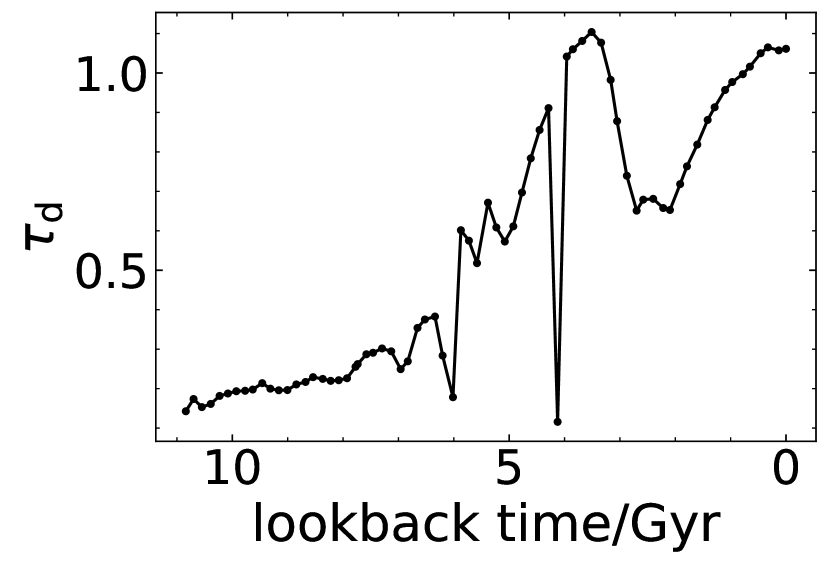
Subhalo #12 is a typical fast rotating galaxy with its angular momentum closely aligned to its axis. The evolution of its mass, triaxiality, flattening, and is shown in Figure 11.
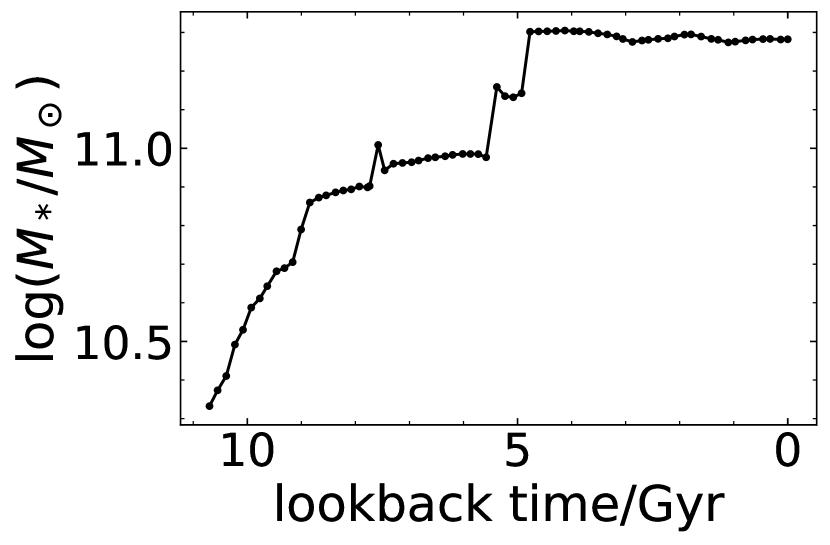
From the steep mass evolution curve, it is clear that this galaxy grows by several major mergers, most of which also show their marks on the evolution curves of and the triaxiality. For the major merger just after 9 Gyr lookback time, the angle was perturbed to a value of over , but recovered to its equilibrium value of 0 with only slight oscillations after the next snapshot.
Although with oscillations, the dynamic time for this galaxy lies within the range of 0.05 Gyr to 0.3 Gyr. Note that the response time for the system to reach equilibrium after different perturbations, measured in the dynamic timescale, is different. After the merger, slightly after 5 Gyr lookback time, for example, it took almost 1 Gyr for both and triaxiality to resume equilibrium, and the dynamic timescale then was around 0.2 Gyr. However, for the merger after 9 Gyr lookback time, which was discussed before, the response time was only about 0.1 or 0.2 Gyr, whereas the dynamical timescale at this time was around 0.15 Gyr, only slightly smaller than that at lookback time 5 Gyr. The reason for this might be that the response time is related to the nature of the perturbation, and the two major mergers may have enough intrinsic difference to make their response times different from each other. The other possibility is that the response time depends on the galactic shape, mass or details of its intrinsic kinematics as well as the dynamical timescale, which is only related to its density. Nevertheless, after both perturbations the response times for the angle to regain equilibrium are still within a few orders of magnitude of the dynamic times.
Both the triaxiality and the flattening seem to be decreasing over time when unperturbed. The decrease of triaxiality may be induced by the rotation around the minor axis, which will cause the galaxy to become more axisymmetric around it. The decline of the flattening means that the galaxy is becoming rounder, a possible cause is that the rotation of the galaxy is slowing down, gradually making it less elongated along the major and medium axes. The azimuthal intrinsic misalignment angle here shows complete randomness in the evolutional curve, oscillation stochastically between 0 and .
4.3.2 Subhalo #104799: Fast Rotating Galaxy with Significant Angular Momentum around the Medium Axis
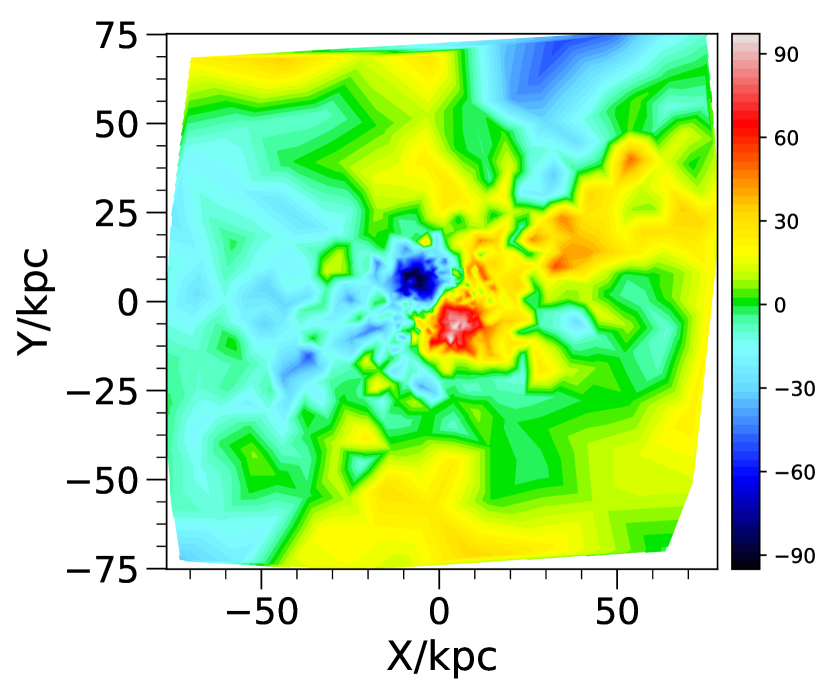
For another example, we choose subhalo #104799 at snapshot 135, whose density profiles of the principal projections and velocity fields are also examined in Appendix B. This galaxy is one of the “abnormal” galaxies that are fast rotating and have both large and values for the intrinsic misalignment. The evolutions of its mass, triaxiality, flattening, and are plotted in Figure 12.
It can be seen from the mass evolution curve that this galaxy, unlike subhalo #12, grows mainly by minor mergers or accretion, with its mass continuously increasing with time. There are also several visible mergers, for example the one at around lookback time 11.2 Gyr and the series of mergers between lookback times 4 Gyr and 2 Gyr, and one shortly after lookback time 2 Gyr (see Figure 12).
For this galaxy, the angle also remains close to 0 for most of the time, and recovers quickly after the perturbation at lookback time 11.2 Gyr in around 0.5 Gyr which is quite comparable to the dynamical timescale then of between 0.1 and 0.2 Gyr. After the perturbation around lookback time 2 Gyr, however, the recovery is not so rapid, and after lookback time 1 Gyr it increases to near again. As stated before, it apparently still has not recovered equilibrium at snapshot 135. There are two possible reasons, the first being the different nature of the two perturbations, as stated above for subhalo #12, the second being the change of galactic mass and shape, also stated for subhalo #12. In this case, it can be seen from Figures 16 and 17 that the kinematically distinct core actually forms a rather independent system of its own, almost perfectly rotating around its minor axis with very small angles at small . It is possible that such a configuration is comparatively more stable than totally irregular density and velocity distributions, making the relaxation time substantially longer.
4.3.3 Subhalo #210738: Prolate Galaxy with Minor Axis Rotation
For some galaxies with the angle between the minor axis and the rotation axis, , at equilibrium at large values, the azimuthal intrinsic misalignment angle seems to have an equilibrium point at 0. An interesting example is subhalo #210738, which is also adopted as an example of a prolate galaxy with minor axis rotations in Li et al. (2018a), where the stellar density distributions of its 3 principal projections and the velocity field of its projection are presented. Figure 13 shows its evolution curves.
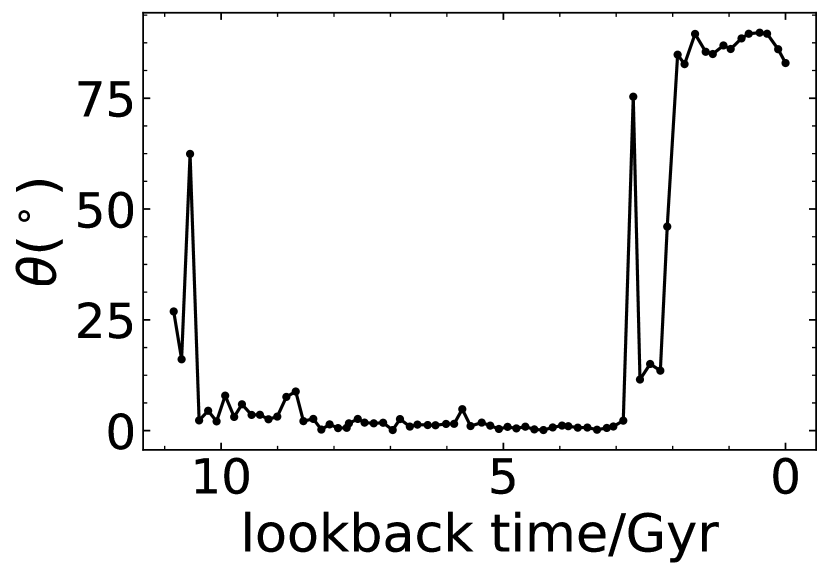

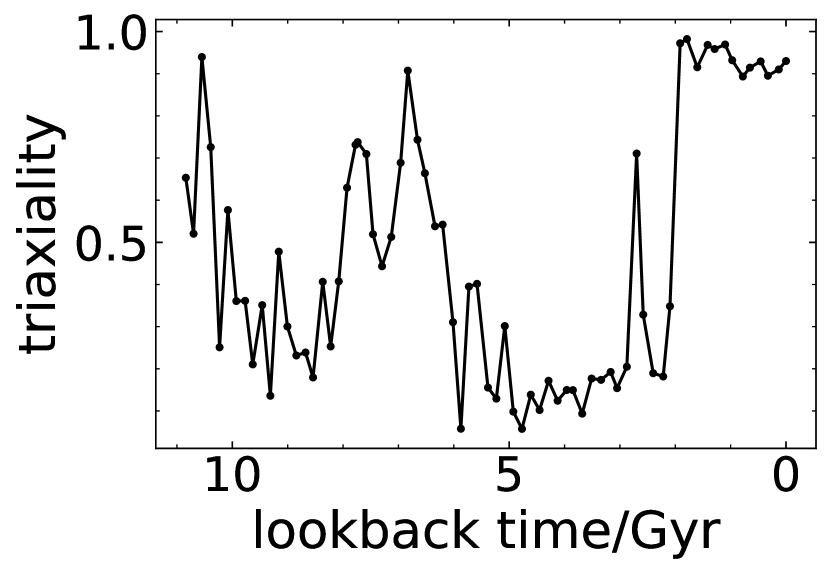
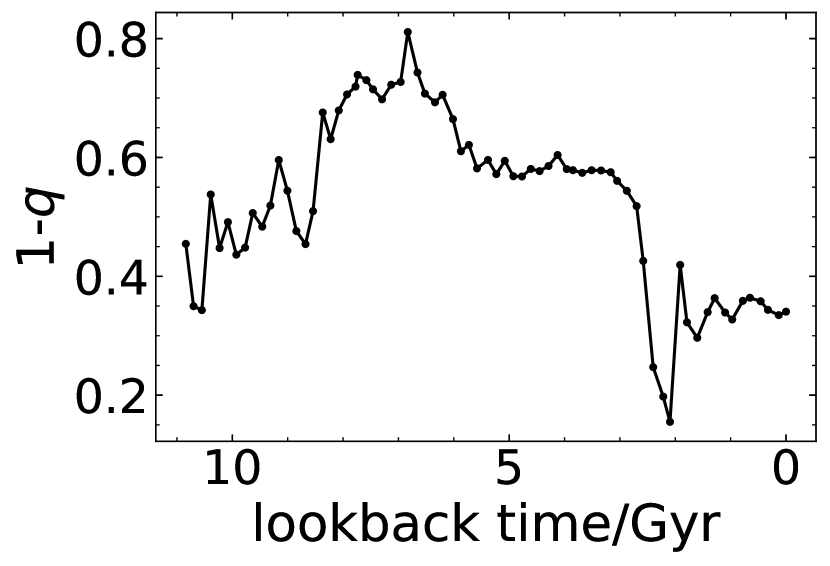
Clearly the merger slightly before lookback time 2 Gyr greatly influences the intrinsic kinematics of this galaxy. Before this event, the angle has an equilibrium point of , and the angle, like the two examples above, shows almost complete randomness. However, after the merger event the equilibrium point for changes to , and the triaxiality also becomes quite stable at values close to 1, meaning that the system becomes a prolate galaxy with complete minor axis rotation. In the mean time, the angle also dramatically drops and, although still oscillating slightly, never again reaches values larger than . This indicates that in this case has an equilibrium point at 0, but it is far less stable than the equilibrium points for at 0 or . Also, note that the relaxation time for to reach an approximate equilibrium is about 1 Gyr, longer than the time for to reach approximate equilibrium (only about 0.5 Gyr).
5 summary and conclusion
We studied the mass dependence of both the kinematic properties of galactic projections and 3-dimensional properties of galaxies from the Illustris simulation. We used Illustris-1 data at redshift zero, and included two mass groups of galaxies for most of our studies, namely, and .
We projected each galaxy along the 3 principal axes of the simulation box. Each projection is then treated as an independent sample. The distributions of the parameters, ellipticities and kinematic misalignments were then analysed. The results show that fast rotators generally are less massive, have a larger span of ellipticities, and their kinematic misalignments are highly peaked at 0 while slow rotators are usually rounder and more kinematically misaligned. This is consistent with observational results such as Emsellem et al. (2011) and Weijmans et al. (2014) for ATLAS3D and Ma et al. (2018) for MASSIVE. However, close comparisons still reveal some inconsistencies, such as a considerable number of Illustris slow rotators with large ellipticities, which are rare in observations. According to Moody et al. (2014), such slow rotators may have different formation paths from ordinary round ones: the former results from dry binary mergers or those with zero total angular momentum, while the latter are remnants of sequential mergers. Another inconsistency is that the Illustris simulation lacks highly flattened fast rotators with , which are present in observations.
From the distributions of the triaxialities for fast and slow rotators (Figure 10), it is clear that fast rotators have a tendency of having lower triaxialities, thereby preferentially being more oblate, and slow rotators tend to be more prolate. The distribution of the flattening (Figure 9) shows that fast rotators tend to be flatter than slow rotators, and the resulting distributions are similar to those inferred from observations. In comparison to intrinsic shapes of galaxies inferred from observations, the Illustris simulation has a shortage of highly flattened fast rotators and a significantly higher fraction of flattened slow rotators, the latter likely corresponds to the appearence of abnormally elongated slow rotators in our analysis of the projections of Illustris galaxies.
The distributions of the intrinsic misalignments display some interesting results (Figure 8). The distributions of for both mass groups are peaked at 0 with the group having a sharper peak, indicating most galaxies are rotating about their shortest axis (Z-axis). Their values fluctuate between 0 and . There are galaxies with large , i.e., rotating about the (major) and (medium) axes, where the latter case is forbidden by equilibrium theories of galactic kinematics such as de Zeeuw (1985). Regarding these special galaxies, we found that most of them have very irregular patterns of intrinsic kinematics such as showing kinematically distinct cores and other signs of non-equilibrium.
The evolution of the intrinsic shape and misalignment was also investigated, using three specific galaxies which we consider as typical ones. The results suggest that for galaxies with no significant interaction with neighbors and regular velocity fields, the angles usually have equilibrium values close to 0, and the relaxation times for them to recover equilibrium after a perturbation are generally of the order of their dynamic timescales and not very long. The equilibria of the triaxialities and flattenings are less stable, their equilibrium points vary greatly from galaxy to galaxy and both typically decrease with redshift when unperturbed, while some of the increases correlate with major mergers. For galaxies with small there does not seem to be an equilibrium value for at all, and they generally oscillate randomly between 0 and . For some fast rotating galaxies with large (rotating around their and axes), the angles seem to have an equilibrium at 0, indicating systems rotating about the longest axis (X-axis), although the stability of this is not very high, marked by significant fluctuations. This might reveal problems with the standard theories, or may be a consequence of improper model implementation adopted by the simulation. A more statistical investigation of this problem will be an intersting topic for future studies. It might also be interesting to repeat this exercise for more recent simulations such as the Illustris-TNG project (Pillepich et al., 2018) and the EAGLE project (Schaye et al., 2014).
Acknowledgement
We performed our computer runs on the Venus computer cluster of the Tsinghua Center for Astrophysics, the computer cluster of the Heidelberg Institute for Theoretical Studies (HITS) and the Virgo computer cluster of the Max-Planck Institute for Astrophysics (MPA). This work is supported by Tsinghua University Initiative Scientific Research Program (Grant No. 20181080300). This work is partly supported by a joint grant between the DFG and NSFC (Grant No. 11761131004) and the National Key Basic Research and Development Program of China (No. 2018YFA0404501).
References
- Allgood et al. (2006) Allgood B., Flores R. A., Primack J. R., Kravtsov A. V., Wechsler R. H., Faltenbacher A., Bullock J. S., 2006, Monthly Notices of the Royal Astronomical Society, 367, 1781
- Bacon et al. (2001) Bacon R., et al., 2001, Monthly Notices of the Royal Astronomical Society, 326, 23
- Bahe et al. (2017) Bahe Y. M., et al., 2017, Monthly Notices of the Royal Astronomical Society, 470, 4186
- Bryant et al. (2015) Bryant J. J., et al., 2015, Monthly Notices of the Royal Astronomical Society, 447, 2857
- Bundy et al. (2015) Bundy K., et al., 2015, Astrophysical Journal, 798, 24
- Cappellari (2016) Cappellari M., 2016, Structure and Kinematics of Early-Type Galaxies from Integral Field Spectroscopy. Annual Reviews, Palo Alto, pp 597–665, doi:10.1146/annurev-astro-082214-122432
- Cappellari & Copin (2003) Cappellari M., Copin Y., 2003, Monthly Notices of the Royal Astronomical Society, 342, 345
- Cappellari et al. (2007) Cappellari M., et al., 2007, Monthly Notices of the Royal Astronomical Society, 379, 418–444
- Cappellari et al. (2011) Cappellari M., et al., 2011, Monthly Notices of the Royal Astronomical Society, 413, 813
- Cappellari et al. (2013a) Cappellari M., et al., 2013a, Monthly Notices of the Royal Astronomical Society, 432, 1709
- Cappellari et al. (2013b) Cappellari M., et al., 2013b, Monthly Notices of the Royal Astronomical Society, 432, 1862
- Choi et al. (2018) Choi H., Yi S. K., Dubois Y., Kimm T., Devriendt J. E. G., Pichon C., 2018, Astrophysical Journal, 856, 12
- Dubois et al. (2014) Dubois Y., et al., 2014, Monthly Notices of the Royal Astronomical Society, 444, 1453
- Emsellem et al. (2007) Emsellem E., et al., 2007, Monthly Notices of the Royal Astronomical Society, 379, 401
- Emsellem et al. (2011) Emsellem E., et al., 2011, Monthly Notices of the Royal Astronomical Society, 414, 888
- Ene et al. (2018) Ene I., et al., 2018, Monthly Notices of the Royal Astronomical Society, 479, 2810
- Falcon-Barroso et al. (2015) Falcon-Barroso J., Lyubenova M., van de Ven G., Collaboration C., 2015, Angular Momentum across the Hubble sequence from the CALIFA survey. pp 78–81
- Foster et al. (2017) Foster C., et al., 2017, Monthly Notices of the Royal Astronomical Society, 472, 966
- Franx et al. (1991) Franx M., Illingworth G., De Zeeuw T., 1991, Astrophysical Journal, 383, 422
- Genel et al. (2014) Genel S., et al., 2014, Monthly Notices of the Royal Astronomical Society, 445, 175
- Graham et al. (2018) Graham M. T., et al., 2018, Monthly Notices of the Royal Astronomical Society, 477, 4711
- Jesseit et al. (2009) Jesseit R., Cappellari M., Naab T., Emsellem E., Burkert A., 2009, Monthly Notices of the Royal Astronomical Society, 397, 1202
- Krajnovic et al. (2006) Krajnovic D., Cappellari M., De Zeeuw P. T., Copin Y., 2006, Monthly Notices of the Royal Astronomical Society, 366, 787–802
- Krajnovic et al. (2011) Krajnovic D., et al., 2011, Monthly Notices of the Royal Astronomical Society, 414, 2923
- Lagos et al. (2018) Lagos C. d. P., Schaye J., Bahé Y., Van de Sande J., Kay S. T., Barnes D., Davis T. A., Dalla Vecchia C., 2018, Monthly Notices of the Royal Astronomical Society, 476, 4327
- Li et al. (2018a) Li H. Y., Mao S. D., Emsellem E., Xu D. D., Springel V., Krajnovic D., 2018a, Monthly Notices of the Royal Astronomical Society, 473, 1489
- Li et al. (2018b) Li H. Y., Mao S. D., Cappellari M., Graham M. T., Emsellem E., Long R. J., 2018b, Astrophysical Journal Letters, 863
- Ma et al. (2014) Ma C. P., Greene J. E., McConnell N., Janish R., Blakeslee J. P., Thomas J., Murphy J. D., 2014, Astrophysical Journal, 795, 18
- Ma et al. (2018) Ma C.-P., et al., 2018, Monthly Notices of the Royal Astronomical Society, 479, 2810
- Moody et al. (2014) Moody C. E., Romanowsky A. J., Cox T. J., Novak G. S., Primack J. R., 2014, Monthly Notices of the Royal Astronomical Society, 444, 1475
- Naab & Burkert (2003) Naab T., Burkert A., 2003, Astrophysical Journal, 597, 893
- Naab et al. (2006) Naab T., Jesseit R., Burkert A., 2006, Monthly Notices of the Royal Astronomical Society, 372, 839
- Nelson et al. (2015) Nelson D., et al., 2015, Astronomy and Computing, 13, 12
- Pillepich et al. (2018) Pillepich A., et al., 2018, Monthly Notices of the Royal Astronomical Society, 473, 4077
- Sanchez et al. (2012) Sanchez S. F., et al., 2012, Astronomy & Astrophysics, 538
- Schaye et al. (2014) Schaye J., et al., 2014, Monthly Notices of the Royal Astronomical Society, 446, 521
- Schulze et al. (2018) Schulze F., Remus R. S., Dolag K., Burkert A., Emsellem E., van de Ven G., 2018, Monthly Notices of the Royal Astronomical Society, 480, 4636
- Springel (2010) Springel V., 2010, Monthly Notices of the Royal Astronomical Society, 401, 791
- Van Den Bosch & Van De Ven (2009) Van Den Bosch R. C. E., Van De Ven G., 2009, Monthly Notices of the Royal Astronomical Society, 398, 1117
- Veale et al. (2017) Veale M., Ma C. P., Greene J. E., Thomas J., Blakeslee J. P., McConnell N., Walsh J. L., Ito J., 2017, Monthly Notices of the Royal Astronomical Society, 471, 1428
- Vogelsberger et al. (2014a) Vogelsberger M., et al., 2014a, Monthly Notices of the Royal Astronomical Society, 444, 1518
- Vogelsberger et al. (2014b) Vogelsberger M., et al., 2014b, Nature, 509, 177
- Weijmans et al. (2014) Weijmans A. M., et al., 2014, Monthly Notices of the Royal Astronomical Society, 444, 3340
- de Zeeuw (1985) de Zeeuw T., 1985, Monthly Notices of the Royal Astronomical Society, 216, 273
- van de Sande et al. (2019) van de Sande J., et al., 2019, Monthly Notices of the Royal Astronomical Society, 484, 869
Appendix A The Influence of Pixel Binning on the Calculated Parameter
Here, we investigate the influence of the number of star particles per bin on the calculated parameter. In general, an insufficient number of star particles per pixel will cause the calculated value to be higher than its true value. For a straightforward explanation of this, consider a special case where each pixel contains only two or three star particles, and assume that there is really no ordered rotation whatsoever, and that the line of sight velocities of all the particles independently obey Gaussian distributions centered at 0. The theoretical value for should therefore be 0, corresponding to a vanishing signal-to-noise ratio within each pixel. Practically, however, it is very hard for the velocities of the few particles within any pixel to exactly cancel out, thus giving a spurious positive signal-to-noise ratio. In this case, for most pixels may be of the same order of magnitude as . Therefore, the parameter calculated under this binning is much higher than the theoretical value of 0. If we now reduce the number of pixels so that each contains a large number of star particles, then from the law of large numbers it is obvious that the average velocities in most pixels should be much smaller than the velocity dispersions. Therefore, the numerator of Eq.(4) will now be much smaller than the denominator, and the calculated with the new pixel binning will thus be close to 0. This shows that the number of star particles per pixel should not be too small when calculating the parameter.
To quantitatively study this problem, we use a Monte-Carlo simulation to estimate the infuence of not having enough stellar particles per pixel on the calculated values. To simplify the problem, we assume that the pixels are square (rather than the irregualr Voronoi bins in real calculations) and each contains the same number of star particles. Furthermore, for each simulated galaxy, the distribution of the velocities of star particles in each pixel are set to be a Gaussian distribution with the same average and standard deviation . The number of pixels is for each simulation. The ratio
| (8) |
is what a statistical calculation of would obtain, should there be an infinite (or rather, large enough) number of star particles per bin. On the other hand, the calculated value, as defined by Eq.(4) with simplifying assumptions described above, is
| (9) |
where is the total number of bins. The mathematical expectation value of the calculated value is then determined using a Monte-Carlo simulation with trials.
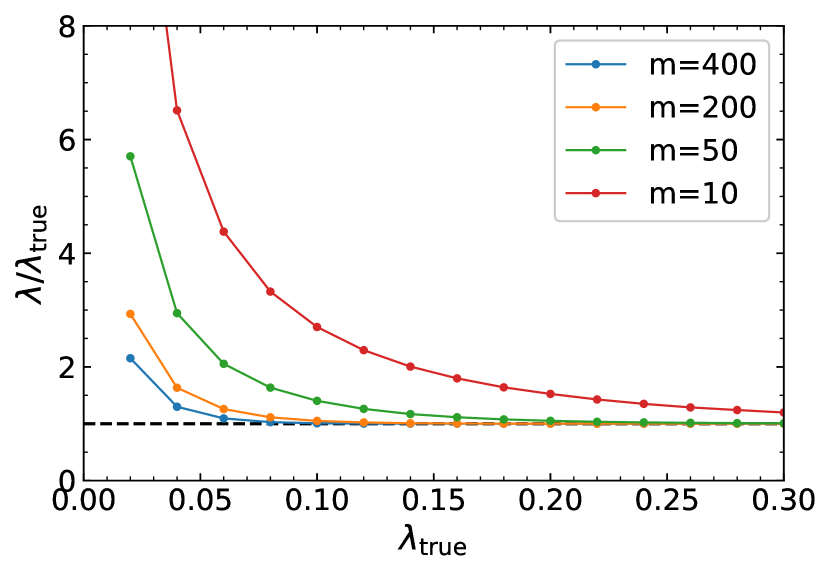
The ratios for different numbers of star particles per pixel are plotted in Figure 14. It can be seen that for , is greatly larger than for a vast range of values, leading to severe mis-classification. In contrast, although for is still considerably greater than for , this only leads to errors for galaxies with very small ellipticities in the rotator classification, as discussed below.
The only use of the parameter is for classifying fast and slow rotators, with the criterion given by Eq.(5). Therefore, for a galaxy with ellipticity , we only need the error of the calculated parameter at the corresponding criterion value to be small. Consider galaxies with , the criterion corresponding to which is . It can be seen that for 200 to 400 star particles per pixel, is very close to at the critical value for fast and slow rotators when . On the contrary, is substantially greater than at critical value for . As the number of star particles per pixel decreases, the range of values over which deviates noticeably from broadens further. Therefore, slow rotators with low ellipticities are far more likely to be wrongly grouped into fast rotators than their flatter counterparts. This expectation is supported by the results of Section 4.1.1, where it is easily observed that for less massive galaxies (), there are almost no slow rotators with because due to this systematic error, the calculated would be much larger than their real values, causing all of them to be misclassified as fast rotators instead.
Another group of galaxies with was originally also included in our analysis. However, for most of these galaxies, it was found that the total numbers of star particles were too small, making it difficult for pixel binning. Either the pixels were too few, causing the resolution to be very poor, or most pixels did not contain enough star particles. As a result, this group of galaxies was eventually discarded.
Appendix B The Radial Dependence of the intrinsic Kinematics of Galaxies with Medium Axis Rotation
To study galaxies with medium axis rotation, i.e, and both very large, we study the radial dependence of the kinematical parameters of galaxies with both large and values. To do this, we change the semi-major axis of the ellipsoid described in the beginning of Section 3.3, obtain ellipsoids of different sizes using the iterative ellipsoid method described there and calculate the kinematical parameters within each of them.
B.1 Subhalo #104799: Fast Rotating Galaxy with a Kinematic Distinct Core
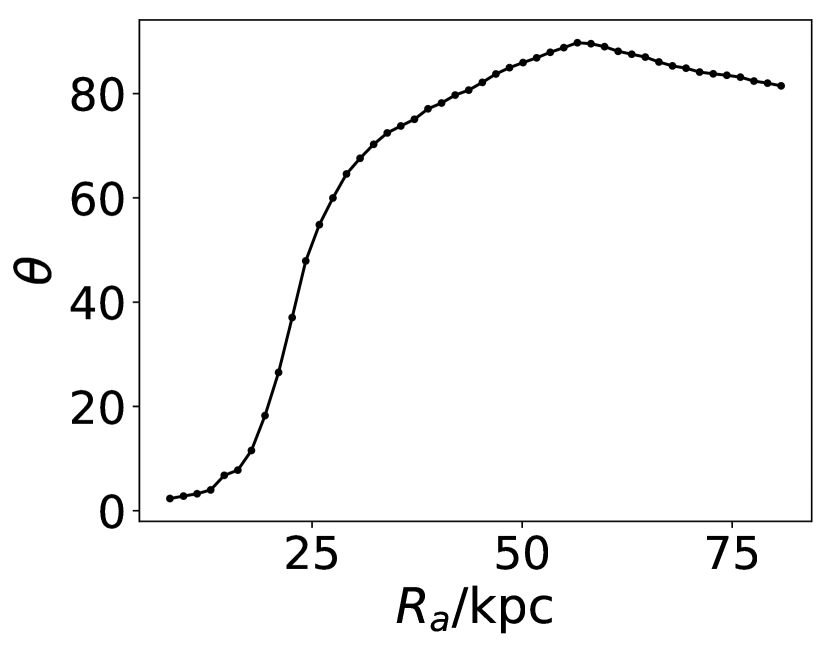

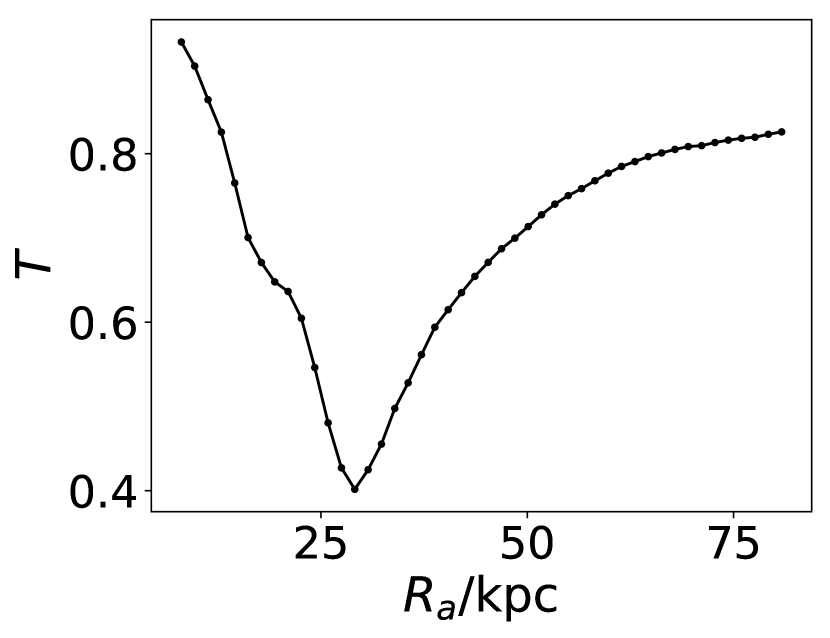
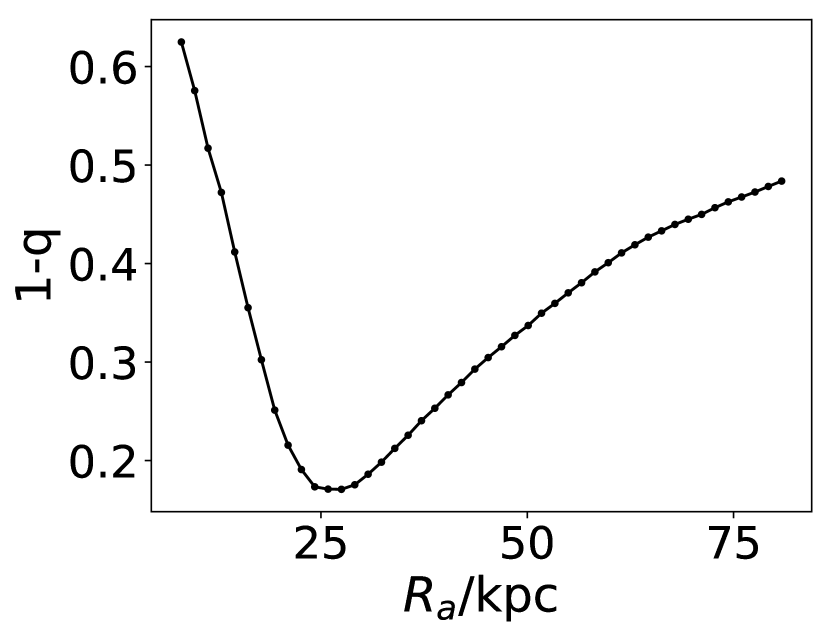
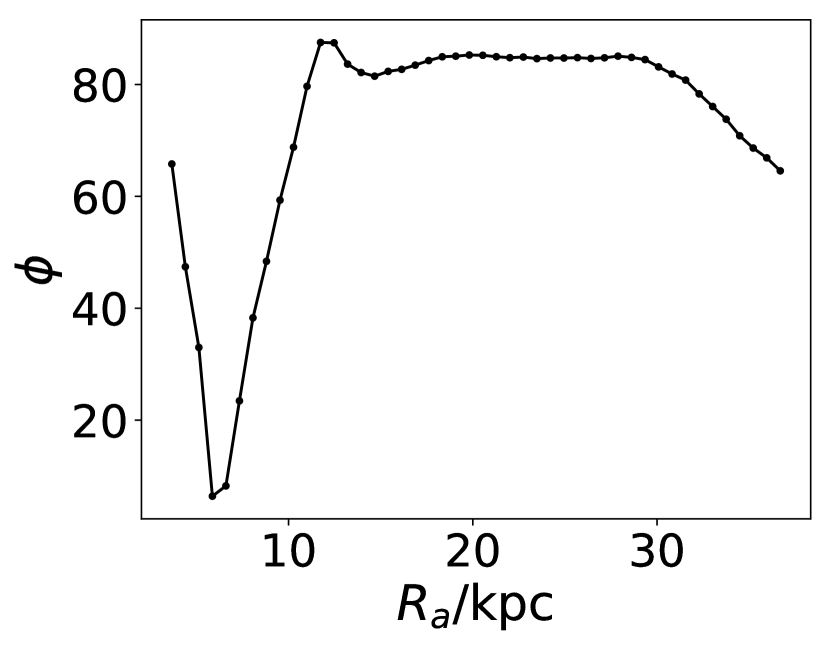
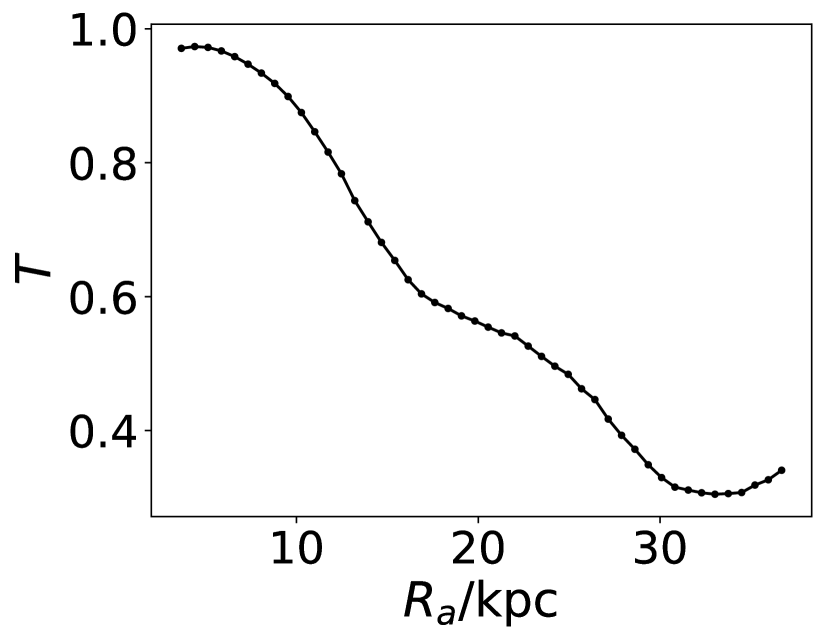
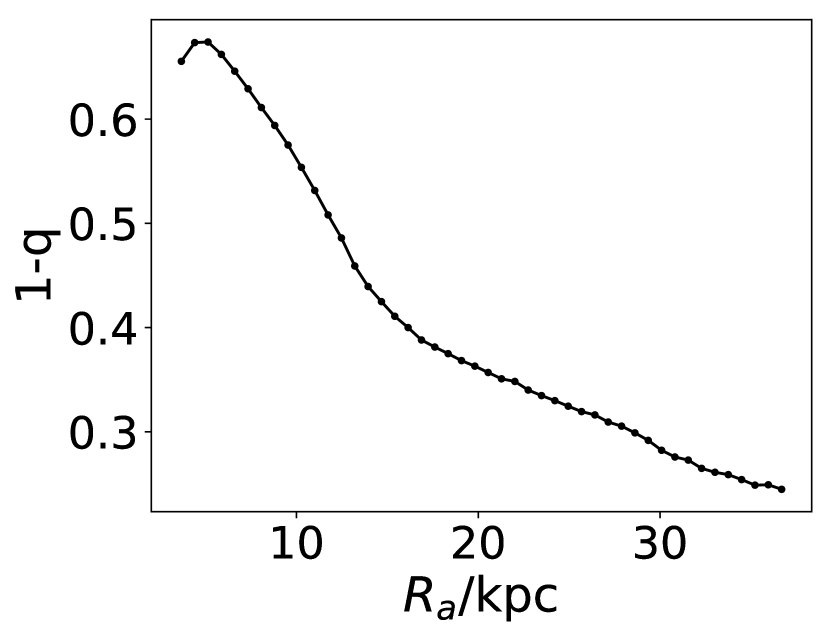
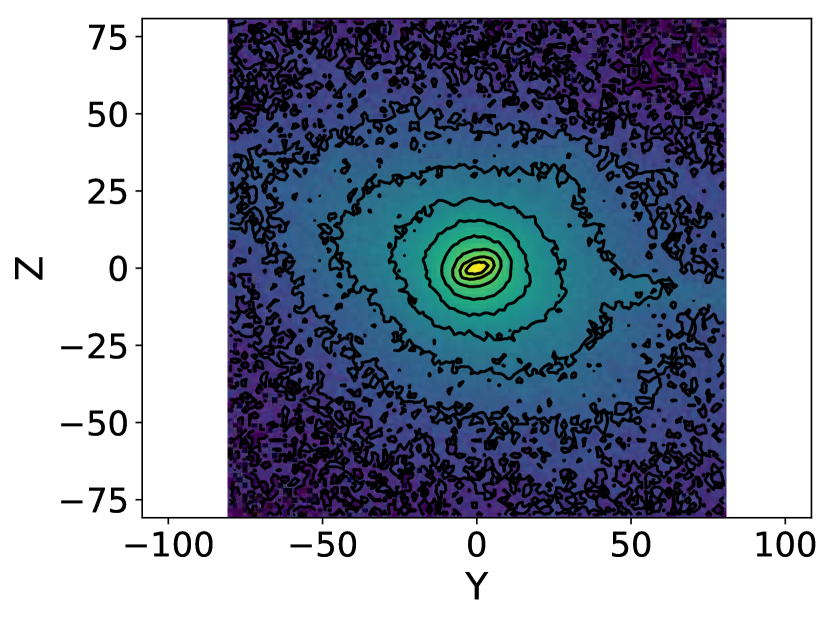
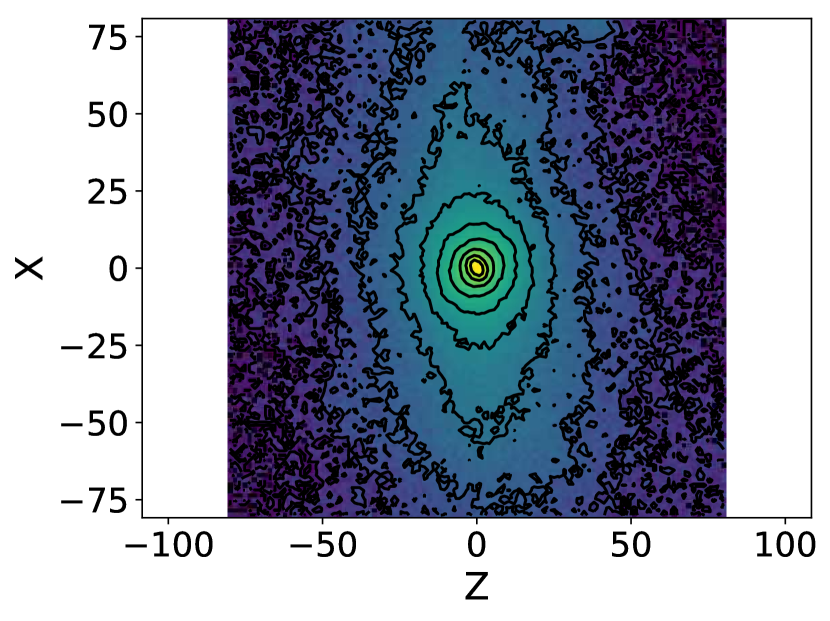
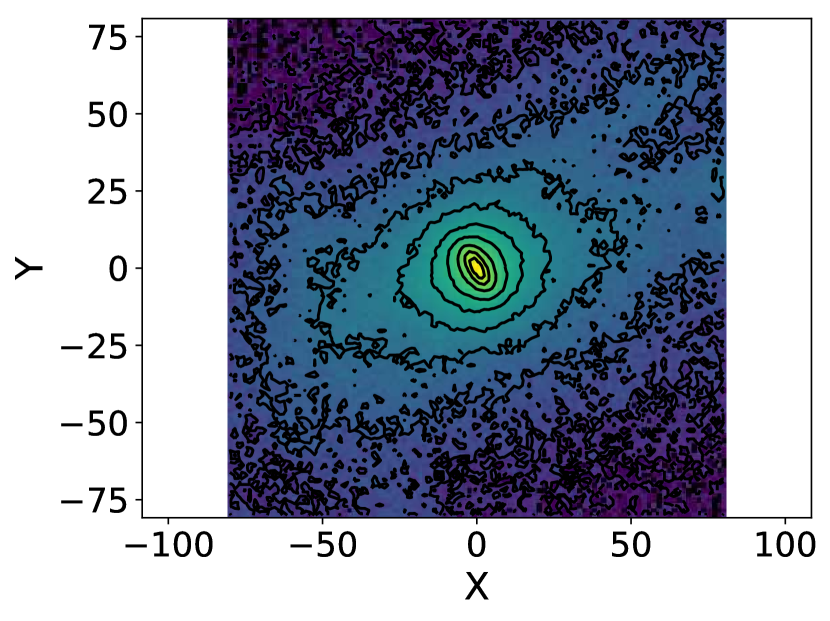
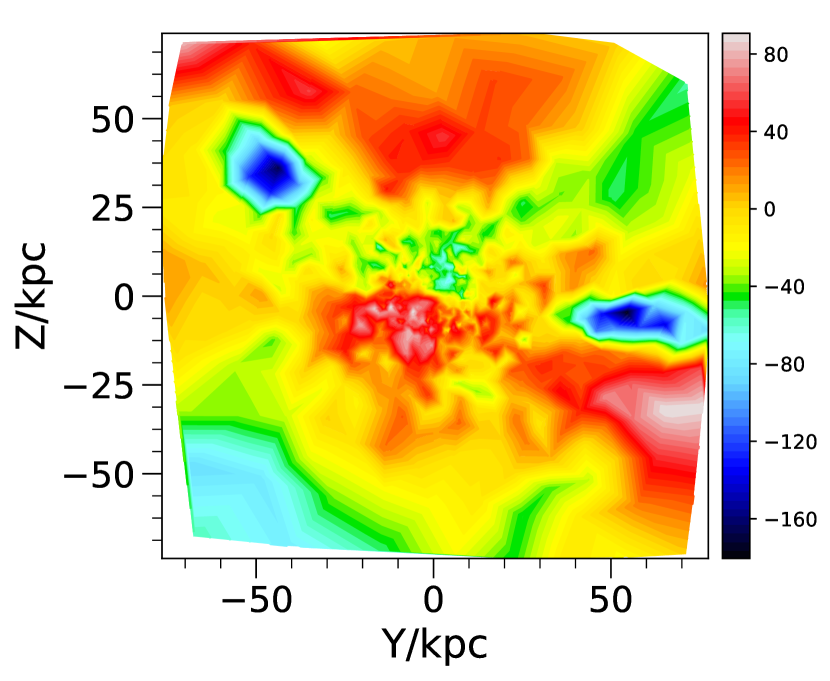
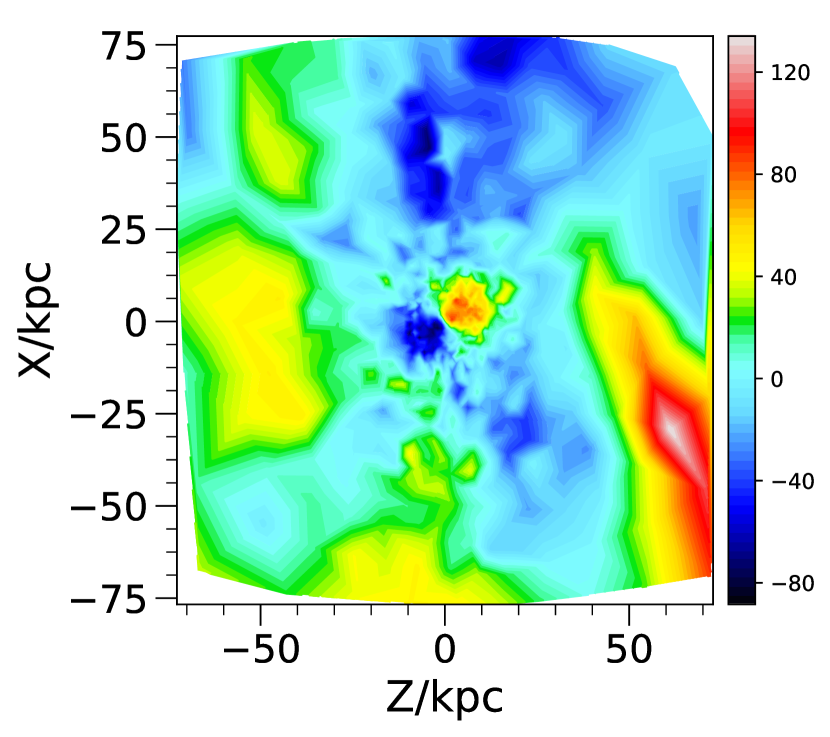
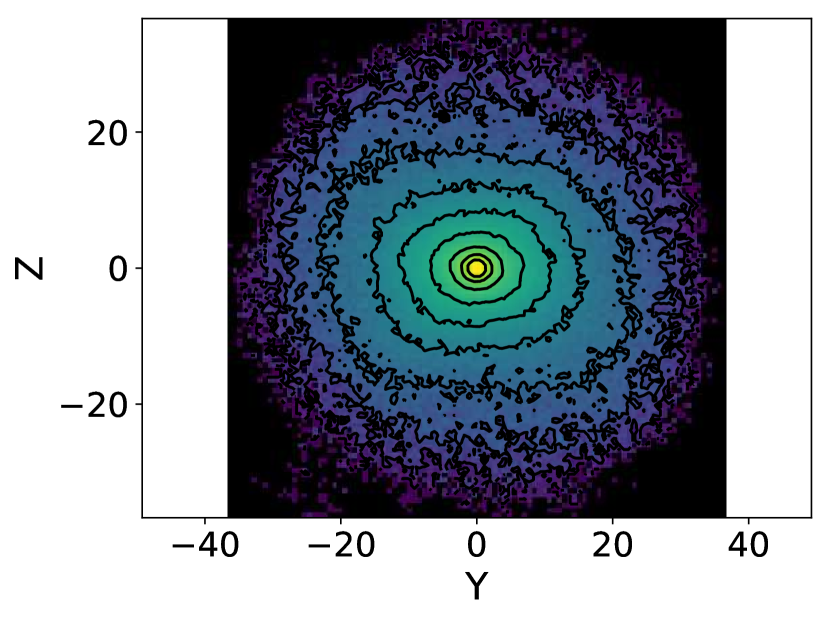
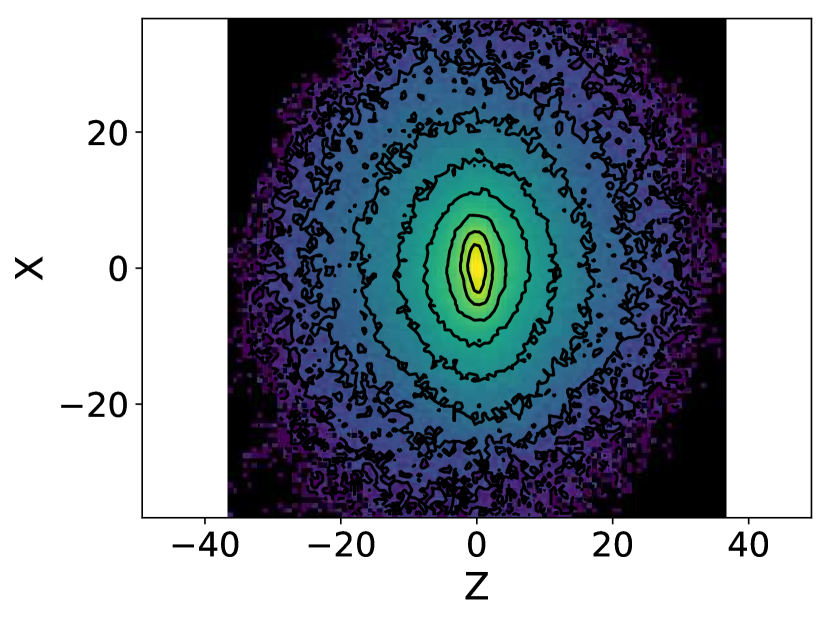
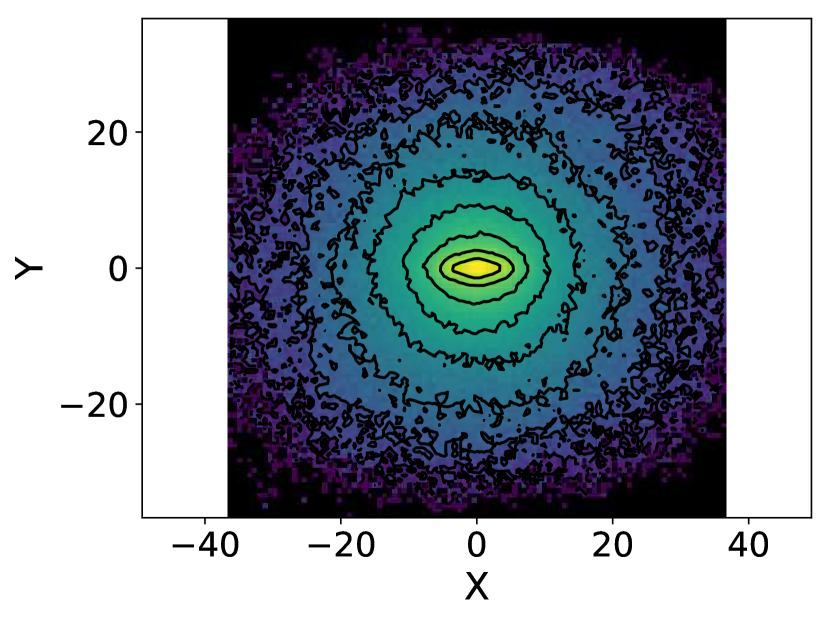
Subhalo #104799 at snapshot 135 is a galaxy with both large and values, calculated within an ellipsoid of major axis . The curves of the kinematical parameters versus the semi-major axes of the ellipsoids for this galaxy are plotted in Figure 16, with the lengths of the semi-major axes ranging from 0.5 to 5 times the half stellar mass radius (16.2 kpc). The stellar density profiles and velocity fields for the principal projections of this galaxy, where the principal axes along which we project the galaxy are obtained by the iterative ellipsoid method with , are also plotted in Figure 17.
It is clearly visible from the lower middle and lower right panels of Figure 17 that subhalo #104799 has a kinematically distinct core with a radius slightly smaller than 20 kpc, which rotates far faster than the outer parts. From the curve on the upper right panel of Figure 16, it can be seen that for small radius the angle is very small, indicating that the rotation axis for the kinematically distinct core is actually aligned with the minor axis of the core. This is also visible from the density profiles and the velocity fields. In contrast, the kinematics outside the core is much more complicated, showing complex patterns of velocity distributions.
Not only the velocity fields, but also the density distributions show differences between the core and the outer part. Note that in all the 3 principal projections, there are dramatic changes of shapes and orientations of the density profiles from the inner to the outer part of the galaxy within a range of about 30 kpc from the galactic center, while outside this range the density profiles are largely of the same shape and orientation with each other. This explains the turning points of the radial dependence curves of and given in the lower panels of Figure 16. The kinematical parameters keep varying with when because the ellipsoids calculated by iteration take into account not only the boundary but also the inside, which therefore change slower and smoother than the density profiles.
Therefore, in some senses the kinematical quantities that we analyse are not really well-defined globally. For example, note that in the -projection shown on the upper right panel of Figure 17, the ellipsoid with principal axes calculated by the iterative method with a semi-major axis is actually a poor description of the system within since there are dramatic changes of the shape and orientation of the density profiles inside. The rotation within this ellipsoid is also very complicated due to the kinematically distinct core. These are probably due to the system not being in full equilibrium, which can also be inferred from the distortions of the outer density profiles of the -projection shown in the upper left panel of Figure 17. The statement that there should be no rotation around the medium axis, therefore, likely does not apply in such a complicated system. In our analysis, we find that most of the galaxies where both and angles are very large show such signs of kinematically distinct cores, complex patterns of velocity distributions and distortions in density profiles, indicating non-equilibrium states. Therefore, this is probably one of the main reasons why we see here an inconsistency of the distribution of with the theoretical expectations.
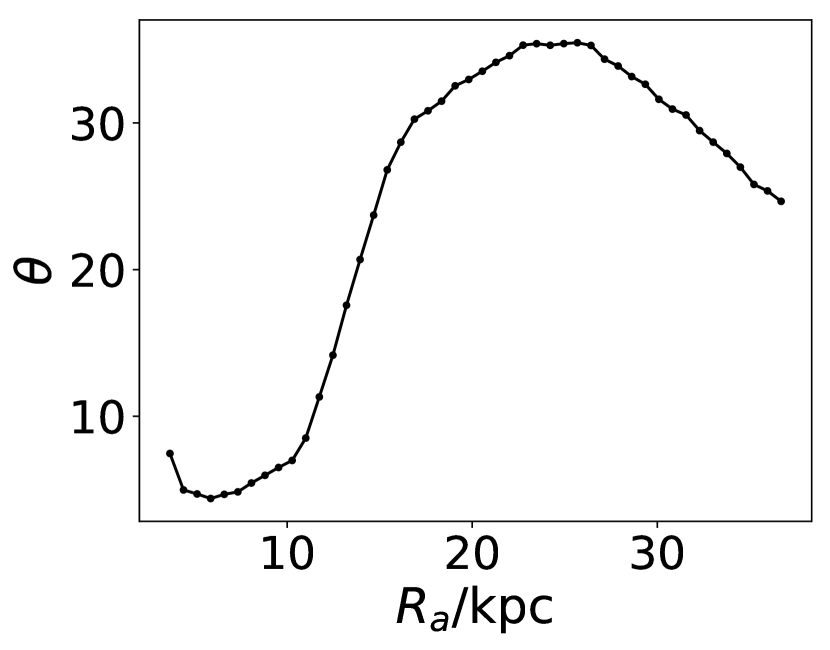
B.2 Subhalo #80737: Nearly Prolate in the Inner Part
There are also several other galaxies that show rotation around the medium axis () axis but without strong misalignment between different density profiles. All of them show some sign of prolateness, with medium and minor axes almost of the same lengths, causing the difference in the stability of orbits around them to be also very small, and thus possibly leading to rotation around the medium axis. An example is subhalo #80737 at snapshot 135, whose radial dependence curves and principal projections are given in Figures 16 and 18, respectively. It can be seen that the orientations of the profiles only change slightly throughout the galaxy. Note that within a distance of about 10 kpc from the galactic center, which is about twice its half stellar mass radius ( for this galaxy), the triaxiality is close to 1, meaning that the system is nearly prolate. This is very likely the reason why the velocity fields of the principal projection, given in the lower panels of Figure 18, show strong rotation around the axis.