2019/04/17 \Accepted2019/06/06
Stars; formation - ISM; molecules - Stars; individual (S235)
NH3 Observations of the S235 Star Forming Region: Dense Gas in Inter-core Bridges
Abstract
Star formation is thought to be driven by two groups of mechanisms; spontaneous collapse and triggered collapse. Triggered star formation mechanisms further diverge into cloud-cloud collision (CCC), “collect and collapse” (C&C) and shock induced collapse of pre-existing, gravitationally stable cores, or ‘radiation driven implosion’ (RDI). To evaluate the contributions of these mechanisms and establish whether these processes can occur together within the same star forming region we performed mapping observations of radio frequency ammonia, and water maser emission lines in the S235 massive star forming region. Via spectral analyses of main, hyperfine and multi-transitional ammonia lines we explored the distribution of temperature and column density in the dense gas in the S235 and S235AB star forming region. The most remarkable result of the mapping observations is the discovery of high density gas in inter-core bridges which physically link dense molecular cores that house young proto-stellar clusters. The presence of dense gas implies the potential for future star formation within the system of cores and gas bridges. Cluster formation implies collapse and the continuous physical links, also seen in re-imaged archival CS and 13CO maps, suggests a common origin to the molecular cores housing these clusters, i.e the structure condensed from a single, larger parent cloud, brought about by the influence of a local expanding H region. An ammonia absorption feature co-locating with the center of the extended H region may be attributed to an older gas component left over from the period prior to formation of the H region. Our observations also detail known and new sites of water maser emission, highlighting regions of active ongoing star formation.
1 Introduction
The existence of Galactic-scale star formation relations such as the Kennicut-Schmidt law (Schmidt, 1959; Kennicutt, 1998) implies continuity in star formation activity at all scales; from individual (proto-)stars ( pc), local star forming region (SFR)-scale ( pc), and Galactic-scale star formation ( pc); see, for example Nguyen-Luong et al. (2016). At an intermediate between the Galactic and (proto-)star scales, investigations on the scale of individual SFRs are therefore required for completeness; to link our knowledge of star formation across all scales.
At SFR scales, star formation is thought to be driven by two groups of mechanisms; spontaneous collapse and triggered collapse (Elmegreen and Lada, 1977; Elmegreen, 1998). Spontaneous collapse being the case when a super-critical density gas cloud is allowed to contract gravitationally, relatively undisturbed, while triggered collapse pertains to an external influence which encourages collapse by compressing sub-critical gas beyond critical density. Triggered star formation mechanisms further diverge into “collect and collapse” (C&C) (Elmegreen and Lada, 1977), shock induced collapse of pre-existing, gravitationally stable cores, or ‘radiation driven implosion’ (RDI) (Sandford et al., 1982) and large scale cloud-cloud collisions (CCCs) capable of generating the widespread over-densities required to drive sequential star formation (Habe and Ohta, 1992; Haworth et al., 2015b, a; Torii et al., 2017; Haworth et al., 2018).
The Ammonia molecule has long been recognised as a sensitive thermometer and densitiometer for probing the interstellar medium (Ho and Townes, 1983; Walmsley, 1994). It has been used extensively to probe the physical conditions in various stages of star formation including pre-stellar cores (Ruoskanen et al., 2011), active star formation cores (Harju et al., 1991; Kirsanova et al., 2014; Ladeyschikov et al., 2016), filementary structures (Wu et al., 2018) and large scale star formation surveys (Friesen et al., 2017).
Several recent works by our group have used ammonia mapping observations to look for evidence of spontaneous and triggered star formation (Toujima et al., 2011; Chibueze et al., 2013; Nakano et al., 2017), with the goal of uncovering which mechanism is dominant and whether these processes can occur together within the same star forming region. As a continuation of this project, we conducted radio frequency ammonia transition mapping observations of the S235 “main” and S235AB (collectively termed ‘S235’ hereafter) star forming region with the goal of mapping the physical conditions of molecular gas.
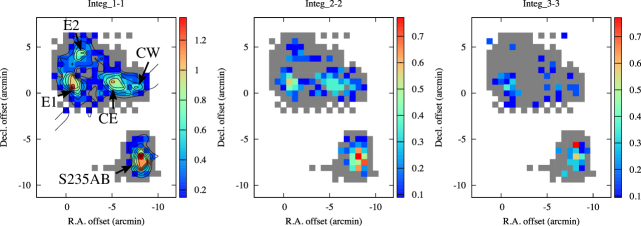
S235 is the most active region of star formation of the G174+2.5 giant molecular cloud. It houses multiple dense gas cores which have been extensively studied using NH3, CS and 13CO molecular lines (Kirsanova et al., 2008, 2014). However, previous NH3 maps of S235 were exclusive to the well-known dense cores and did not sample the regions between and around the cores. More complete observations were made by Dewangan and Ojha (2017) using CO and its isotopologues, thus tracing he widespread diffuse gas. Regarding continuum emission, S235 is home to a circular H region driven by ionizing radiation from an O9.5 V star, (BD +35∘1201) (Georgelin et al., 1973), at the center of the H region. Dewangan and Anandarao (2011) report that stellar densities of YSOs in S235 concentrate in the four molecular cores which are referred to as East1, East2, Central-West and Central-East in Kirsanova et al. (2008, 2014). In this work we adopt their notation and use short-hands E1, E2, CW and CE, respectively. Kirsanova et al. (2008, 2014) suggest that the molecular cores may have formed via the C&C mechanism through interaction with the H region. More recently, work by Dewangan et al. (2016) have added support to this picture by showing with high confidence that star formation in S235 is driven by interaction with the expanding H, as is the conclusion of their thorough multi-wavelength investigation. Dewangan and Ojha (2017) further revealed evidence of a past CCC event which likely initiated the subsequent star formation observed today.
Further to the south, the S235AB region is home to a younger H region, S235A, and very intense star formation indicated by high concentrations of YSOs (Dewangan and Anandarao, 2011). Maser activity in this region also points to the presence of very young massive star formation (Felli et al., 2007; Burns et al., 2015), and enabled the distance to S235 to be established as kpc, via maser parallax (Burns et al., 2015). The combined presence of molecular cores, H regions and star formation at various evolutionary stages makes S235 an ideal region to investigate various scenarios pertaining to spontaneous and triggered star formation.
2 Observations and archival data
Observations of S235 were carried out between December 2013 and June 2014 using the Nobeyama 45-m radio telescope, operated by the Nobeyama Radio Observatory (NRO), a branch of the National Astronomical Observatory of Japan (NAOJ). The telescope was operated in single side-band mode with frequency windows centered at the rest frequencies of NH3 inversion transitions (J,K) = (1,1), (2,2) and (3,3) at 22.6914, 23.722 and 23.870 GHz, respectively, and the H2O maser transition at 22.235 GHz. All frequency bands were observed simultaneously with dual linear polarisations and autocorrelated with a 0.38 km s-1 velocity channel spacing. The FWHM beamsize was 75” and pointing was checked every 1 2 hours and deviations were kept below 5”.
Mapping observations were conducted in position switching mode (ON-OFF) using map grid spacings of 37.5”. Sky subtraction was achieved by observing a region with no emission. Repeated integrations of 20 seconds were made at each point, with 3 ON points for every OFF point. varied between K for all observing runs, thus scans were integrated until an rms noise level of 0.04 K was reached for each mosaic point. This provided an overall consistency in map noise irrespective of the changing . Maps were created sequentially, beginning at the coordinates of the dense gas cores described in the literature (E1, E2, Central, AB) and extending outwards from those cores until no emission is detected. It is possible that ammonia emission existing between the S235 complex and S235AB was missed. Confirmation should be made by further observations. The total observing time required to produce the final maps of the S235 and S235AB regions was 120 hours.
Data reduction was performed using the NEWSTAR software, which has been developed and maintained by NRO. Baseline subtraction was performed individually for all scans, frequency bands and polarisations, after which polarisations were combined to Stokes . Fitting and analyses of the molecular inversion spectrum of ammonia were carried out with gnuplot routines which paramaterised the main line and satellite line profiles. Non-detections (grey squares in the emission maps) were recorded lacking a 2 detection.
3 Results
3.1 Ammonia: Emission maps
Maps of the ammonia (1,1), (2,2) and (3,3) emission in S235 are shown in Figure 1 where the reference coordinate (0,0) corresponds to , +35∘48’27”). Ammonia from the (1,1) transition was detected in our observations at all cores, the regions between the cores, and in S235AB. Emission from the (2,2) transition was seen in the 4 cores and S235AB but was rarely detected in the inter-core regions. Emission from the (3,3) transition was primarily detected in East 1 and S235AB.
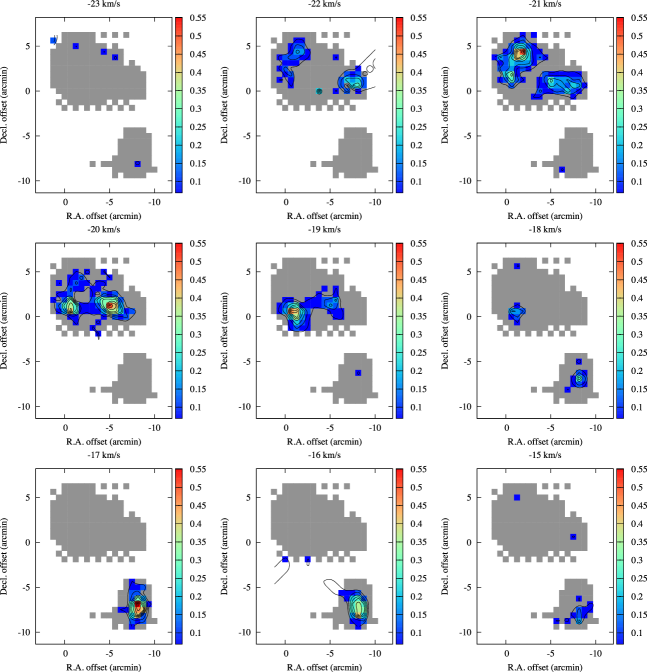
Channel maps of integer increment are shown in Figure 2. Core and inter-core gasses are continuous in velocity with emission velocities ranging from -15 to -21 km s-1 (Figure 3). Thus the majority of emission is seen to be blueshifted with respect to the ambient molecular cloud at -17 km s-1 (Heyer et al., 1996). Velocity widths of the ammonia spectra are in the range of 1 to 3 km s-1.
3.2 Deriving physical parameters of molecular gas
To derive the physical conditions of the ammonia gas in our mapped regions we first calculate the optical depth, , using the ratio of integrated main and satellite line temperatures:
| (1) |
Where is the natural intensity ratio of the satellite to main lines. We then calculate the rotation temperature of the gas, , using:
| (2) |
The column density of gas emitting at the (J,K) transition, , is calculated by:
| (3) |
Where in this case is dimensionless constant corresponding to for , respectively. Finally, the total NH3 column density, , is calculated assuming local thermodynamic equilibrium, using:
| (4) |
Where is the rotational degeneracy, is the nuclear spin degeneracy, and is the K-degeneracy.
| Name | |||||
|---|---|---|---|---|---|
| [K] | [km s-1] | [cm-2] | |||
| East 1 | |||||
| East 2 | |||||
| Central E | |||||
| Central W | |||||
| S235AB |
3.3 Ammonia: Mapping the physical conditions of molecular gas in S235
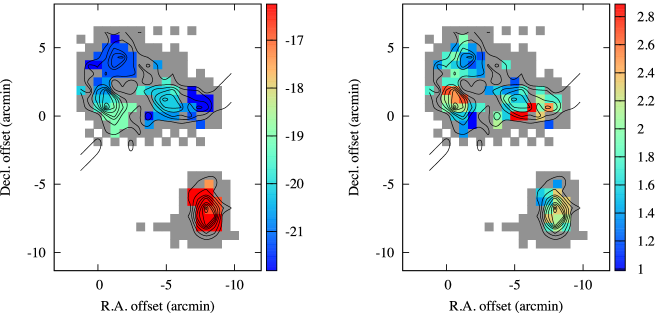
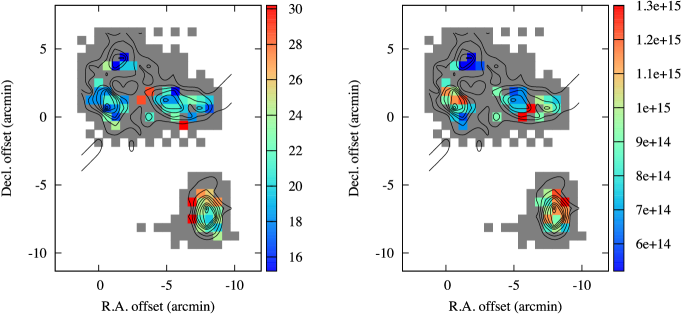
Based on the relations described in Section 3.2 we estimated the physical conditions of ammonia gas at each point in the grid. Since only a few map positions had sufficiently bright satellite emission for deriving the gas opacity we adopt the average value of for each core for the subsequent calculations of and at each map point in S235 and S235AB. Maps of these parameters are shown in Figure 4.
We then evaluated further physical parameters (gas opacity, ; rotational temperature, ; velocity width, ; Total gas column density, ; and core mass, ) associated with cores E1, E2, CW, CE and S235AB. For this step we employed an ammonia abundance ratio of , following Millar et al. (1997). Physical parameters for cores were reached by integrating over their angular area, based on their sizes given in Kirsanova et al. (2014). These are reported in Table 1.
3.4 CS and 13CO: Re-imaging archival maps
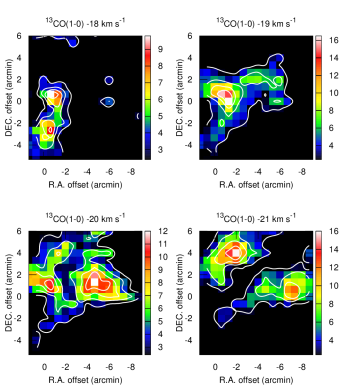
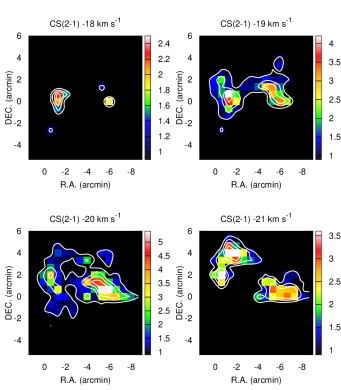
In order to compare the results of our ammonia mapping observations with the distributions of gasses at other densities, we revisited the CS and 13CO data of Kirsanova et al. (2008). The maps, made with the Onsala 20-m telescope, have FWHM beamsizes of 34′′ and 38 ′′ for the CS and 13CO data, respectively, producing maps of almost equal angular resolution as the ammonia grid spacings taken at Nobeyama. The reader may refer to the aforementioned publication for further details of the observations. Channel maps were produced at integer velocity intervals, these are shown in Figures 5 and 6.
3.5 Inter-core gas bridges: physical parameters
From Figure 1 it is apparent that an extended gas component of ammonia was detected in the regions outside of the main cores apparently forming a network of inter-core bridges. Withholding a deeper discussion of these gas bridges for Section 4, in this section we derive the physical parameters of gas belonging to this component.
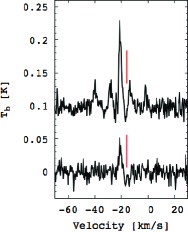
Ammonia emission from the ‘inter-core’ gas were too weak to analyse on a point-by-point basis. We therefore integrated signals from all pointings considered to be inter-core gas by the definition of being outside the derived core radii listed in Table 1. Since inter-core gas exhibits little to no star formation activity, no large velocity widths or gradients, such an integration can be considered reliable. Integrated spectra of the ammonia (1,1) and (2,2) from inter-core gas are shown in Figure 7.
Repeating the spectral analyses outlined in Section 3 we derived the physical properties of the inter-core gas in S235. For this gas component we estimated an optical depth of , rotation temperature of T K, and a total gas column density of N cm-2. Assuming that the gas bridges are of equal depth as their width (0.4 pc) the density of gas in the gas bridges would be cm-3.
Filamentary clouds become unstable when the line mass per unit length exceeds the critical line mass, i.e. (see Inutsuka and Miyama (1997) and, for example, Ryabukhina et al. (2018)). The parameters above imply a line mass of . The critical line mass depends only on gas temperature and mean molecular mass (eq. 60 of Ostriker (1964)) thus the 18 K gas bridges have . Consequently, in the absence of support, the gas bridges would be gravitationally unstable.
3.6 A low velocity gas component seen in absorption
Another interesting feature in the ammonia data became apparent from Figure 7; the integrated ammonia spectra produced from the combined inter-core pointings exhibits a tentative absorption signature at the velocity marked by the red line - prompting deeper investigation of ammonia gas near the H continuum peak. To clarify the case of the suspected absorption signature we integrated ammonia spectra from a pointing region which is spatially consistent with the H region to increase the signal to noise ratio of the spectrum. The selected regions are indicated by the red rectangle locus in Figure 8-left. The resulting spectra are shown in Figure 8-right for the ammonia (1,1) and (2,2) gas.
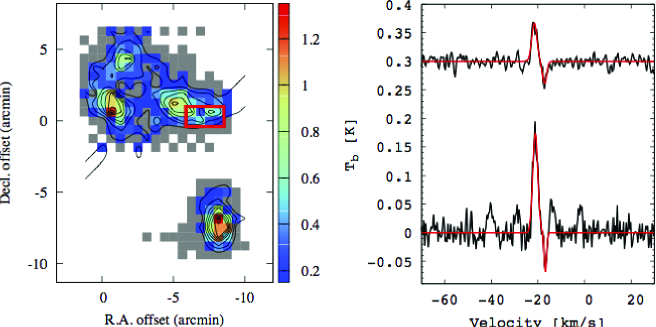
The integrated spectra show a clear absorption signature in both the (1,1) and (2,2) gas, no absorption was seen in the (3,3) transition. To test whether this could be an artifact caused by the presence of weak ammonia emission in the reference OFF-point, we integrated spectra from the S235AB region which is not associated with an extended HII region. A contaminated OFF-point would effect all map points in our observations (both S235 and S235AB) equally, however no such absorption signature was found in the integrated S235AB spectrum, supporting the authenticity of the ammonia absorption near the S235 H region.
From the integrated spectrum we derive a brightness, peak velocity, and velocity half width at half maximum of K, km s-1 and km s-1 in emission, and K, km s-1 and km s-1 for the absorbing gas. The two gas components are sufficiently separated in velocity such that their spectral profiles do not interfere significantly.
Compared to individual points in the searched region, the absorption signature was enhanced when multiple pointings were integrated, indicating that the absorbing gas component has an extent that is larger than a single beamsize. As such, we rule out interpretations that invoke compact sources of localised absorption of foreground gas on a background of line emission (such as a P-Cygni profile) instead, an interpretation involving two distinct ammonia gas components is preferred; one at km s-1, seen in absorption, and one at km s-1, seen in emission. A similar scenario with more clearly defined spectra is shown in (Wilson et al., 1978) who also reach an interpretation of multiple extended gas components. The production of either an emission or an absorption line signature must come from differences in the properties of the gas components themselves, i.e: . Here, Tcont is the continuum brightness temperature and Tline is the brightness temperature of molecular line emission whose velocity is indicated in subscript parentheses.
The brightness temperature of the continuum emission cannot be obtained directly from our data since all spectra required spectral baseline fitting during the data reduction stage. As such we must estimate based on observations reported in the literature. First, we estimate the optical depth of the continuum emission at the frequency of our ammonia observations via . Where is the electron temperature, typically taken as 10,000 K for H regions, is set to the ammonia (1,1) transition frequency, 22.6914 GHz, and is the emission measure. The brightness temperature of the continuum emission can then be estimated using .
Israel and Felli (1978) measure an emission measure of S235 to be pc cm-6 by observations at 1415 MHz with the Westerbork interferometer. On the other hand, Silverglate and Terzian (1978) calculated pc cm-6 at 2371 MHz using the 305 m telescope at Arecibo. Employing values from Isreal et al. and Silverglate & Terzian., respectively, we estimate a range of brightnesses of T and K for the continuum emission in S235; the intermediate brightness temperature of the continuum emission is capable of explaining the detection of both emission and absorption of ammonia in S235 for the (1,1) transition.
The brightness temperatures of the (2,2) transition lines were T K in emission and T K in absorption. Repeating the continuum brightness calculations at the frequency of the (2,2) emission, 23.722 GHz, gives a range of to K. Although the range of values of Tcont is consistent with being able to explain the emission and absorption in the (2,2) emission, the weaker ammonia (2,2) emission makes the claim less certain.
Another, more direct conclusion drawn from the presence of an absorption spectrum is that the km s-1 component must be in the foreground. Since the present literature finds consensus regarding the blueshifted emission to be foreground gas, we can confirm the red shifted gas to be a second foreground gas component in S235.
3.7 H2O maser emission: Signposts of star formation
In our observations, water maser emission was detected in E1 and S235AB. No previous records of water maser detections exist for E1, therefore these represent newly detected maser features. Emission spectra are shown in Figure 9, where a conversion of 2.7 Jy/K for the Nobeyama telescope has been applied.

The new maser at in E1 (Figure 9, lower) was brightest at map grid , +35∘50’19.5”). One 2.6 Jy emission peak was detected at a velocity of km s-1, which is consistent with the velocity of the E1 core ammonia gas. At least two more maser velocity components were found at -37.3 and -41.0 km s-1 which are blueshifted with respect to the core gas, having fluxes of 1.0 and 4.7 Jy, respectively. This maser is situated near the most luminous of embedded YSOs in E1 which were identified in the Spitzer SEDs of Dewangan and Anandarao (2011). Furthermore, the emission spectrum is that of a dominant blue-shift maser (DBSM). Such maser sources are thought to be associated with jets (Caswell and Phillips, 2008; Motogi et al., 2013, 2015; Burns et al., 2015), indicating active star formation.
Maser emission was also detected in the S235AB region (Figure 9, upper). The maser in S235AB is also a DBSM source with velocity components near 0, , and to km s-1. These maser velocity components were previously catalogued as part of the Medicina patrol discussed in Felli et al. (2007). Water masers in S235AB are known to be associated with massive star formation in that region and are discussed in the context of multi-epoch VLBI observations in Burns et al. (2015).
4 Discussion
4.1 Ammonia emission and absorption: young and old gas components in S235
The absorption signature discussed in Section 3.6 suggests the presence of two velocity components of molecular gas; that seen in emission at -21 km s-1 and that seen in absorption at -17 km s-1. Since the differences in emission/absorption come from the physical properties of the gas we can infer that the -17 km s-1 component has a lower excitation temperature than the -21 km s-1 component. The large-scale molecular gas cloud in which S235 is embedded has a velocity of -16 km s-1 (Heyer et al., 1996; Kirsanova et al., 2008). In agreement with the conclusions of Kirsanova et al. (2014), we speculate that the -17 km s-1 absorbing gas component represents the remnants of the progenitor cloud, existing prior to- and yet uninfluenced by the formation of the H region - hence its low brightness temperature, opacity and density. On the other hand, the relatively enhanced -21 km s-1 component, seen in emission, traces gas that is being heated by interaction with the H region.
Using 12CO and 13CO line data, Dewangan and Ojha (2017) investigated the molecular boundaries of two clouds associated with the S235 and S235ABC regions, where two velocity components were traced. The region of ammonia absorption co-locates with one intersect of the two CO clouds of Dewangan and Ojha (2017) (see their Figures 5 and 6). They also reported active star formation toward these boundaries. The evidence suggests that the two gas components seen in ammonia may have been involved in a previous CCC event.
4.2 Star formation activity traced by water maser emission
Our observations detected two sites of water maser emission, one of which being a new detection. Water masers indicate that E1 and S235AB are active sites of star formation. This is not surprising since these cores have been discussed extensively in the context of their star formation activity in several previous publications (Kirsanova et al., 2008, 2014; Dewangan and Anandarao, 2011; Dewangan et al., 2016). The maser detections are consistent with the view that both cores are relatively young members of the complex, and open the opportunity to perform further high resolution VLBI studies of the star formation activity in E1.
4.3 Ammonia gas bridges as remnants of induced fragmentation
The induction of recent star formation in S235 via the influence of the expanding H region has been explored and supported by several previous works (Kirsanova et al., 2008; Dewangan et al., 2016; Bieging et al., 2016). To supplement these previous works without repeating them we concentrate our discussion on the inter-core gas discovered in our observations to discuss what appear to be gas remnants of triggered fragmentation.
Inter-core gas bridges were reported in Salii et al. (2002), and were first seen in the S235 star forming region in Dewangan and Ojha (2017) who report a broad bridge feature of CO gas. Such features (seen in PV) can be produced via the CCC process REF. Dewangan and Ojha (2017) also discuss CCC as a possible formation scenario in the S235 and S235ABC complex.
While optically thin CO gas traces regions of high column density, ammonia emission has a higher critical density and thus traces high density gas. Our observations reveal the presence of dense molecular gas bridging the cluster-forming gas cores in S235. In the channel maps (Figure 2) gas bridges exhibit a typical width of 1.5 times the grid spacing, i.e. wide (0.4 pc at a distance of 1.56 kpc). The first moment map (Figure 3) reveals smooth velocity transitions between the cores indicating a continuous physical link between all 4 cores. The same structures can be seen in the 13CO and CS channel maps (Figures 5 and 6) re-imaged from Kirsanova et al. (2008), further supporting this view.
Low excitation ammonia (1,1) is detected in both cores and inter-core bridges, while (2,2) and (3,3) emission is more prominent in the cores. The presence of higher excitation ammonia in the cores indicates that the molecular gas has reached higher column densities and temperatures, suggestive of contraction and internal heating from the resulting star formation. The cold gas bridges seen in ammonia show no indication of star formation activity, as is supported by the lack of inter-core stellar density enhancements (Dewangan and Anandarao, 2011). This is reflected in our integrated spectral analyses in Section 3.5 which reveal that the inter-core bridges comprise of gas of lower temperature and column density than core gas.
Dust filaments bearing some resemblance to those discussed here are seen at smaller scales with a characteristic width of 0.1 pc - in which cores house individual protostars. The configuration, commonly described as ‘pearls on a string’, was initially seen in infrared data from the Herschel space telescope (Arzoumanian et al., 2011) and has since been recognised as a common feature of star formation. On the other hand, filaments of much larger scales have been found in other star forming regions such as NGC 6334 (Zernickel et al., 2013), and gas bridges of a similar scale to those in S235 connect multiple developed H regions in OMC-1 (Hacar et al., 2017) and the large filament observed in molecular gas in WB673 (Kirsanova et al., 2017). However the nature of the aforementioned filamentary systems differs markedly from those seen in S235, which instead connect clusters of YSOs rather than individual protostars, and have formed in the presence of-, and by interaction with- a single H region. Additionally, analysis of the dense gas physical parameters implies hyper-critical line masses, highlighting the potential for further star formation.
Our interpretation is that the quiescent physical gas bridges linking the cores are the remnants of a large scale fragmentation process in which the cluster-forming cores of S235 condensed out of a single parent molecular cloud. Further evidence of the existence of a natal gas component comes in the way of the absorption feature discussed above. Whether the fragmentation of the parent cloud was driven by CCC, C&C, or by RDI, should therefore be considered. Whitworth et al. (1994) showed that the swept-up gas layers of expanding nebulae, winds, and CCCs were likely to collapse, by gravitational instability, to form massive cores of gas. Furthermore, Walch et al. (2015) showed that C&C and RDI caused by an expanding H region are capable of producing a shell-like structure studded with cores. Their simulations produce a configuration of bridged gas cores similar to those seen in this work.
On the scale of the larger S235ABC complex, Dewangan and Ojha (2017) revealed evidence of CCC as a likely trigger of the subsequent star formation seen in this region. Dewangan et al. (2016) showed pressure from the expanding H region to be the dominant driver of gas dynamics in the S235 main, capable of explaining the formation of E2, CE and CW (see their Section 3.7), remarking that the youngest core, E1, may be better explained by RDI (a similar conclusion was also reached by Kirsanova et al. (2014)).
Considering our result in the context of these works we conclude that the ammonia gas bridges found in S235 likely represent the hyper-critical remnants of CCC-induced fragmentation of a gas cloud involving the C&C mechanism with likely contribution from the RDI process. Both processes contribute to the proliferation of triggered star formation, driven by the central H region of S235.
5 Conclusions
The main conclusions of this paper can be summarised as follows:
-
•
We performed position-switch mapping observations of the S235 and S235AB regions in ammonia (1,1), (2,2), (3,3) and the 22 GHz water maser transition using the Nobeyama 45m radio telescope.
-
•
Our observations determined the physical properties of molecular gas in the cores of this SFR, which agree with, and expand on, the previous works in the literature.
-
•
Focusing on the less-studied gas away from the cores, our observations uncovered the presence of gas bridges that link the cluster-forming cores in the S235 region. These bridges appear to be remnants of a fragmentation event which led to the formation of its present day cores from a larger parent cloud. This fragmentation was likely driven by impact of the extended HII region S235 to surrounding molecular cloud.
-
•
The presence of dense gas bridges was corroborated by CS and 18CO gas maps, re-imaged from Kirsanova et al. (2008).
-
•
Further relic gas was detected in absorption at the foreground of the radio continuum peak in S235 at a velocity consistent with the local diffuse molecular cloud. Thus there are two ammonia gas components in the S235 region: old quiescent gas of low brightness temperature (seen in absorption) and younger, more active star-forming gas which is seen to interact with the H region (seen in emission).
-
•
Our study detected strong water masers associated with star formation in S235AB and the E1 core of S235, the latter being a new maser detection.
RB is supported by the East Asia Core Observatory Association (EACOA) under the research fellowship program. MSK was partly supported by Russian Science Foundation, research project 18-72-10132. AMS was funded by Russian Foundation for Basic Research through research project 18-02-00917. DAL was supported by the Ministry of Education and Science (the basic part of the State assignment, RK no. AAAA-A17-117030310283-7). This work is partially supported by the Act 211 Government of the Russian Federation, agreement No. 02.A03.21.0006.
References
- Arzoumanian et al. (2011) Arzoumanian, D., André, P., Didelon, P., Könyves, V., Schneider, N., Men’shchikov, A., Sousbie, T., Zavagno, A., Bontemps, S., di Francesco, J., Griffin, M., Hennemann, M., Hill, T., Kirk, J., Martin, P., Minier, V., Molinari, S., Motte, F., Peretto, N., Pezzuto, S., Spinoglio, L., Ward-Thompson, D., White, G., and Wilson, C. D. (2011). Characterizing interstellar filaments with Herschel in IC 5146. A&A, 529, L6.
- Bieging et al. (2016) Bieging, J. H., Patel, S., Peters, W. L., Toth, L. V., Marton, G., and Zahorecz, S. (2016). The Arizona Radio Observatory CO Mapping Survey of Galactic Molecular Clouds. V. The Sh2-235 Cloud in CO J=2-1, 13CO J=2-1, and CO J=3-2. ApJS, 226, 13.
- Burns et al. (2015) Burns, R. A., Imai, H., Handa, T., Omodaka, T., Nakagawa, A., Nagayama, T., and Ueno, Y. (2015). A ‘water spout’ maser jet in S235AB-MIR. MNRAS, 453, 3163–3173.
- Caswell and Phillips (2008) Caswell, J. L. and Phillips, C. J. (2008). Water maser 353.273+0.641, the prime example of a class dominated by a blueshifted outflow. MNRAS, 386, 1521–1526.
- Chibueze et al. (2013) Chibueze, J. O., Imura, K., Omodaka, T., Handa, T., Nagayama, T., Fujisawa, K., Sunada, K., Nakano, M., Kamezaki, T., Yamaguchi, Y., and Sekido, M. (2013). Star Formation in the Molecular Cloud Associated with the Monkey Head Nebula: Sequential or Spontaneous? ApJ, 762, 17.
- Dewangan and Anandarao (2011) Dewangan, L. K. and Anandarao, B. G. (2011). Infrared photometric study of the massive star-forming region S235 using Spitzer-Infrared Array Camera and JHK observations. MNRAS, 414, 1526–1544.
- Dewangan and Ojha (2017) Dewangan, L. K. and Ojha, D. K. (2017). Observational Signatures of Cloud-Cloud Collision in the Extended Star-forming Region S235. ApJ, 849, 65.
- Dewangan et al. (2016) Dewangan, L. K., Ojha, D. K., Luna, A., Anandarao, B. G., Ninan, J. P., Mallick, K. K., and Mayya, Y. D. (2016). A Multi-wavelength Study of Star Formation Activity in the S235 Complex. ApJ, 819, 66.
- Elmegreen (1998) Elmegreen, B. G. (1998). Observations and Theory of Dynamical Triggers for Star Formation. In C. E. Woodward, J. M. Shull, and H. A. Thronson, Jr., editors, Origins, volume 148 of Astronomical Society of the Pacific Conference Series, page 150.
- Elmegreen and Lada (1977) Elmegreen, B. G. and Lada, C. J. (1977). Sequential formation of subgroups in OB associations. ApJ, 214, 725–741.
- Felli et al. (2007) Felli, M., Brand, J., Cesaroni, R., Codella, C., Comoretto, G., Di Franco, S., Massi, F., Moscadelli, L., Nesti, R., Olmi, L., Palagi, F., Panella, D., and Valdettaro, R. (2007). Water maser variability over 20 years in a large sample of star-forming regions: the complete database. A&A, 476, 373–664.
- Friesen et al. (2017) Friesen, R. K., Pineda, J. E., co-PIs, Rosolowsky, E., Alves, F., Chacón-Tanarro, A., How-Huan Chen, H., Chun-Yuan Chen, M., Di Francesco, J., Keown, J., Kirk, H., Punanova, A., Seo, Y., Shirley, Y., Ginsburg, A., Hall, C., Offner, S. S. R., Singh, A., Arce, H. G., Caselli, P., Goodman, A. A., Martin, P. G., Matzner, C., Myers, P. C., Redaelli, E., and GAS Collaboration (2017). The Green Bank Ammonia Survey: First Results of NH3 Mapping of the Gould Belt. ApJ, 843, 63.
- Georgelin et al. (1973) Georgelin, Y. M., Georgelin, Y. P., and Roux, S. (1973). Observations de nouvelles regions HII galactiques et d’etoiles excitatrices. A&A, 25, 337.
- Habe and Ohta (1992) Habe, A. and Ohta, K. (1992). Gravitational instability induced by a cloud-cloud collision - The case of head-on collisions between clouds with different sizes and densities. PASJ, 44, 203–226.
- Hacar et al. (2017) Hacar, A., Alves, J., Tafalla, M., and Goicoechea, J. R. (2017). Gravitational collapse of the OMC-1 region. A&A, 602, L2.
- Harju et al. (1991) Harju, J., Walmsley, C. M., and Wouterloot, J. G. A. (1991). Young ammonia clumps in the Orion molecular cloud. A&A, 245, 643–647.
- Haworth et al. (2015a) Haworth, T. J., Shima, K., Tasker, E. J., Fukui, Y., Torii, K., Dale, J. E., Takahira, K., and Habe, A. (2015a). Isolating signatures of major cloud-cloud collisions - II. The lifetimes of broad bridge features. MNRAS, 454, 1634–1643.
- Haworth et al. (2015b) Haworth, T. J., Tasker, E. J., Fukui, Y., Torii, K., Dale, J. E., Shima, K., Takahira, K., Habe, A., and Hasegawa, K. (2015b). Isolating signatures of major cloud-cloud collisions using position-velocity diagrams. MNRAS, 450, 10–20.
- Haworth et al. (2018) Haworth, T. J., Glover, S. C. O., Koepferl, C. M., Bisbas, T. G., and Dale, J. E. (2018). Synthetic observations of star formation and the interstellar medium. New A Rev., 82, 1–58.
- Heyer et al. (1996) Heyer, M. H., Carpenter, J. M., and Ladd, E. F. (1996). Giant Molecular Cloud Complexes with Optical H II Regions: 12CO and 13CO Observations and Global Cloud Properties. ApJ, 463, 630.
- Ho and Townes (1983) Ho, P. T. P. and Townes, C. H. (1983). Interstellar ammonia. ARA&A, 21, 239–270.
- Inutsuka and Miyama (1997) Inutsuka, S.-i. and Miyama, S. M. (1997). A Production Mechanism for Clusters of Dense Cores. ApJ, 480, 681–693.
- Israel and Felli (1978) Israel, F. P. and Felli, M. (1978). Aperture synthesis observations of galactic H II regions. VIII - S106 and S235: Regions of star formation. A&A, 63, 325–334.
- Kennicutt (1998) Kennicutt, Jr., R. C. (1998). The Global Schmidt Law in Star-forming Galaxies. ApJ, 498, 541–552.
- Kirsanova et al. (2008) Kirsanova, M. S., Sobolev, A. M., Thomasson, M., Wiebe, D. S., Johansson, L. E. B., and Seleznev, A. F. (2008). Star formation around the HII region Sh2-235. MNRAS, 388, 729–736.
- Kirsanova et al. (2014) Kirsanova, M. S., Wiebe, D. S., Sobolev, A. M., Henkel, C., and Tsivilev, A. P. (2014). Physical conditions in star-forming regions around S235. MNRAS, 437, 1593–1608.
- Kirsanova et al. (2017) Kirsanova, M. S., Salii, S. V., Sobolev, A. M., Olofsson, A. O. H., Ladeyschikov, D. A., and Thomasson, M. (2017). Molecular gas in high-mass filament WB673. Open Astronomy, 26, 99–105.
- Ladeyschikov et al. (2016) Ladeyschikov, D. A., Kirsanova, M. S., Tsivilev, A. P., and Sobolev, A. M. (2016). Molecular emission in dense massive clumps from the star-forming regions S231-S235. Astrophysical Bulletin, 71(2), 208–224.
- Millar et al. (1997) Millar, T. J., Farquhar, P. R. A., and Willacy, K. (1997). The UMIST Database for Astrochemistry 1995. A&AS, 121, 139–185.
- Motogi et al. (2013) Motogi, K., Sorai, K., Niinuma, K., Sugiyama, K., Honma, M., and Fujisawa, K. (2013). Intermittent maser flare around the high-mass young stellar object G353.273 + 0.641 - II. Detection of a radio and molecular jet. MNRAS, 428, 349–353.
- Motogi et al. (2015) Motogi, K., Sorai, K., Honma, M., Hirota, T., Hachisuka, K., Niinuma, K., Sugiyama, K., Yonekura, Y., and Fujisawa, K. (2015). Accelerating a water maser face-on jet from a high mass young stellar object. PASJ.
- Nakano et al. (2017) Nakano, M., Soejima, T., Chibueze, J. O., Nagayama, T., Omodaka, T., Handa, T., Sunada, K., Kamezaki, T., and Burns, R. A. (2017). Interaction between the H II region and AFGL 333-Ridge: Implications for the star formation scenario. PASJ, 69, 16.
- Nguyen-Luong et al. (2016) Nguyen-Luong, Q., Nguyen, H. V. V., Motte, F., Schneider, N., Fujii, M., Louvet, F., Hill, T., Sanhueza, P., Chibueze, J. O., and Didelon, P. (2016). The Scaling Relations and Star Formation Laws of Mini-starburst Complexes. ApJ, 833, 23.
- Ostriker (1964) Ostriker, J. (1964). The Equilibrium of Polytropic and Isothermal Cylinders. ApJ, 140, 1056.
- Ruoskanen et al. (2011) Ruoskanen, J., Harju, J., Juvela, M., Miettinen, O., Liljeström, A., Väisälä, M., Lunttila, T., and Kontinen, S. (2011). Mapping the prestellar core Ophiuchus D (L1696A) in ammonia. A&A, 534, A122.
- Ryabukhina et al. (2018) Ryabukhina, O. L., Zinchenko, I. I., Samal, M. R., Zemlyanukha, P. M., Ladeyschikov, D. A., Sobolev, A. M., Henkel, C., and Ojha, D. K. (2018). Study of the filamentary infrared dark cloud G192.76+00.10 in the S254-S258 OB complex. Research in Astronomy and Astrophysics, 18, 095.
- Salii et al. (2002) Salii, S. V., Sobolev, A. M., and Kalinina, N. D. (2002). Shock Tracers in the Molecular Cloud G1.6-0.025. Astronomy Reports, 46, 955–968.
- Sandford et al. (1982) Sandford, II, M. T., Whitaker, R. W., and Klein, R. I. (1982). Radiation-driven implosions in molecular clouds. ApJ, 260, 183–201.
- Schmidt (1959) Schmidt, M. (1959). The Rate of Star Formation. ApJ, 129, 243.
- Silverglate and Terzian (1978) Silverglate, P. R. and Terzian, Y. (1978). Carbon and hydrogen radio recombination lines from H II regions. ApJ, 224, 437–443.
- Torii et al. (2017) Torii, K., Hattori, Y., Hasegawa, K., Ohama, A., Haworth, T. J., Shima, K., Habe, A., Tachihara, K., Mizuno, N., Onishi, T., Mizuno, A., and Fukui, Y. (2017). Triggered O Star Formation in M20 via Cloud-Cloud Collision: Comparisons between High-resolution CO Observations and Simulations. ApJ, 835, 142.
- Toujima et al. (2011) Toujima, H., Nagayama, T., Omodaka, T., Handa, T., Koyama, Y., and Kobayashi, H. (2011). Propagation of Highly Efficient Star Formation in NGC 7000. PASJ, 63, 1259–1272.
- Walch et al. (2015) Walch, S., Whitworth, A. P., Bisbas, T. G., Hubber, D. A., and Wünsch, R. (2015). Comparing simulations of ionization triggered star formation and observations in RCW 120. MNRAS, 452, 2794–2803.
- Walmsley (1994) Walmsley, C. M. (1994). Ammonia in the Interstellar Medium. In I. Nenner, editor, Molecules and Grains in Space, volume 312 of American Institute of Physics Conference Series, page 463.
- Whitworth et al. (1994) Whitworth, A. P., Bhattal, A. S., Chapman, S. J., Disney, M. J., and Turner, J. A. (1994). The Preferential Formation of High-Mass Stars in Shocked Interstellar Gas Layers. MNRAS, 268, 291.
- Wilson et al. (1978) Wilson, T. L., Bieging, J., and Downes, D. (1978). Ammonia emission and absorption toward W3 /OH/. A&A, 63, 1–6.
- Wu et al. (2018) Wu, G., Qiu, K., Esimbek, J., Zheng, X., Henkel, C., Li, D., and Han, X. (2018). Extended ammonia observations towards the integral-shaped filament. A&A, 616, A111.
- Zernickel et al. (2013) Zernickel, A., Schilke, P., and Smith, R. J. (2013). The global velocity field of the filament in NGC 6334. A&A, 554, L2.