Planetesimals to Terrestrial Planets: collisional evolution amidst a dissipating gas disk
Abstract
We present numerical simulations of terrestrial planet formation that examine the growth continuously from planetesimals to planets in the inner Solar System. Previous studies show that the growth will be inside-out, but it is still common practice to assume that the entire inner disk will eventually reach a bi-modal distribution of embryos and planetesimals. For the combinations of disk mass, initial planetesimal radius and gas disk lifetime explored in this work the entire disk never reaches a simple bi-modal mass distribution.
We find that the inside-out growth is amplified by the combined effects of collisional evolution of solid bodies and interactions with a dissipating gas disk. This leads to oligarchic growth never being achieved in different places of the disk at the same time, where in some cases the disk can simultaneoulsy support chaotic growth and giant impacts inside 1 au and runaway growth beyond 2 au. The planetesimal population is efficiently depleted in the inner disk where embryo growth primarily advances in the presence of a significant gas disk. Further out in the disk growth is slower relative to the gas disk dissipation, resulting in more excited planetesimals at the same stage of growth and less efficient accretion. This same effect drives mass loss due to collisional grinding strongly altering the surface density of the accreted planets relative to the initial mass distribution. This effect decreases the Mars-to-Earth mass ratios compared to previous works with no collisional grinding. Similar to some previous findings utilizing vastly different growth scenarios these simulations produce a first generation of planetary embryos that are stable for 10-20 Myr, or 5-10 e-folding times of the gas dissipation timescale, before having an instability and entering the chaotic growth stage.
1 Introduction
A long-standing issue in models of terrestrial planet formation is the order of magnitude difference in mass between Earth and Mars. Most models aiming to track the final stages of planet formation start from an intermediate stage of growth, with similar-sized planetary embryos amidst a sea of planetesimals. These models regularly fail to recover the relatively small mass of Mars for the simple reason of the surplus of material at 1.5 au in most nominal surface density profiles - leading to Mars-analogs that are usually 5-10 times too massive (Chambers, 2001; Raymond et al., 2009; Fischer & Ciesla, 2014). Some works have been able to create small Mars-analogs, but require migrating planets or disk incontinuities to vastly deplete certain regions of the disk (Hansen, 2009; Walsh et al., 2011; Izidoro et al., 2014; Clement et al., 2018). Other models rely on the majority of the initial solid mass to remain in cm-sized “pebbles”, which can lead to a vastly different accretion mode (Levison et al., 2015; Morbidelli et al., 2015). However, a statistical simulation to this problem suggests that mass loss due to collisional fragmentation and drift can make planetary embryos that are a good match for Mars’ mass and accretion timescale, but only for relatively high disk masses and smaller initial planetesimals (Kobayashi & Dauphas, 2013).
Complete models of terrestrial planet growth from planetesimals are not yet fully explored, as the complicated interaction of collisional fragmentation and gas disk affects have not been exhaustively explored in numerical models spanning the entire growth from planetesimals to planets. Modeling the entirety of planet formation represents a dynamic range problem where a huge population of dust becomes very few planets, interactions between dust happens on very short timescales, and the final accretion of the planets takes 10’s of millions of years. These are the driving reasons that push the vast majority of studies to take a piece-wise or regional approach to the problem, and these efforts have produced a general picture of distinct stages of growth.
The first stage of growth following planetesimal formation is “runaway growth”. Owing to the effects of gravitational focusing, the largest planetesimals in a given local region grow at a faster rate than smaller neighbors, allowing them to runaway in mass relative to the others (Greenberg et al., 1978; Lissauer, 1987). This leads to a break in the size distribution that is secured once the largest bodies begins to stir the orbits of their smaller neighbors, increasing relative velocities and discouraging further growth among the population of small bodies. This transition into “oligarchic growth” occurs when the large bodies attain roughly half the total local mass (Kokubo & Ida, 1998, 2000; Chambers, 2006).
With growth slowed and mass partitioned evenly between 10–100 large bodies and numerous small bodies, the oligarchic growth stage serves as the typical starting point for numerical models of the full terrestrial planet region. This will continue until a final set of planets have been built by way of giant impacts during the “giant impact” or “chaotic growth” stage of growth where the embryos’ orbits eventually become crossing and giant embryo-embryo collisions occur due to the lack of damping from planetesimals or the gas disk (see Morbidelli et al., 2012). The expectation is that the spacing of the oligarchs, or embryos, is constant in terms of their mutual Hill Spheres but increasing with mass with further distance for typical surface density profiles. No simple prescription exists for the location and mass of the planetesimal population and it is typically assumed to follow the initial surface density profile (O’brien et al., 2006; Raymond et al., 2009).
While each of the stages of growth have been explored in detail, combining them into one model of planet formation relies on extrapolations from very regional simulations to establish conditions for global simulations. A key aspect to this extrapolation is to assume that oligarchic growth can be reached throughout all regions of the disk at the same time, which allows modelers to start modeling the final stage of growth from a disk of embryos amidst planetesimals. Since observed gas disk lifetimes (Haisch et al., 2001) are similar to estimates for planetary embryo growth timescales at 1 au (2-10 Myr) it is common to ignore many of the effects of the gaseous solar nebula, which can strongly affect the orbits of both the small and large bodies at oligarchic growth stage. Finally, collisional fragmentation is not typically modeled throughout as it is numerically challenging due to the possible rapid increase in the number of simulation particles if/when objects start fragmenting. This is an important omission as fragments can dynamically interact with large ones, changing orbits and accretion efficiency locally, or simply be lost due to rapid gas drag or at later times by Poynting Robertson drag (Kenyon & Bromley, 2006; Leinhardt et al., 2009; Chambers, 2013; Carter et al., 2015).
The aim for this work is to model the growth from planetesimals in the inner Solar System and to present simulation results that continue through the entire process to systems of planets. The modeling techniques will include the continuous growth from planetesimals to planets in the midst of the dissipation of the gaseous solar nebula and collisional evolution. The model extends through the stage of chaotic growth and giant impacts, and multiple simulations are performed for a range of initial conditions to provide a statistical comparison of the produced planetary systems.
1.1 Previous studies - planetesimals to planets
Previous studies have either focused on the early growth from planetesimals to embryos or on the latter stages from embryos to planets. One of the foundations of most analytical approaches is establishing the end point of the early stages of growth, before chaotic interactions between embryos should begin, as a function of disk properties. This end, and the produced suite of embryos or “oligarchs”, typically sets up the initial conditions for numerical models that are capable of modeling the more chaotic final stages of growth. Aspects of these works provide a solid foundation that should be re-created in any end-to-end modeling effort.
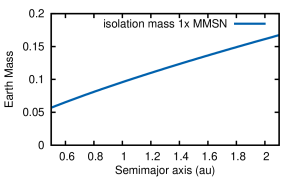
A near universally used concept is that the largest body at any distance should grow to a so-called Isolation Mass (), which is defined as the total mass per well-separated feeding zone (Lissauer, 1987; Kokubo & Ida, 1998, 2000; Kobayashi & Dauphas, 2013). This depends on the spacing of planetary embryos, but with the typically assumed 10 Hill sphere spacing (Kokubo & Ida, 1998) the isolation mass as a function of semimajor axis and mass of the disk can be easily determined:
,
where is the scaling of the classical Hayashi Minimum Mass Solar Nebula (7.1 g cm-2 surface density for solids and 1.7103 g cm-2 for gas at 1au) and is the semimajor axis of the growing embryo (Hayashi, 1981). This accounts only for accretion of local planetesimals by embryos, and does not consider mass re-distribution (drifting or scattered planetesimals), embryo-embryo accretion or the final giant impact stage of planet growth (note that Chambers 2006 include an increase of 50% to to account for embryo-embryo mergers in a semi-analytical model).
For a typical surface density that scales as the isolation mass increases with distance, where at 1.5 au this leads to typical embryos roughly equal to a Mars mass (see Figure 1). This concept encodes no information about timescales and does not consider mass loss and re-distribution due to collisional fragmentation. Mass loss due to fragmentation and drift will depend strongly on the behavior of the gas disk over time (Kominami & Ida, 2002; Chambers, 2008; Kobayashi et al., 2010; Ormel et al., 2010). Despite these clear inadequacies, it does serve as a foundation for many of the analytic approaches below and as a valuable fiducial for comparing the early stages of growth found in numerical approaches.
1.1.1 Analytical Descriptions including Fragmentation and Gas Effects
Semi-analytic models of embryo growth necessarily consider the collision probability between the growing bodies and the local swarm of smaller planetesimals, where the dynamical excitement of all bodies and their size distribution is a critical component in determining accretion rates. The fragmentation and drift of planetesimals complicate this calculation, and where included has been found to alter the accretion rates due to the loss, or re-distribution, of mass (Chambers, 2006; Kobayashi et al., 2010; Ormel & Kobayashi, 2012).
Chambers (2008) included this effect in a semi-analytic approach to modeling the growth of planetary embryos but was restricted in the handling of an evolving size distribution of planetesimals, where fragmented planetesimals all were put in one size bin. This work also considers embryo-embryo mergers and embryo atmospheres, for which the former affect is found to roughly increase embryo growth rates by the simple flat rate of %. With all of the above physics included, and assuming a decreasing surface density of the gas disk with an exponential 2 Myr timescale, and planetesimals initially with diameters of 10 km Chambers (2006) finds inside-out growth of embryos, with a slow march towards isolation masses over 3-10 Myr (see Chambers 2006 Figure 12). For nominal MMSN masses of gas and solids and surface density profiles, the embryo growth is found to approach isolation masses at 1 au in under 1 Myr and 2 au in 3 Myr and have a growth timescale that scales as , with the only fluctuations/variations related to initial planetesimal excitement briefly driving oligarch growth away from that scaling. Other noted affects are that shallow surface densities lead to growth exceeding isolation mass because more solid material drifts into regions of the inner disk (from outside the inner disk) than drifts out of it. Increased masses increase the isolation mass and decrease the time to reach isolation mass.
It has been found that growth timescales also depend on the initial size of the planetesimals (Kobayashi et al., 2010; Kobayashi & Dauphas, 2013), with more rapid growth and more collisional grinding for smaller initial sizes. When planetesimals can collisionally evolve and create a collisional cascade down to small sizes, the timescale for depletion by fragmentation becomes inversely proportional to the surface density and increases for increasing initial planetesimal size and scales strongly with semimajor axis () (see Kobayashi & Dauphas 2013 Eq. 4.). Therefore embryo masses will be below isolation masses when the initial planetesimal size is less than km. When initial planetesimal sizes are very small, 1–10 km, embryo growth by fragment accretion becomes more important, where, with no radial drift of fragments, embryos can reach isolation mass more rapidly than growth from the initial planetesimals population.
Kobayashi & Dauphas (2013) propose that a solution to the combined problem of the mass of Mars and its rapid formation timescale can be addressed by decreasing initial planetesimal size to increase accretion rate, and to also increase the surface density to make up for mass loss to collisional grinding. Combined initial radii between 1–10 km and surface densities between 2–3 MMSN may satisfy both criteria – and this is tested numerically in this work.
Despite significant advantages to modeling growth analytically during runaway and oligarch growth stages there are strict limitations once oligarchs start crossing orbits, having chaotic orbital evolution or altering the mass distribution of material by scattering planetesimals. Hence we cannot draw from these works conclusions about the final planetary system, in terms of the number of planets, orbital properties or timescales for the giant impacts that serve as critical chronometers for growth and evolution timescales.
1.1.2 Numerical Descriptions including Fragmentation and Gas Effects
Numerical efforts typically rely on statistical techniques to account for the short timescales and large numbers of interactions between very small objects in a gas-disk and then necessarily transition to -body integrations of planetary embryos having distant gravitational encounters for millions of years. Combining these very different types of calculations results in hydrid -body codes with a range of capabilities (Kenyon & Bromley, 2006; Leinhardt et al., 2009; Levison et al., 2012; Morishima, 2015)
Numerical models typically find the inside-out growth predicted by the analytics. In hybrid -body simulations with km between 0.86-1.14au and a 1MMSN surface density, Kenyon & Bromley (2006) find that oligarchs ( g) are produced at the inner edge of the annulus in 300,000 years with the transition to oligarchy moving outwards across the annulus. The timescales for reaching and leaving oligarchic growth is found to depend strongly on initial surface density, where chaotic growth regime begins earlier and is more violent for more massive disks. When modeling a disk stretching from 0.2-2 au they find inside-out growth with oligarchs formed on the inner edge in 100,000 years and in 1 Myr at the outer edge. No fragmentation or mass loss due to collisional grinding was included, and the dependence on gas disk timescale for onset of the chaotic stage of growth was not investigated.
The dependence on the timescale and nature of the dissipating gas-disk was the focus of a study utilizing a full -body model of the final stages of planet formation (Kominami & Ida, 2004). The onset of embryo crossing orbits depends strongly on the gas disk lifetime and allows for continued accretion of embryos before giant impacts initiate (see also Walsh & Levison (2016) which found similar outcomes while modeling a different formation scenario). The implication is that the gas density is more closely correlated with the onset of embryo-crossing orbits than are the damping affects of dynamical friction from planetesimals. Therefore attempting to model just the final stages of growth it may be admissable to begin a model under the assumption that the gas has just dissipated, allowing crossing embryos orbits, but there would be no clear guidance on what to assume in the planetesimal population. A long gas lifetime could keep a stable suite of embryos around for a long time, but would allow for more depletion of planetesimals relative to a short disk lifetime.
Collisional fragmentation and mass loss has been modeled in full -body simulations utilizing a specific state-of-the-art collision model, called EDACM (Leinhardt & Stewart, 2012; Leinhardt et al., 2015), integrated into the -body accretion model (Carter et al., 2015; Leinhardt et al., 2015). This model utilizes particle radius inflation to decrease computational requirements and is particularly well-suited for very high-resolution simulations starting mid-way through runaway growth and continuing into the onset of giant impacts and chaotic growth. They are not ideal for the final long runout of accretion due to the second-order integrator accuracy. These works started with similar sized particles (Leinhardt et al., 2015) or from with a size distribution of planetesimals representative of a disk still in runaway growth ranging up to 0.01 Earth Masses for the largest (Carter et al., 2015). Both note the inside-out growth characterized by an “embryo front” that moves through the disk. The growth to embryos in the midst of the gas disk produced less massive embryos, but on shorter timescales, than for systems with no gas drag (see also Wetherill & Stewart 1993; Kokubo & Ida 2000).
When bouncing or fragmention is included for the final stages of growth, during the epoch of giant impacts and the final growth of the planets, the primary affect is found to extend the timescale for formation and produce slightly less dynamically excited final systems of planets (Kokubo & Genda, 2010; Chambers, 2013). These works either allow bouncing of embryo’s to simulate non-perfect accretion scenarios (Kokubo & Genda, 2010) or set a minimum fragment size that can be produced in an energetic collision (Chambers, 2013). Modeling this effect is particularly hard as large impacts could create a huge number of new particles spanning all sizes all the way down to dust, instantly increasing the of a simulation.
1.1.3 This work
The combined previous research finds numerous important affects that should be expected to strongly impact the growth and final suite of planets. Many of these are not typically considered when constructing initial conditions for models of the final stages of planet growth:
-
1.
Growth timescales should be increase with distance,
-
2.
Fragmentation can increase the accretion timescale and when paired with small initial planetesimals will decrease embryo masses,
-
3.
The state and dissipation of the gas disk may determine the onset of giant impacts and chaotic growth,
In this work we aim to explore the growth of the terrestrial planets from planetesimals to planets, in the midst of a decaying gas disk, as a function of the gas disk decay timescale and with a size distribution of planetesimals that collisionally evolve and can be lost due to collisional fragmentation. We endeavor to compare, where possible, with the timescales and scaling relationships previously discussed and with results from different analytical and numerical approaches. Specific questions to be answered:
-
1.
When and where is a disk in oligrachic growth?
-
2.
What is the spatial and size distribution of planetesimals during this growth?
-
3.
How does exponential disk decay affect embryos and planetesimals at different stages of growth?
Another driving goal of this work is to develop a prescription to describe the state of the inner disk growth as a function of time, gas disk properties and initial planetesimal properties. The constant mention that previous initial conditions are typically inadequate is meant to motivate future modelers to use something superior, and we aim to facilitate this.
Futhermore, by the nature of the modeling techniques used, we will present final planetary systems for numerous sets of input parameters. In places we present suites of simulations to give a more robust view of possible outcomes. Naturally, this covers a small region of large parameter space, but provides the important connection between models of embryo growth in the context of important constraints on final planetary systems.
2 Methods
To do planetesimal to planet simulations we use the code LIPAD, which stands for Lagrangian Integrator for Planetary Accretion and Dynamics (Levison et al., 2012). LIPAD is based on the algorithm known as the Wisdom-Holman Mapping (WHM; Wisdom & Holman 1991). It can treat close encounters between bodies using the algorithms of SyMBA (Duncan et al., 1998). SyMBA also allowed for increased computational speed by breaking the population into larger “embryos” that had full -body gravitational interactions with each other, and a smaller population of planetesimals that had -body gravitational interactions with embryos, but not each other. Here, LIPAD utilizes “tracer” particles that each have the identical total mass for calculating the gravitational evolution of the system. Each tracer also has a representative radius , such that it represents a swarm of particles each of radius whose mass sums up to the total mass of the tracer itself. The tracers have normal -body interactions with larger embryos (as in SyMBA), but can evolve the sizes and random velocities of other tracers.
Collisional probabilities are calculated for each tracer as a function of its size and the total mass, sizes and orbits of its neighboring tracers. The dynamics of each tracer is modeled with direct gravity calculations with all embryos as well as other dynamical effects (dynamical friction, viscous stirring between tracers), where many calculations depend on the particle’s radius and the masses, sizes and orbits of its neighbors. Tracer particles can grow to the point where they are promoted into being embryos, although they go through a phase as “sub-embryo” so as to avoid unphysically large scatterings as they would be only slightly more massive than the tracer particles (see(Levison et al., 2011) for more details).
There are limits on the smallest size that tracers can reach. As they get smaller, collisional probabilities increase and simulations become more computationally expensive. Thus a small size is set, below which particles are removed from the system, under the presumption that they will collisionally grind to dust on rapid timescales or, if the gas disk is still present, they will experience rapid inward drift and remove themselves from affecting the larger dynamics of the system. In the presence of the gaseous nebula the sizes of particles that experience maximum inward drift is near 1 meter, which is selected as the smallest size allowed in the collisional cascade for all simulations presented in this work. Tests were run with a small size of 0.1 m, for the first 1 Myr of evolution and then from 4–8 Myr of evolution of a nominal simulation, and while the mass loss amounts and locations were not identical, they were similar enough to suggest that when simulations with smaller sizes are computationally feasible the results will look quite similar.
For the first 4 Myr of each simulation the giant planets were at 3.5 and 6 au with 1 Earth mass each. At 4 Myr they were moved instantaneously to 5.0 and 9.2 au and increased to their current masses on dynamically cold orbits (), where these orbits are meant to represent the low-eccentricity orbits preceeding the expected giant planet instability (Levison et al., 2011).
The effects of the solar nebula are modeled through aerodynamic drag and type-I eccentricity damping (see Levison et al. 2012 and references therein). For Nominal tests here the gas disk started with a surface density at 1 au of 1.4 g cm-3 (Hayashi, 1981), and the density profile with radius and time is , where is 9/4 and the decay timescale is 2 Myr. The disk also has a flaring profile where the scale height =0.05 au, and a power law profile =1.25. The mass of the gas disk, the population of solids and the timescale for disk decay were all varied in different suites of simulations.
Planetesimals and embryos had a density of 3 g cm-3 throughout. When a collision occurs a fragmentation law is used to determine the outcome (Benz & Asphaug, 1999). This determines the expected size distribution of fragments, and a radius is chosen from that distribution for each tracer involved. The size distribution of the system requires the inclusion of many tracer particles, each with different sizes to build a size distribution regionally (see Levison et al. 2012 for more detail). The handful of very large, embryo-embryo, impacts in each simulation are treated in the exact same fashion, despite Benz & Asphaug (1999) experiments being designed for impacts between bodies with radius 1000 km (see Deienno et al. in prep for further work on energy dissipation in giant impacts in LIPAD simulations).
Simulations utilized a range of resolution, total number of initial tracer particles, and semimajor axis range, but always had an inside edge of the mass distribution at 0.7 au.
2.1 Nominal Case
The “Nominal” case uses 5000 particles starting with km with a 1- spread in radius of 3 km. The initial surface density profile follows for a total mass of solid material equaling 3.32 Earth masses between 0.7-3.0 au. A gas disk is included in the calculation that has an initial gas density of 1.4 g/cm3 at 1 au that provides aerodynamic gas drag and type-I eccentricity damping on particles (Adachi et al., 1976; Tanaka & Ward, 2004). The gas density decreases exponentially with a 2 Myr timescale. The smallest allowable particle produced in a collision is 1 meter, below that size particles are removed from the simulation, and tracked as mass lost to collisional grinding.
The Nominal and the related high-resolution case (with 2 the number of tracer particles, but identical total system mass), were both used for analysis of initial growth to 10 Myr, and the related timescales associated with the transition to oligarchic growth as a function of semimajor axis. These cases were not used in the analysis of the final planetary systems due to prohibitively long run-times - all final planetary systems were part of the various low-resolution suites of simulations that used 2000 tracer particles between 0.7–2.25 au.
2.2 Grid of Mass and Gas Lifetimes
We rely below on a grid of simulations where increasing total disk masses are paired with decreasing disk lifetimes. Disk masses of 2, 1.5 and 1 Minimuim Mass Solar Nebula were modeled with gas disk dissipation timescales of 1 Myr, 2 Myr and 3 Myr respectively for a total of three different sets of parameters. For these three cases, four simulations each were run with randomized orbital elements and sizes, and are combined for some analyses. Additionally, there are other singular test cases, such as simulations with no gas disk, gas disks that extend forever, no collisional grinding etc., that are used as simple tests of different scalings. For all of these cases, where the simulations were run to 115 Myr, they were low-resolution, with 2000 initial tracers between 0.7–2.25 au.
2.3 Test of Kobayashi & Dauphas 2013
A direct test of a proposed set of disk properties that could be capable of growing Mars-sized embryos fast enough to match Mars’ growth timescale was put forth in a series of analytical arguments and statistical simulations (Kobayashi & Dauphas, 2013). Here, four simulations were run using km with a 2MMSN disk mass and a 2 Myr disk dissipation timescale, where the parameters were selected from Figure 3 of Kobayashi & Dauphas 2013 as being safely in the region satisfying expected embryo sizes and growth timescales. These simulations presented here otherwise utilized the Nominal settings described above, with the exception of not including massive giant planets during any of the growth (instead these simulations include 0.1 Earth Mass planets at 5.4 and 9.0 au - a difference we do not expect to be important for the tests reported here).
3 Results
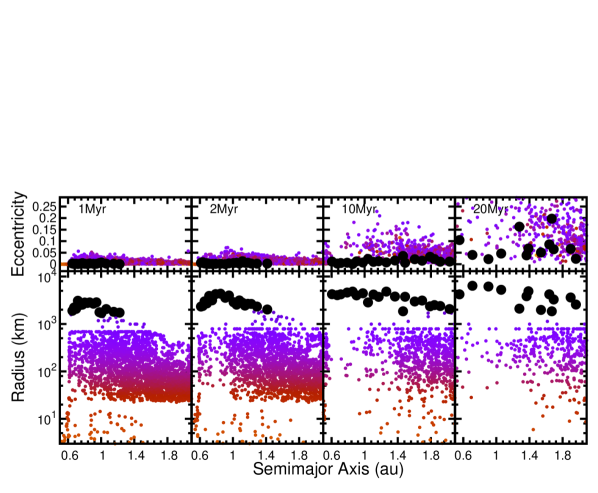
Here we present models of the growth and evolution of the inner Solar System from km-sized planetesimals up to a final system of planets. We include fragmentation of particles during collisions, interaction at all sizes with a dissipating gaseous solar nebula, and the gravitational interaction of all of the mass in the system. A Nominal simulation and its initial conditions is shown in Figure 2. The growth is strongly inside-out, as found and predicted by previous works (Weidenschilling et al., 1997; Kenyon & Bromley, 2006; Minton & Levison, 2014; Carter et al., 2015). The localized area near 1 au reaches a 50% mass ratio between planetary embryos and planetesimals in 700 kyr (here objects more massive than 0.012 Earth Masses, a lunar mass, are considered embryos and less massive objects are planetesimals). This region is nearly 90% planetary embryos by mass at 2 Myr and already a Mars-mass embryo has grown. Meanwhile, at 2 au the same bi-modal state is reached in approximately 18 Myr, and only reaches a point where 90% of the mass is in planetary embryos at 50 Myr and the largest body does not reach a Mars mass due to grinding and drifting of planetesimals. The planetesimal population is heavily depleted inside of 1 au by 2 Myr, and is almost entirely gone by 10 Myr. Meanwhile at 1.5 au the planetesimals are slightly depleted, but also dynamically excited (as seen by their elevated eccentricity relative to those closer to 2 au). Despite being 5 e-folding times into the gas disk dissipation, the system of embryos is still dynamically cold (see top panes in Figure 2). This has changed by 20 Myr, as the embryos are in the midst of a instability with high eccentricities, high velocity collisions and giant impacts. The excited embryos naturally lead to the excited population of planetesimals.
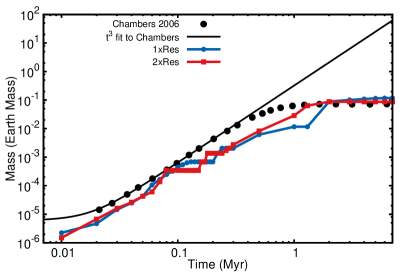
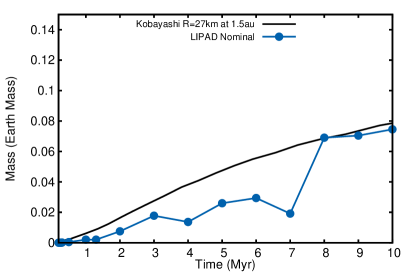
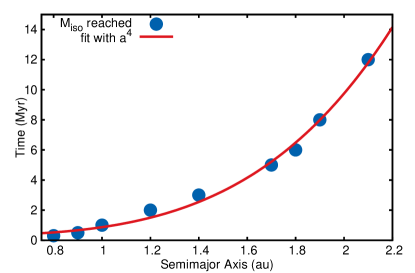
The timescales for embryo growth can be directly compared to previous analytical formulations. Embryo growth proceeds with roughly the predicted scaling with time ( ) for times up to a few hundred thousand years, as found in the analysis of (Chambers, 2006). This is recovered despite not considering embryo atmospheres but including a full planetesimal size distribution. The growth at 1 au is an especially close match beyond a few hundred thousand years despite there also being a mis-match in initial planetesimal size (these models start with 30 km as opposed to 10 km used by Chambers (2006): see Figure 3). Similarly, embryo growth at 1.5au proceeds largely as predicted by the analytical work found in (Kobayashi et al., 2010; Kobayashi & Dauphas, 2013), despite a large disparity in gas dissipation timescale (10Myr vs. 2Myr: see Figure 4).
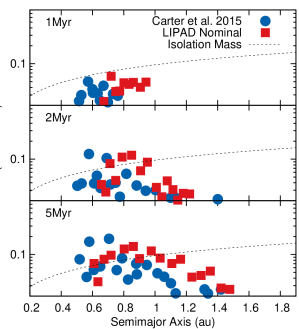
The growth of embryos in LIPAD can also be compared to the direct -body simulations utilizing gas affects and the EDACM collision model (see Figure 5). The two simulations being compared used different inner edges of the disk, 0.5 and 0.7 au for Carter et al. (2015) and this work respecively. They also used different starting sizes for planetesimals, where Carter et al. (2015) used an initial size distribution of particles ranging between 196-1530 km meant to represent a disk already in runaway growth, which is therefore at a more advanced stage of growth than the Nominal LIPAD simulation initial conditions with a unimodal size distribution km. Furthermore, the direct -body simulations of Carter et al. (2015) use very different techniques, with very high resolution (100,000 particles) and radius inflation to reduce runtime (where comparisons are made between their scaled effective simulation times). Despite these parameter and modeling differences, the growth and evolution of the suite of embryos is qualitatively similar, showing strong inside-out growth and embryos growing above expectations for isolation masses due to embryo-embryo mergers and mass re-distribution in only a few million years. These are important aspects to the current results discussed in depth below.
Finally, the resulting planet systems can be compared with a plethora of previous works. This Nominal suite of simulations lost significant mass to collisional grinding (see Section 3.2 below for more in depth discussion of mass loss). This mass lost drove the final mass in planets very low compared to the current Solar System, resulting in an average total mass of 1.44 Earth Masses (compared to 1.97 for the current Solar System). This resulted in too many planets (average of 9.5) on dynamically cold orbits (see Table 1). There were nominally small Mars analogs, averaging masses of 0.25 Earth Mass, but in light of the total depletion of mass this does not represent a significant change in the Earth/Mars mass ratio. It also motivates the other parameter space that is explored in this work with more massive initial starting conditions.
To zero-th order these Nominal LIPAD simulations reproduce many of the qualitative growth patterns and quantitative timescales previously found. While the inside-out growth has generally been predicted or observed in numerical experiments before, it is commonly assumed, that the disparity in timescales was less than the time of the transition from oligarchic growth to chaotic growth or giant impacts (see Kenyon & Bromley 2006 who note that this is not always the case in their simulations). The completion of oligarchic growth across the entire disk provided convenient initial conditions for numerical models that aim to model the final stages of planet growth and the resultant planetary systems. Here, the outcomes of these models do not support this assumption and warn future works away from assuming a full disk of embryos amidst planetesimals in different places at different times.
3.1 Oligarchy moves outward like a wave
Oligarch growth moves outward like a wave and is only valid in one place in the disk at a time. This is more than just inside-out growth, but rather a “front” (a term used by Carter et al. 2015) of oligarchic growth progressing over time, such that only one small region of the disk can meet any canonical oligarchy condition of mass ratio between embryos and planetesimals. The timescales for growth vary as a function of semimajor axis due largely to differences in orbital periods (Chambers, 2006; Kobayashi et al., 2010). One analytic estimation for growth timescale from planetesimal accretion alone, depends on semimajor axis, , to the power (see Kobayashi & Dauphas 2013 eq. 5), which alone could account for a factor of three in growth timescales between 1au and 1.5au.
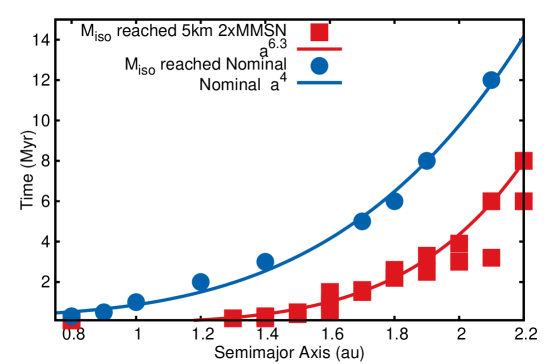
In the nominal simulations (including the high-resolution case) and the grid of twelve simulations exploring disk mass and disk lifetime, the time at which isolation mass is reached can be described by to (see Figure 6 showing the two nominal simulations). This steeper relationship results in slower relative growth at 1.5 au compared to 1 au, resulting in closer to a factor of five in growth timescales (see Figure 6).
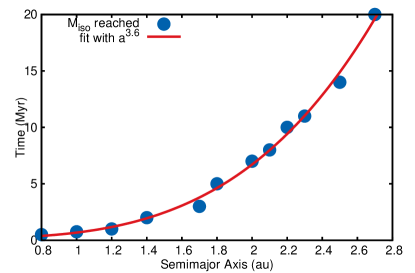
The likely reason for the stronger dependence on found in this work compared to previous analytic efforts could be the more substantial mass loss and drift due to collisional grinding. A test simulation was run for the nominal scenarios where no collisional grinding was allowed (collisions occurred and were tracked, but the law was altered to make bodies unbreakable). The time to reach isolation mass had a less steep dependence, best fit by (see Figure 7). While this does not entirely bridge the gap with the analytical estimates, there is a key difference in modeling setups, where for any region in the analytical models there is material and debris grinding and drifting from a more distant semimajor axis. Here, the disks modeled have edges at 2.25 au or 3.0 au, so there is likely some contribution to these differences by the lack of material drifting in from the outside to partially replace material that has drifted away to smaller semimajor axis.
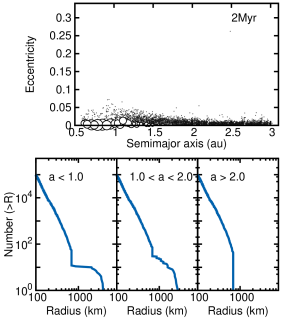
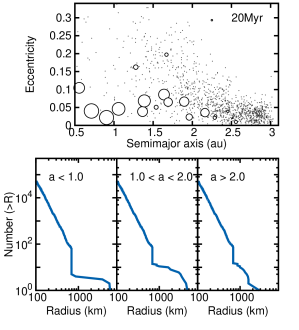
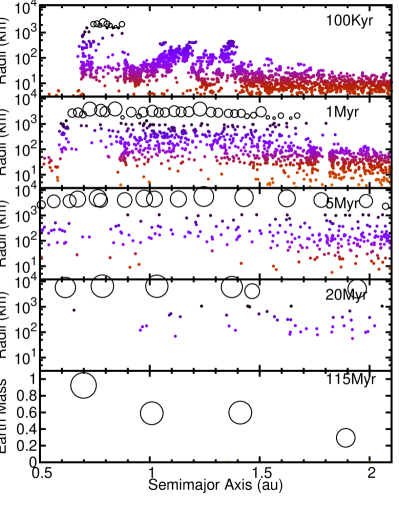
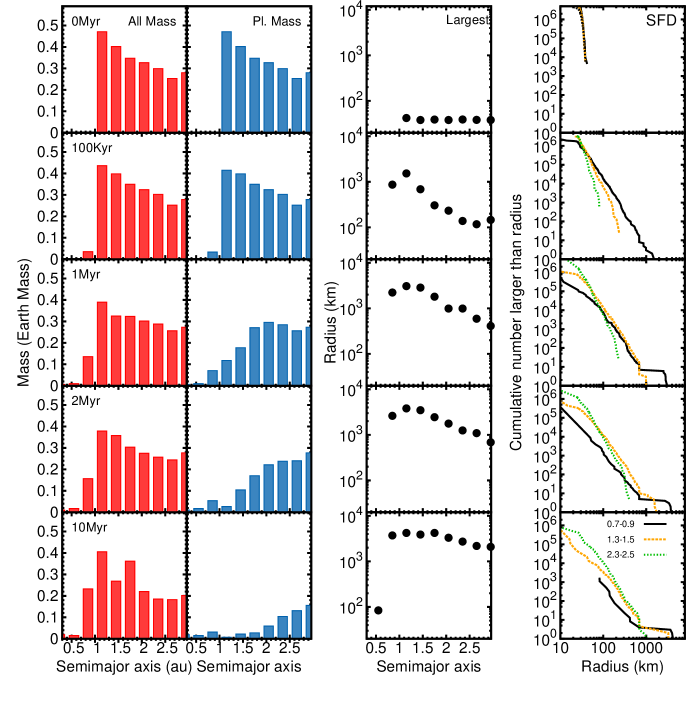
This stronger inside-out growth means that for a minimal mass solar nebula with km, there is no time when the entire disk is in runaway growth or oligarchic growth (see Figure 8). At 2 Myr the region inside 1 au is dominated by embryos, making up 81% of the mass, which is seen in the break in the size frequency distribution (Figure 8, bottom left pane). Between 1.0 and 2.0 au the disk is 22% embryos, and there is no break in the size distribution pointing to most of the region still growing by runaway growth. Finally, beyond 2 au, there are only planetesimals the largest of which has grown to 787 km and runaway growth is moving along slowly.
The timescales across the inner disk are so vastly different that by 20 Myr the region inside of 1 au is experiencing chaotic growth and giant impacts, but beyond 2 au the disk has built its first few embryos (see Figure 9). Despite the successes of analytical models in calculating embryo growth some of the disk entering a chaotic phase challenges any analytical description of final planet growth owing to the chaotic nature of embryo-embryo collisions and scattering, This same affect also challenges numerical techniques that can’t handle simultaneous modeling of such different regimes of growth.
3.2 Mass loss due to grinding has a strong dependence on semimajor axis
Different embryos that have similar mass but are growing in different regions of the disk, experience different growth conditions over their lifetime due to differences in mass loss and growth timescales relative to the gas disk lifetime. At 1 au a bi-modal mass distribution is reached after only 700 kyr, which is 1/2 of the gas disk’s e-folding dissipation time. This is in stark contrast to 18 Myr at 2 au, which is 9 e-folding times of the gas disk dissipation timescale. The enormous difference in gas quantities results in more effective stirring by the embryos at greater distance, where the RMS eccentricity of planetsimals is 0.014 at 700 kyr at 1 au, while at 18 Myr at 2 au it is 0.1 (these translate to average collision velocities of 0.46 km/s and 2.3 km/s respectively).
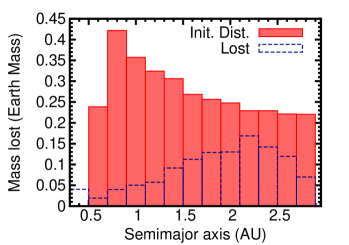
This disparity leads to a strong preferential mass loss at greater distances (Figure 10), owing to the higher eccentricities (Figure 2) and thus more violent and disruptive impacts. The location of maximum mass loss tracks outward with the oligarchic wave, so that at very early times (0-5 Myr), most of the collisional grinding is happening around 1 au - where the first embryos are growing. As embyros start appearing further out, mass loss follows, as at smaller distances the larger embyros have heavily depleted their local planetesimal population and at further distances there are no embryos around yet to stir the planetesimals.
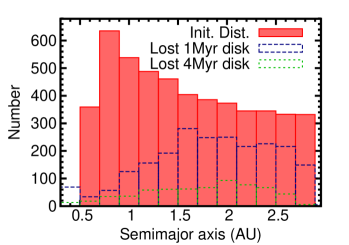
The magnitude of mass loss to collisional grinding is known to also be a function of the initial planetesimal size (as is the growth timescale, which here is relevant since the gas disk dissipation timescale is not changing; see Kobayashi & Dauphas 2013). Here, when the initial planetesimal radius is 3 km or 100 km (instead of 30 km in the Nominal case) there is more and less collisional grinding respectively, but varying by no more than a factor of two. In the case of 100 km, with the least mass loss, more then 20% of initial mass at 1.5 au was lost to disruptive impacts. Similarly, extending or decreasing the gas disk lifetime can alter the amount and profile of mass loss. For a simple test over 25 Myr, with a gas disk lifetime or 1 Myr and 4 Myr, the shorter disk lifetime allows earlier excitation of the system and more collisional grinding and mass loss (Figure 11).
This result leads naturally to ask how this substantial mass loss affects the final planetary systems since it appears to offer a path to depart from the initial surface density distribution of solids.
3.3 Can grinding account for Earth/Mars mass ratio?
As found above, mass loss due to collisional fragmentation has a strong dependence on semi-major axis, with mass loss maximized at and beyond where oligarch growth has reached by the time that the gas-disk has dissipated 5 e-folding times. At large heliocentric distances the lack of damping due to the gas means that accretion efficiencies are lower and collisional fragmentation is increased amidst planetary embryos that are stirring the local population. For a suite of four low-resolution nominal case simulations (nominal initial conditions, but only 2000 tracer particles), the grinding causes significant mass loss around 1.5 au, and production of a reasonable Mars-analogs (). However, the total amount of grinding affected the masses of the Earth and Venus analogs, leaving only 1.44 of total mass in planets after 115 Myr (see Table 1). This mass loss resulted in many planets remaining on dynamically cold orbits (see Nplanets and AMD in Table 1). While longer run-times may have found eventual reduction in the total number of planets, the total planet mass was so low that the runs were not continued beyond 115 Myr.
The Nominal results motivate an exploration of disk mass and gas disk dissipation timescale. This is similar approach to that of Kobayashi & Dauphas (2013) who sought a combination of initial planetesimal radius and total disk mass to accomodate the mass of embryos at 1.5 au and the short accretion timescale of Mars. Here, the relation is that with increasing disk lifetime the point in the disk where grinding is maximized moves outward as Oligarch growth will move further due to the longer time amidst gas. But the growth rate increases with increasing total disk mass, as does the expected isolation masses of embryos. By testing combinations of 1,,2MMSN paired with gas disk timescales of 3 Myr, 2 Myr and 1 Myr we aim to balance increased solid material with less or more rapid growth timescales and less or more total grinding. For each set of parameters four low-resolution simulations were performed.
This grid of simulations did not find a sweet spot of a depressed Mars mass and of planets (see Table 1). The set of parameters that was closest to of total mass of planets was for a 1.5x MMSN and 2 Myr gas lifetime, with an average of 2.22 . However, the Mars analogs were large and averaged 0.6 . The Mars analogs are lower for the 1x MMSN 3 Myr gas cases, 0.43 , but the total mass in all planets was only 1.62 .
For each simulation in the grid of runs, the system was analyzed at 115 Myr, tracking the total mass of planets Mtot, where a planet is defined to be 1/30 th of an Earth Mass. Also tracked are the mass of Mars analogs (MM; if ) and their semimajor axis at completion (aM), and the system Angular Momentum Deficit (AMD) and the Radial Mass Concentration (RMC). The AMD measures the dynamical excitement of a system of planets relative to the same system with zero eccentricity and incliation (Laskar, 1997; Chambers, 2001), where the current terrestrial planets value is 0.0014, and is defined as
| (1) |
where , , , and are the mass, semimajor axis, inclination, and eccentricity of planet .
The RMC is a metric that increases with concentration of planetary mass, and decreases with widespread systems with distributed planetary mass, where the current solar system value is 89.9 and its calculated by (Chambers, 2001).
| (2) |
where and are again the mass and semimajor axis of planet , and ranges from 0.1 au to 2 au. The RMC is particularly sensitive to the small Mars problem, where results with the typically over-sized Mars-analogs of 5-10 the size of Mars produce RMC values between 30–50 (Raymond et al., 2009).
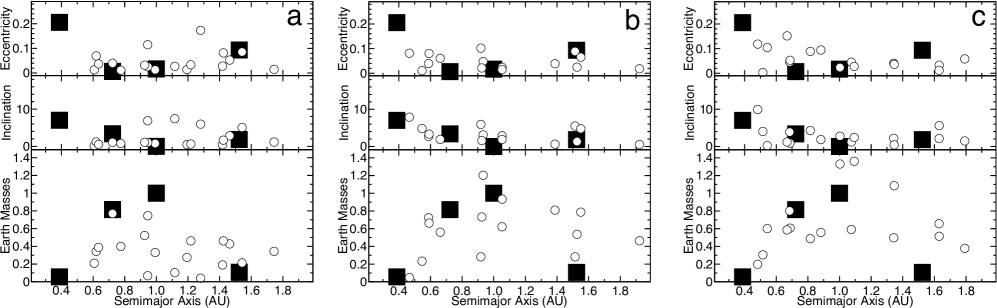
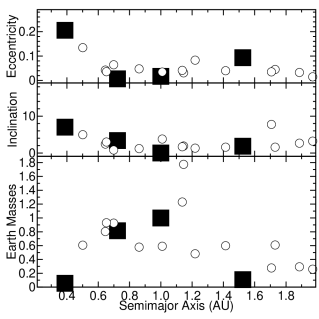
The planetary systems created in the partial grid of parameters space, from 1-2MMSN and 1-3 Myr gas disk dissipation time, produced roughly consistent systems within each set of parameters (see Figure 12 and Table 1). The 1MMSN case has too little mass remaining, averaging 1.62 due to mass lost during collisional grinding. The mass of Mars is the lowest of the three cases, averaging 0.43 , but simply decreased proportional to the total deficiency of mass in the planetary system. The deficiency of total mass also results in low mass Earths (Figure 12a), and the largest number of total planets, 4.5, on average.
The 2MMSN overshot the total mass, averaging 2.63 per system of planets, and also large Mars analogs averaging 0.69 . This is expressed in the handful of 1.3 planets formed in these simulations (Figure 12b). Finally, the 1.5MMSN initial disk with a 2 Myr gas disk lifetime provided the best match to the total mass of the suite of final planets, averaging 2.22 , but still far overshooting the mass of Mars analogs with an average of 0.6 .
All of the parameter suites produced similar AMD and RMC values. The similarity of the RMC shows that the mass of Mars is increasing or decreasing roughly in proportion to the total mass of planets for each set of parameters. The values of RMC are roughly in line with those found for numerous previous simulation scenarios including giant planet excitation (Raymond et al., 2009), and well below those found by the scenarios that utilize an annulus that have found good matches for this particular metric. (Hansen, 2009; Jacobson & Morbidelli, 2014; Brasser et al., 2016).
A large suite of classical simulations that varied primarily the giant planet orbit conditions produced final AMD values between 1-10 the current value, so between 0.0018 and 0.018 (Raymond et al., 2009). A large suite of annulus, or Grand Tack, simulations found that AMD values for final planets would vary between and 0.01 for a range of tested initial embryo mass and embryo size (Jacobson & Morbidelli, 2014). The averages found here, 0.0030 – 0.0046, or 2–3 the current value represent no clear improvement over the outcomes described in Raymond et al. (2009), and are possibly slightly worse than that found in the Grand Tack cases tested in Jacobson & Morbidelli (2014).
The RMC values for Raymond et al. (2009) tests range between 0.2–0.8 the current value. Naturally Jacobson & Morbidelli (2014), doing annulus tests that have a long record of producing good Earth/Mars mass ratios, produced excellent RMC values 0.5–1.1 times the present RMC. Meanwhile the simulations presented here look more similar to the full-disk tests of Raymond et al. (2009) and consistently produce RMC values between 30–60, or 0.3–0.75 times the current RMC value, suggesting Mars-analogs that are too massive.
There is no parameter set tested here, of gas disk lifetime and disk mass, using 30 km initial planetesimal radii, that can satisfy both a small Mars and supply the total mass required by the four terrestrial planets.
| Rinit (run #) | Nplanets | Mtot | AMD | RMC | MM (M⊕) | aM (au) |
|---|---|---|---|---|---|---|
| 1xMMSN 2Myr gas (1) | 19 | 1.39 | 0.0001 | 42.82 | 0.17 | 1.51 |
| 1xMMSN 2Myr gas (2) | 8 | 1.40 | 0.0006 | 48.75 | 0.19 | 1.24 |
| 1xMMSN 2Myr gas (3) | 5 | 1.43 | 0.0008 | 40.73 | 0.37 | 1.37 |
| 1xMMSN 2Myr gas (4) | 6 | 1.55 | 0.0007 | 43.17 | 0.27 | 1.22 |
| Average | 9.5 | 1.44 | 0.0006 | 43.87 | 0.25 | 1.34 |
| 2xMMSN 1Myr gas (1) | 3 | 2.64 | 0.0029 | 59.13 | 0.51 | 1.63 |
| 2xMMSN 1Myr gas (2) | 5 | 2.55 | 0.0031 | 32.40 | 0.50 | 1.34 |
| 2xMMSN 1Myr gas (3) | 4 | 2.55 | 0.0019 | 43.49 | 1.08 | 1.34 |
| 2xMMSN 1Myr gas (4) | 4 | 2.79 | 0.0039 | 40.52 | 0.66 | 1.63 |
| Average 2x 1Myr gas | 4 | 2.63 | 0.0030 | 43.89 | 0.69 | 1.49 |
| 1.5xMMSN 2Myr gas (1) | 3 | 1.94 | 0.0027 | 44.32 | 0.28 | 1.52 |
| 1.5xMMSN 2Myr gas (2) | 3 | 1.97 | 0.0021 | 56.02 | 0.54 | 1.53 |
| 1.5xMMSN 2Myr gas (3) | 4 | 2.35 | 0.0125 | 33.07 | 0.79 | 1.59 |
| 1.5xMMSN 2Myr gas (4) | 5 | 2.61 | 0.0011 | 35.52 | 0.81 | 1.39 |
| Average 1.5x 2Myr gas | 3.5 | 2.22 | 0.0046 | 42.23 | 0.6 | 1.5 |
| 1xMMSN 3Myr gas (1) | 6 | 1.75 | 0.0024 | 43.97 | 0.34 | 1.74 |
| 1xMMSN 3Myr gas (2) | 4 | 1.60 | 0.0063 | 47.22 | 0.47 | 1.50 |
| 1xMMSN 3Myr gas (3) | 4 | 1.44 | 0.0036 | 53.11 | 0.46 | 1.43 |
| 1xMMSN 3Myr gas (4) | 4 | 1.68 | 0.0030 | 49.05 | 0.46 | 1.22 |
| Average 1x 3Myr gas | 4.5 | 1.62 | 0.0038 | 48.34 | 0.43 | 1.47 |
| Current Solar System | 4 | 1.97 | 0.0014 | 89.9 | 0.11 | 1.52 |
| km 2xMMSN 2 Myr gas (1) | 4 | 2.41 | 0.0019 | 41.5 | 0.60 | 1.41 |
| km 2xMMSN 2 Myr gas (2) | 4 | 2.47 | 0.0020 | 35.5 | 0.61 | 1.73 |
| km 2xMMSN 2 Myr gas (3) | 2 | 2.38 | 0.0032 | 40.8 | – | – |
| km 2xMMSN 2 Myr gas (4) | 4 | 2.69 | 0.0026 | 37.0 | 0.28 | 1.71 |
| Average 5 km, 2xMMSN, 2 Myr gas | 3.5 | 2.49 | 0.0024 | 38.7 | 0.50 | 1.61 |
3.4 Growing Mars from Small Planetesimals in a Massive Disk
Kobayashi & Dauphas (2013) propose that the combined constraints of the chronology of Mars accretion (few million years) and its small mass relative Earth can be accounted for by the growth from a massive (a few times MMSN) disk of small planetesimals (less than 10 km). The timescales to reach oligarchic growth are faster for the smaller initial planetesimal size, and the increased disk mass makes up for loss to collisional grinding. However, it is less clear what will happen at 1 au - whether a suitable set of Earth and Venus analogs will form - and how many other Mars-mass embryos could grow nearby or beyond any that grow at 1.5 au.
We performed a suite of simulations with km and a 2MMSN disk with a 2 Myr gas disk lifetime. The growth is indeed substantially faster, reaching isolation masses roughly twice as fast for the Nominal scenario (see Figures 13 and 14). In only 1 Myr embryos have grown out beyond 1.5 au, and by 5 Myr they stretch across the entire disk and dominate the total mass of the system.
The system at 5 Myr is nearly an ideal description of a bi-modal mass distribution - or the simple clean idea of oligarchic growth conditions so frequently assumed in models. It is not entirely so simple; between 0.7–1.0 au the embryos account for 94% of the mass, but only 53% between 1.7–2.0 au. The planetesimal distribution is not smooth, rather it shows a less extreme inside-out depletion as found in the Nominal simulations discussed above.
The final planets meanwhile suggest that not enough total mass was lost due to collisional grinding (Figure 15). The four simulations had similar final masses of planets all over 2.49 . The Mars-analog on average were only two to three times larger than Mars, but that was balanced by the simulation that only produce 2 planets with no Mars-analog. Meanwhile, of the few Earth-analogs formed at 1 au one was also 60% of an Earth-mass, while another was 1.77 . Without a more complete suite of simualtions its hard to entirely discount this scenario, but these first results suggest that while the accretion timescale and embryo mass at 1.5 au might be matched with the collateral outcome of too much mass at 1 au resulting in too few and/or too massive planets.
3.5 Two generations of planets
We find that embryos resulting from Oligarchic growth remain stable even after the vast majority of planetesimal mass are gone, where at 10 Myr the region inside of 1 au is 91% embryo by mass and is 94% by 15 Myr. This stability results in a quiescent period lasting 10 Myr prior to the onset of the giant impact stage of planet formation that is characterized by violent collisions between the embryos.
This dynamically cold and quasi-stable phase lasts longer than expected for similar systems without any gas affects. The spacing of the embryos found here, 10-12 mutual Hill Spheres, are the same as typically found in numerical and theoretical models (Figure 16) (Kokubo & Ida, 1998; Chambers, 2006; Kobayashi et al., 2010). Absent dynamical friction from planetesimals, and the affects of damping from gas, this spacing is not stable on long timescales for an isolated system of embryos, where 10 bodies with non-uniform, but average, spacing of 10 mutual Hill Sphere and non-uniform masses should only be stable for 1 Myr (Chambers et al., 1996). Owing to the presence of the dissipating gaseous solar nebula, the system of embryos remains dynamically cold (low eccentricity and inclination) and quasi-stable. The evolution of dynamical excitement is seen in the history of the system’s Angular Momentum Deficit (AMD), a common metric to track a systems divergence from circular and uninclined orbits (Laskar, 1997), where here a very slow increase in AMD is seen from 1-10 Myr. Only after 10 Myr does the AMD rapidly increase by over an order of magnitude in a few Myr (Figure 16). The sharp increase of the AMD reveals the dynamically cold suite of embryos transitioning into the giant impact stage of planet formation.
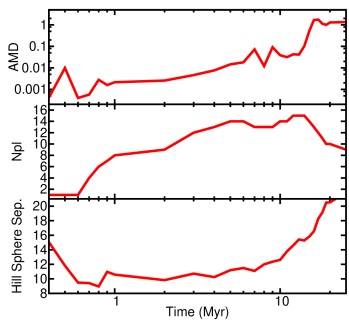
These dynamics are dominated by the effects of the gas disk. The dynamical stability of multi-planet systems has been found to change with only 0.1% of the starting MMSN of available gas (Iwasaki et al., 2001; Kominami & Ida, 2002), which is similar to the amount left in these simulations after 5 e-folding times, 10 Myr, when an instability is typically first encountered. Similar dynamics is found in other recent studies utilizing an exponentially dissipating gas disk (Walsh & Levison, 2016; Levison et al., 2015), where two very different pathways to a suite of embryos, an annulus or pebble accretion, both result in similar quasi-stability of the initial embryos. The two different timescales, a few Myr for building the first suite of embryos and a few 10’s Myr for completing the accretion of the planets is similar to the expected accretion times for Mars and Earth respectively (Dauphas & Pourmand, 2011; Kleine et al., 2009), which provides some support for the idea that Mars is essentially an embryo that sat out the final stage of growth.
The evolution of the system can be viewed as two generations of planets, the first grown in a few Myr and only after 10 Myr will the final set of planets start to be built. This is something not typically captured in models that begin at the Oligarchic growth stage in the absence of gas.
4 Rough Prescription for Generating Initial Conditions
One big takeaway from the above discussion is that planet formation initial conditions are vastly different than the typically assumed Moon to Mars sized embryos amidst a sea of planetesimals. This condition is never reached in any of our simulations, and here we endeavor to provide sufficient descriptions to enable others to build a set of initial conditions that match the growth described here.
At any given time knowledge of the regional size frequnecy distribution (SFD) and orbital properties at each semimajor axis should encapsulate the key pieces of information. An example of this also displays the breakdown between all mass and planetesimal mass (see Figure 17), as well as the largest body in each semimajor axis bin and particle size-frequency distributions in three distinct locations in the disk. The relationship between total mass and planetesimal mass will allow for determination of embryo mass, and the size of the largest body will provide, at least roughly, the dynamical excitment of the local planetesimal population. The complete set of data files showing orbit and size properties of every body are available over entire simulations online (at www.boulder.swri.edu/~kwalsh/LIPAD.html).
5 Discussion and Conclusions
Terrestrial planet formation is a deeply studied problem, but despite the attention that it garners, effects studied for over a decade are regularly not taken into account in modern discussions and simulations. Furthermore we find here that some of the affects are exaggerated when the dynamics of collisional evolution and the dissipating gas disk are utilized for the entire growth from planetesimals to planets.
The three questions posed in Section 1.1.3 questioned where and when one can find oligarchy in a disk and the implications for the planetesimal population. The Nominal scenario (1MMSN, 2 Myr gas disk dissipation timescale and 30 km ) finds that the growth timescale relative to the gas disk dissipation timescale allow for rapid progression of oligarchy inside 1 au leading to rapid depletion of planetesimals and rapid construction of a suite of dynamically cold and stable embryos. It takes another 10 Myr years for this state to reach the outer edges of the tested regions, by which time the depleted gas disk allows for much more planetesimal loss to collisional grinding. In this case chaotic growth starts inside of 1 au before oligarchic growth has reached beyond 2 au. Enough mass is lost to leave behind insufficient mass to build a suite of terrestrial planets.
In the simulations designed to test the =5 km and 2MMSN the growth timescale was significant faster than the gas dissipation timescale and a full suite of disk-wide embryos formed before the giant impact stage commenced. These simulations still had significantly more depletion of planetesimals in the inner disk compared to the outer.
The big takeaway is that exploring a modest grid of disk mass and gas disk dissipation timescales there was no clear sweetspot where collisional grinding could account for the mass difference between Earth and Mars. Extending this to the proposed solution of Kobayashi & Dauphas (2013) of 5 km initial planetesimals also did not seem to address the issue of the Earth/Mars mass ratio (although it did decidedly speed up growth of Mars-sized embryos, as predicted in that work). While there is significant parameter space yet to explore there is no guarantee that there is a simple answer to this issue based on collisional evolution, despite some clear trends, basic physics and the attractive simplicity of it. Furthermore, collisional grinding may not need to solve this problem alone, rather a combination of different growth patterns (e.g pebble accretion; see Levison et al. 2012) or larger solar system evolution (e.g an early giant planet instability; see Clement et al. 2018) may also contribute to changing the Earth/Mars mass ratio.
Another way to view these findings are that despite the discussed differences in collisional mass loss and long-lasting suite of stable embryos, the planetetary systems are not wholly different than previous works. Once the mass of the disk was increased to 1.5 or 2.0 MMSN, and the final total planet mass was close to 2.0 Earth masses, the typical metrics for modeling the terrestrial planets showed values similar to nominal cases from Raymond et al. (2009). While differences will still lurk in the outcomes for the growth timescales, number and nature of giant impacts and the structure of the remaining asteroid belt, it shows generally that the starting mass distribution (and its profile) will govern the final mass distribution in the terrestrial planets.
Future work should focus on departing from the simple assumption about an exponential decay of the gas disk, which may be biasing results away from any sharp discontinuities in embryo size or growth timescale at specific distances. Similarly, departing from simple monodisperse distribution of initial planetesimal sizes could play an important role in changing the outcome of the simulations. Also, a change in the initial surface density profile of the disk could also contribute to an increase in the Earth/Mars mass ratio. Finally, these results are compiled from combining suites of four simulations per parameter set and may not provide robust statistical views of the possible outcomes.
The test of Kobayashi & Dauphas (2013) also highlighted that in a regime where the growth timescale is substantially shorter than the the gas disk dissipation timescale, the disk did nearly reach a bi-modal mass distribution (although the planetesimal population did not follow the original surface density profile). Although not tested here, one can speculate that substantially changing any of the variables, disk mass, or gas disk lifetime, so that embryo growth happens under similar gas conditions throughout the disk would promote this outcome. However, for the Nominal conditions here - all typical in the literature - the gas disk timescale is similar to embryo growth near 1 au, leaving the outer regions of the disk to grow in subtantially less gas-rich condtions.
The small Mars problem is otherwise dealt with in the literature by significant involvment of the giant planets (Raymond et al., 2009; Walsh et al., 2011; Clement et al., 2018), non-smooth distributions of solid materials (Izidoro et al., 2014) or vastly different modes of accretion (Levison et al., 2015). Some of these models rely on scenarios and simulations built on the same assumptions assailed throughout this work - a simplistic bi-modal distribution of embryos and planetesimals. For example, the “Grand Tack” scenario modeled the migration of Jupiter through this simplistic disk, whereas the results here suggest that there could be significant differences in outcomes as a function of time and growth of the disk beyond 2 au (see Jacobson & Morbidelli 2014; Brasser et al. 2016) - such that the migrating giant planets encounter only planetesimals and no embryos, or the opposite, during their migration.
Other avenues to improve and expand on this work lie in the collisional model utilized. Here, using the Benz & Asphaug (1999) disruption model was realtively simple, but there are more recent investigations into the complex array of possible outcomes during small and large impacts (Leinhardt & Stewart, 2012; Leinhardt et al., 2015; Movshovitz et al., 2016). Given the huge number of collisions between planetesimals means that small shifts in disruptions laws at this size could add to big differences, and the complexity of possible outcomes between embryos makes it hard to generalize these critical final accretion/disruption events. Improved modeling of collisions at both could change the outcomes of models similar to this.
Other consequences that could spring from this work relate to rapid depletion of planetesimals near 1 au. The innermost planetesimals are accreted nearly to entirety and almost entirely into planets forming nearby. While there are some leftover planetesimals, there is minimal leftover mass relative to the typical bi-modal distributions typically used in modeling approaches. Whether the relative contribution to the planets from different regions of the inner solar system have substantially changed due to this affect is beyond the scope of the resolution of the simulations presented here and would require a specialized study.
The other stark difference with some previous work is the quasi-stable phase of the first suite of planetary embryos, dubbed “two generation of planets” in the main text. The evolution described here would generate a different history of giant impacts between planetary embryos, with much of the actual “giant impact” phase not kicking off until the nebular gas has greatly dissipated, potentially 10 Myr later than previously modeled. Presuming that this is a generic effect, that even minimal amounts of nebular gas can provide stability for a system of planetary embryos, then it could change the way we look for or interpret signs of giant impacts in extra-solar planetary systems.
Acknowledgements
KJW and HL were supported by NASA’s SSERVI program (Institute for the Science of Exploration Targets) through institute grant number NNA14AB03A, and NASA’s Emerging Worlds program. This work used the Extreme Science and Engineering Discovery Environment (XSEDE), which is supported by National Science Foundation grant number ACI-1053575.
References
- Adachi et al. (1976) Adachi, I., Hayashi, C., & Nakazawa, K. 1976, Progress of Theoretical Physics, 56, 1756
- Benz & Asphaug (1999) Benz, W., & Asphaug, E. 1999, Icarus, 142, 5
- Brasser et al. (2016) Brasser, R., Matsumura, S., Ida, S., Mojzsis, S. J., & Werner, S. C. 2016, ApJ, 821, 75
- Carter et al. (2015) Carter, P. J., Leinhardt, Z. M., Elliott, T., Walter, M. J., & Stewart, S. T. 2015, ApJ, 813, 72
- Chambers (2006) Chambers, J. 2006, Icarus
- Chambers (2008) —. 2008, Icarus, 198, 256
- Chambers (2001) Chambers, J. E. 2001, Icarus, 152, 205
- Chambers (2013) —. 2013, Icarus, 224, 43
- Chambers et al. (1996) Chambers, J. E., Wetherill, G. W., & Boss, A. P. 1996, Icarus, 119, 261
- Clement et al. (2018) Clement, M. S., Kaib, N. A., Raymond, S. N., & Walsh, K. J. 2018, Icarus, 311, 340
- Dauphas & Pourmand (2011) Dauphas, N., & Pourmand, A. 2011, Nature, 473, 489
- Duncan et al. (1998) Duncan, M. J., Levison, H. F., & Lee, M. H. 1998, The Astronomical Journal, 116, 2067
- Fischer & Ciesla (2014) Fischer, R. A., & Ciesla, F. J. 2014, Earth and Planetary Science Letters, 392, 28
- Greenberg et al. (1978) Greenberg, R., Hartmann, W. K., Chapman, C. R., & Wacker, J. F. 1978, Icarus, 35, 1
- Haisch et al. (2001) Haisch, K. E., Lada, E. A., & Lada, C. J. 2001, The Astrophysical Journal, 553, L153
- Hansen (2009) Hansen, B. M. S. 2009, The Astrophysical Journal, 703, 1131
- Hayashi (1981) Hayashi, C. 1981, Progress of Theoretical Physics Supplement, 70, 35
- Iwasaki et al. (2001) Iwasaki, K., Emori, H., Tanaka, H., & Nakazawa, K. 2001, American Astronomical Society, 33, 15.07
- Izidoro et al. (2014) Izidoro, A., Haghighipour, N., Winter, O. C., & Tsuchida, M. 2014, The Astrophysical Journal, 782, 31
- Izidoro et al. (2014) Izidoro, A., Haghighipour, N., Winter, O. C., & Tsuchida, M. 2014, ApJ, 782, 31
- Jacobson & Morbidelli (2014) Jacobson, S. A., & Morbidelli, A. 2014, Phil. Trans. R. Soc. A, 372, 0174
- Kenyon & Bromley (2006) Kenyon, S. J., & Bromley, B. C. 2006, AJ, 131, 1837
- Kleine et al. (2009) Kleine, T., Touboul, M., Bourdon, B., et al. 2009, Geochimica et Cosmochimica Acta, 73, 5150
- Kobayashi & Dauphas (2013) Kobayashi, H., & Dauphas, N. 2013, Icarus, 225, 122
- Kobayashi et al. (2010) Kobayashi, H., Tanaka, H., Krivov, A. V., & Inaba, S. 2010, Icarus, 209, 836
- Kokubo & Genda (2010) Kokubo, E., & Genda, H. 2010, The Astrophysical Journal Letters, 714, L21
- Kokubo & Ida (1998) Kokubo, E., & Ida, S. 1998, Icarus, 131, 171
- Kokubo & Ida (2000) —. 2000, Icarus, 143, 15
- Kominami & Ida (2002) Kominami, J., & Ida, S. 2002, American Astronomical Society, 33, 12.04
- Kominami & Ida (2004) Kominami, J., & Ida, S. 2004, Icarus, 167, 231
- Laskar (1997) Laskar, J. 1997, Astronomy and Astrophysics, 317, L75
- Leinhardt et al. (2015) Leinhardt, Z. M., Dobinson, J., Carter, P. J., & Lines, S. 2015, The Astrophysical Journal, 806, 23
- Leinhardt et al. (2009) Leinhardt, Z. M., Richardson, D. C., Lufkin, G., & Haseltine, J. 2009, Monthly Notices of the Royal Astronomical Society, 396, 718
- Leinhardt & Stewart (2012) Leinhardt, Z. M., & Stewart, S. T. 2012, ApJ, 745, 79
- Levison et al. (2012) Levison, H. F., Duncan, M. J., & Thommes, E. 2012, AJ, 144, 119
- Levison et al. (2015) Levison, H. F., Kretke, K. A., Walsh, K. J., & Bottke, W. F. 2015, Proceedings of the National Academy of Sciences, 112, 14180
- Levison et al. (2011) Levison, H. F., Morbidelli, A., Tsiganis, K., Nesvorný, D., & Gomes, R. 2011, The Astronomical Journal, 142, 152
- Lissauer (1987) Lissauer, J. J. 1987, Icarus, 69, 249
- Minton & Levison (2014) Minton, D. A., & Levison, H. F. 2014, Icarus, 232, 118
- Morbidelli et al. (2015) Morbidelli, A., Lambrechts, M., Jacobson, S., & Bitsch, B. 2015, Icarus, 258, 418
- Morbidelli et al. (2012) Morbidelli, A., Lunine, J., O’brien, D., Raymond, S., & Walsh, K. 2012, Annu. Rev. Earth. Planet. Sci., 40, 251
- Morishima (2015) Morishima, R. 2015, Icarus, 260, 368
- Movshovitz et al. (2016) Movshovitz, N., Nimmo, F., Korycansky, D. G., Asphaug, E., & Owen, J. M. 2016, Icarus, 275, 85
- O’brien et al. (2006) O’brien, D. P., Morbidelli, A., & Levison, H. F. 2006, Icarus, 184, 39
- Ormel et al. (2010) Ormel, C. W., Dullemond, C. P., & Spaans, M. 2010, Icarus, 210, 507
- Ormel & Kobayashi (2012) Ormel, C. W., & Kobayashi, H. 2012, ApJ, 747, 115
- Raymond et al. (2009) Raymond, S. N., Armitage, P. J., & Gorelick, N. 2009, ApJ, 699, L88
- Raymond et al. (2009) Raymond, S. N., O’brien, D. P., Morbidelli, A., & Kaib, N. A. 2009, Icarus, 203, 644
- Tanaka & Ward (2004) Tanaka, H., & Ward, W. R. 2004, The Astrophysical Journal, 602, 388
- Walsh et al. (2011) Walsh, K., Morbidelli, A., Raymond, S., O’brien, D., & Mandell, A. 2011, Nature, 475, 206
- Walsh & Levison (2016) Walsh, K. J., & Levison, H. F. 2016, The Astronomical Journal, 152, 68
- Weidenschilling et al. (1997) Weidenschilling, S. J., Spaute, D., Davis, D. R., Marzari, F., & Ohtsuki, K. 1997, Icarus, 128, 429
- Wetherill & Stewart (1993) Wetherill, G. W., & Stewart, G. R. 1993, Icarus, 106, 190
- Wisdom & Holman (1991) Wisdom, J., & Holman, M. 1991, Astronomical Journal, 102, 1528