Examining the Casimir puzzle with upgraded technique and advanced surface cleaning
Abstract
We performed measurements of the gradient of the Casimir force between Au-coated surfaces of a sphere and a plate by means of significantly upgraded dynamic atomic force microscope (AFM) based technique. By introducing combined cleaning procedure of interior surfaces of the vacuum chamber and the test bodies by means of UV light and Ar ions, we reached higher vacuum and eliminated the role of electrostatic patches. Furthermore, the use of much softer cantilever allowed a sixfold decrease of the systematic error in measuring the force gradient. The experimental data are compared with theoretical predictions of the Lifshitz theory taking into account corrections due to the inaccuracy of the proximity force approximation and that due to surface roughness. It is shown that the theoretical approach accounting for the relaxation properties of free electrons is excluded by the data up to a larger than previous sphere-plate separation of 820 nm, whereas an alternative approach is found in a very good agreement with the data. Importance of these results in connection with the foundations of quantum statistical physics is discussed.
The Casimir force originally predicted 1 between two uncharged ideal metal planes was later generalized for any two material bodies and explained as an effect of the zero-point and thermal fluctuations of the electromagnetic field along with the van der Waals force 2 (see the monograph 3 for further developments). Presently the Casimir force has been measured in numerous experiments to gain a fundamental understanding of the physics (see the reviews 4 ; 5 ; 6 ), and is proposed for use in the next generation of nanotechnological devices 7 ; 8 ; 9 ; 10 ; 11 ; 12 ; 13 .
A comparison between the measurement data of the most precise experiments and theoretical predictions of the Lifshits theory revealed a puzzling inconsistency of fundamental significance. It was realized 3 ; 4 ; 6 that the theory is in conflict with the data at separations below m if the real part of the conductivity of materials is taken into account in computations (at the moment there are no direct measurements of the Casimir interaction between metallic surfaces at separations above m). A good agreement between the theory and the data is regained if one neglects the low-frequency relaxation properties of free charge carriers and the dc conductivity in dielectrics (the most recent experiments demonstrating this result are described in Refs. 14 ; 15 ; 16 ; 17 ; 18 ; 19 ; 20 ; 21 ). In all these experiments with the exception of Ref. 20 the difference between the two alternative theoretical predictions does not exceed 5%. As a result, there were attempts to explain the Casimir puzzle as the role of some unaccounted background effect, i.e., by an additional force due to surface patches 22 ; 23 ; 24 . Experiments with magnetic test bodies 17 ; 18 ; 19 (and especially Ref. 20 where the alternative theoretical predictions diverged by up to a factor of 1000) have shown, however, that the Casimir puzzle is not governed by the role of surface patches and other background effects.
In this paper, we describe measurements of the gradient of the Casimir force between Au-coated surfaces of a sphere and a plate by means of a significantly upgraded dynamic AFM based technique with in situ UV and Ar ion cleaned surfaces of the test bodies. The components of the setup reported previously 16 are upgraded by incorporating a UV lamp and an Ar-ion gun. This makes possible the removal of contaminants from all interior surfaces of the vacuum chamber and a significant decrease in the residual potential difference between the test bodies (a factor of 10 compared to Ref. 16 ). Furthermore, the force sensitivity was improved by the preparation and use of a cantilever with a smaller (factor of 10) spring constant than in the previous work 16 . As a result, the calibration constant in the present measurements is by an order of magnitude larger than in Ref. 16 leading to smaller (by a factor of 6) systematic error in measuring the gradient of the Casimir force. After a comparison between the measurement data and theory, these improvements allowed clear discrimination between two theoretical approaches mentioned above up to the separation distance of 820 nm (compared with 420 nm in Ref. 16 ).
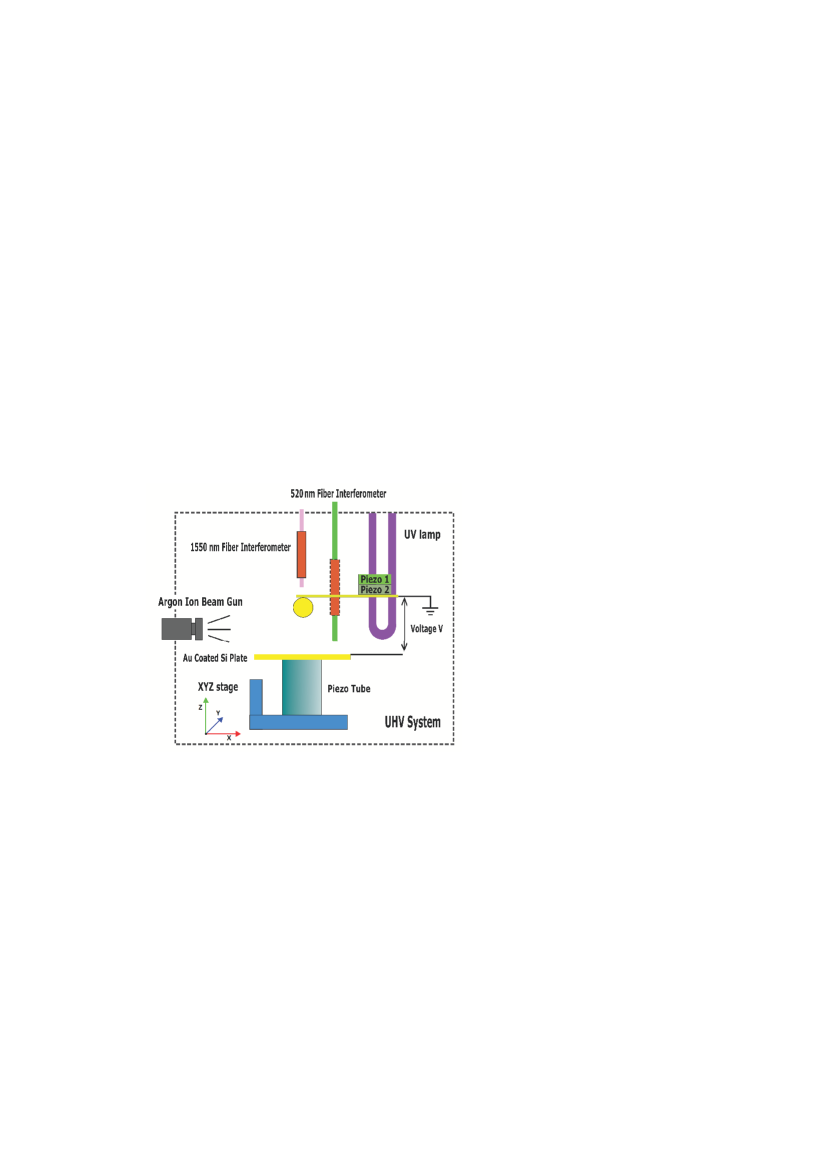
The schematic of the upgraded experimental setup is presented in Fig. 1. Below we remark only on the novel elements. Additional details of the setup and description of the calibration procedures can be found in Refs. 16 ; 21 . The gradient of the Casimir force was measured between the Au-coated hollow glass sphere of m radius (measured by means of scanning electron microscope after the experiment was completed) and Au-coated silicon plate. The hollow glass spheres were made from liquid phase and therefore are almost spherical with the difference along two perpendicular axes being less than or equal to 0.1%, i.e., of the order of the radius measurement error. The sphere is attached to the electrically grounded cantilever. The spring constant of this cantilever was reduced by decreasing its thickness and width by means of etching with 60% KOH solution at a temperature of C for 55 seconds. Relatively high concentration and temperature were used to obtain smooth surfaces after etching 25 .
The use of the polished silicon wafer as the base plate instead of sapphire or fused silica plates used in previous measurements 16 ; 21 and an -beam evaporator for making the Au coatings instead of a thermal evaporator allowed a decrease in the surface roughness by up to a factor of 2. The r.m.s. roughness on the sphere and the plate, measured after the experiment was completed, is nm and nm (compared with nm and nm in Ref. 16 ). The Au-coated plate is mounted on a piezoelectric tube which helps to precisely control its position (see Fig. 1). In its turn, the tube is mounted on a XYZ linear translational stage used for the coarse approach of the plate to the sphere. The cantilever motion is monitored with a laser optical interferometer. The laser light source has a wavelength of 1550 nm. The second interferometer using a wavelength of 520 nm serves to measure the movement of the Au-coated plate (see Fig. 1).
The major improvement, as compared to previous experiments, is the UV followed by Ar-ion cleaning of the test bodies and surfaces inside the vacuum chamber. The removal of contamination on the Au sphere-plate surfaces using only Ar-ion gun has been already studied in Ref. 21 . As a result, the residual potential difference between a sphere and a plate was lowered by an order of magnitude leading to a reduced role of electrostatic forces discussed in the literature 22 ; 23 . In the Ar-ion cleaning, however, the ions are focused on the interacting sphere-plate surfaces and the adsorbed contaminants on the experimental chamber walls are not completely removed. Thus, over longer periods of time, the desorption of contaminants from the chamber walls leads to the redeposition of contaminant gas molecules on the Au surfaces of test bodies resulting in increase of residual electric potential difference .
It has been shown 26 ; 27 ; 28 ; 29 ; 30 ; 31 that the water and organic contaminants can be removed from the chamber walls, as well as the sphere-plate surfaces, with the use of UV light. We used the UV lamp (UV B-100 Water Desorption System, RBD Instruments, Inc.) with dimensions of length and diameter. It is installed on the top of the chamber as is shown in Fig. 1. The emitted wavelengths are a combination of 185 nm (2 W power) and 254 nm (5 W power). The former is absorbed by oxygen and leads to the generation of highly reactive ozone, whereas the letter is absorbed by most hydrocarbons and ozone leading to their ionization and desorption from surfaces.
The combined UV/Ar cleaning procedure was performed as follows. The vacuum chamber was first pumped down to pressure of about Torr using the scroll mechanical pump and the turbo pump (see Ref. 16 for a description of the vacuum system which also includes the ion pump). Then the UV lamp was turned on for 10 min. and because of the formation of ozone, atomic oxygen and resulting oxidation of surface hydrocarbons to more volatile species, the chamber pressure rises to Torr. The volatile species were pumped out by the turbo and mechanical pumps leaving Au surfaces and chamber walls free of water and organic contaminants. A rough measurement of for a sphere-plate separation of m shows that the UV cleaning leads to an increase of the residual potential difference from mV to higher values of approximately 100–200 mV (measured after the UV lamp was turned off for 60 minutes). This can be explained by the exposed inorganic contaminants on the sample surfaces.
To remove the latter and any remaining organics, Ar-ion-beam bombardment 21 ; 31 ; 32 was used after the UV cleaning process. The Ar ion gun was installed horizontally on the left side of the chamber as shown in Fig. 1. The sphere-plate distance was increased up to m. Note that during both UV and Ar-ion cleaning the ion pump was shut off to avoid contamination of its electrodes. To initiate the process, the Ar gas was released into the chamber until the pressure reached Torr. The turbo pump gate valve was half closed to keep the pressure constant. The Ar ions were accelerated under 500 V electric field. The kinetic energy of the grazing incidence Ar ions was high enough to break chemical bonds of the Au oxide and organic molecules, but low enough to prevent any sputtering of the Au surface. The cleaning was done in 5 min. steps. After each step the turbo pump gate valve was opened allowing the pressure to reach Torr in less than 30 min. Next a rough value of was measured. This process was repeated till reached near zero. The final measured value was mV. To reduce mechanical noise, the ion pump was turned on and the turbo pump and mechanical pump were first valved and then turned off. Thus, a combination of in situ UV and Ar-ion cleaning allows us to achieve ultra high vacuum Torr resulting in clean sphere-plate surfaces with very low and time stable (the drift rate of was measured to be less than 0.005 mV/min).
The force gradient between the sphere and plate was measured through the shift of the resonant frequency of the cantilever with attached sphere () which was recorded as a function of the sphere-plate separation in 1 nm steps. The relative sphere-plate distance was controlled by application of voltage to the piezoelectric tube supporting the plate (see Fig. 1). The distance moved by the plate was calibrated using the interferencer fringes from the 520 nm fiber interferometer. In doing so the absolute sphere-plate separation , where is the separation at the point of closest approach.
For the force gradient measurements, 11 voltages () were sequentially applied to the plate and the cantilever frequency shift was measured as a function of the plate separation. The plate movement was corrected for the mechanical drift found to be –0.00575 nm/s as described in Ref. 16 . To subtract any systematic background in the frequency shift due to the noise coming from the plate movement, the sphere-plate separation was increased to m, where the interaction force gradients are well beyond the experimental sensitivity, and the experiments were repeated with a voltage applied to the plate. After averaging 8 frequency shift measurements the background change in frequency due to the mechanical movement of the plate can be found to be linear at Hz/nm. This small background noise signal due to the plate movement was subtracted from all frequency shift signals.
The frequency shift is given by
| (1) |
where the calibration constant , is the known function of the electric force in the sphere-plate geometry 3 ; 16 and is the Casimir force. At any given separation, is proportional to the square of the voltage difference. Therefore the parameters and can be found by fitting parabolas and be plotted as functions of distance (see Ref. 16 for details). The obtained at each separation are shown in Fig. 2 resulting in the mean value mV. Then the best fits of the exact expression for to the measured data was done leading to nm and s/kg. The latter is almost an order of magnitude larger than the calibration constant s/kg in Ref. 16 . This increase is connected with the fact that now we use a much more sensitive cantilever with a smaller (by a factor of 10) spring constant. In previous reports performed with specially selected samples, possessing constant but larger , the gradient of the total measured force was also larger. However, the gradients of the Casimir force obtained in Ref. 16 after a subtraction of electrostatic contributions are in good agreement with the measurement results obtained here at higher precision over the wider separation region.
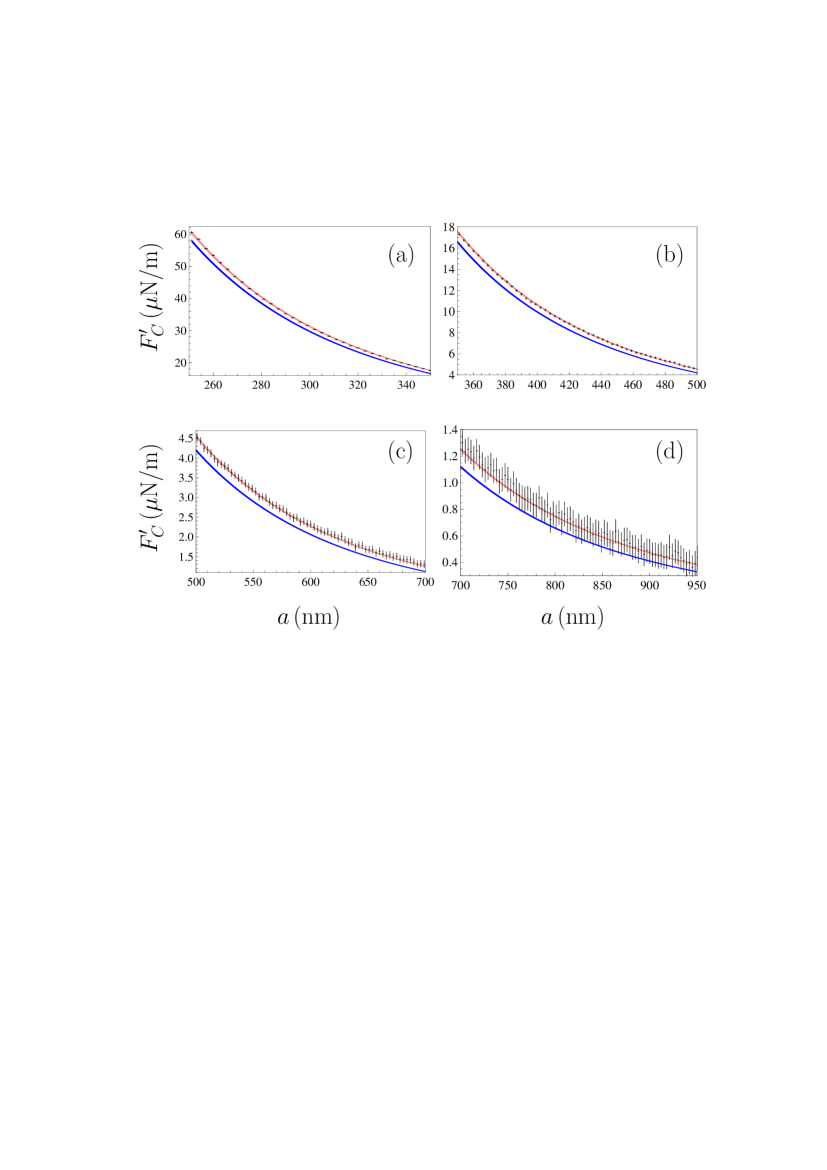
After completion of the calibration, the force gradient of the Casimir force was calculated with a step of 1 nm using Eq. (1) and the above parameters , and . The obtained results are presented in Fig. 3(a,b,c,d) as crosses over defferent separation regions. The arms of the crosses show the total experimental errors determined at the 67% confidence level (random and systematic errors added in quadrature). In so doing, the systematic error in the measured gradient of the Casimir force is mostly determined by the systematic error in measuring the frequency shift which is equal to rad/s in this experiment.
The gradient of the Casimir force in the experimental configuration was computed in the framework of the Lifshitz theory taking into account corrections to the proximity force approximation and surface roughness. The thicknesses of the Au coatings on the sphere and the plate were nm and nm, respectively. This is more than sufficient for these coatings to be considered as infinitely thick. As a result, the gradient of the Casimir force is expressed as
| (2) |
where is the Casimir pressure between two Au semispaces and the function quantifies corrections to the proximity force approximation determined using different approaches in Refs. 33 ; 33A ; 33B ; 34I ; 34 (here we use the computational results for obtained in Ref. 34I for the force gradient). The Casimir pressure at temperature is given by the Lifshitz formula 2 ; 3 ; 4 :
| (3) |
where is the Boltzmann constant, is the magnitude of wave vector projection on the plane of plates, , () are the Matsubara frequencies, the prime on the summation sign divides the term with by 2, and the sum in is over the two independent polarizations of the electromagnetic field, transverse magnetic () and transverse electric (). The reflection coefficients are expressed via the dielectric permittivities of Au calculated at the imaginary Matsubara frequencies
| (4) |
where .
Computations with Eqs. (2)–(4) have been made at the C which is the experiment temperature. The values of were obtained from the tabulated optical data for Au extrapolated down to zero frequency either by the Drude model taking into account the energy losses of conduction electrons or by the plasma model which neglects these losses 3 ; 4 . The respective values for the function 34I have been used in both versions of the computations. The computational results are shown in Fig. 3 by the upper and lower bands computed when using the optical data extrapolated by the plasma and Drude model, respectively. The widths of the bands reflect the theoretical errors which are mostly determined by the inaccuracies in the optical data.
As is seen in Fig. 3, the predictions of the Lifshitz theory with the inclusion of energy losses of conduction electrons are excluded by the measurement data up to the separation distance nm. At the same time, the predictions of the same theory with the energy losses of the conduction electrons neglected are in excellent agreement with the data. The same conclusion, but at separations up to 420 nm was obtained earlier by means of the dynamic AFM 16 and at separations up to 750 nm by means of a micromachined oscillator 3 ; 4 ; 20 ; D1 ; D2 .
To conclude, in this experiment we reconsider the problem which remains a long standing puzzle. In doing so, special experimental efforts have been taken to avoid any impact of electrostatic patches on the measurement results for the Casimir force. On the theoretical side, due to the long-term efforts of several authors it was shown that the influence of deviations from the proximity force approximation 33B ; 34I , as well as the role of surface roughness 3 ; 4 ; 35 ; 36 , does not change the obtained results. Thus, the Casimir puzzle assumes a fundamental importance casting doubts on the basic assumption of quantum statistical physics that a material system responds similarly to electromagnetic fields with nonzero field strength and to fluctuating fields possessing zero field strength and nonzero dispersion. The complete resolution of this problem requires measurements at large separations. The present experiment is a step forward in this direction.
The work of M. L., J. X. and U. M. was partially supported by the NSF grant PHY-1607749. M. L., J. X. and U. M. acknowledge discussions with R. Schafer and Tianbai Li. V. M. M. was partially funded by the Russian Foundation for Basic Research, Grant No. 19-02-00453 A. His work was also partically supported by the Russian Government Program of Competitive Growth of Kazan Federal University.
References
- (1) H. B. G. Casimir, Proc. Kon. Ned. Akad. Wet. B 51, 793 (1948).
- (2) E. M. Lifshitz, Zh. Eksp. Teor. Fiz. 29, 94 (1955) [Sov. Phys. JETP 2, 73 (1956)].
- (3) M. Bordag, G. L. Klimchitskaya, U. Mohideen, and V. M. Mostepanenko, Advances in the Casimir Effect (Oxford University Press, Oxford, 2015).
- (4) G. L. Klimchitskaya, U. Mohideen, and V. M. Mostepanenko, Rev. Mod. Phys. 81, 1827 (2009).
- (5) A. W. Rodrigues, F. Capasso, and S. G. Johnson, Nature Photonics 5, 211 (2011).
- (6) L. M. Woods, D. A. R. Dalvit, A. Tkatchenko, P. Rodriguez-Lopez, A. W. Rodriguez, and R. Podgornik, Rev. Mod. Phys. 88, 045003 (2016).
- (7) H. B. Chan, V. A. Aksyuk, R. N. Kleiman, D. J. Bishop, and F. Capasso, Science 291, 1941 (2001).
- (8) R. Esquivel-Sirvent and R. Pérez-Pascual, Eur. Phys. J. B 86, 467 (2013).
- (9) W. Broer, G. Palasantzas, J. Knoester, and V. B. Svetovoy, Phys. Rev. B 87, 125413 (2013).
- (10) M. Sedighi, W. Broer, G. Palasantzas, and B. J. Kooi, Phys. Rev. B 88, 165423 (2013).
- (11) W. Broer, H. Waalkens, V. B. Svetovoy, J. Knoester, and G. Palasantzas, Phys. Rev. Applied 4, 054016 (2015).
- (12) L. Tang, M. Wang, C. Y. Ng, M. Nicolic, C. T. Chan, A. W. Rodriguez, and H. B. Chan, Nature Photonics 11, 97 (2017).
- (13) G. L. Klimchitskaya, V. M. Mostepanenko, V. M. Petrov, and T. Tschudi, Phys. Rev. Applied 10, 014010 (2018).
- (14) C.-C. Chang, A. A. Banishev, G. L. Klimchitskaya, V. M. Mostepanenko, and U. Mohideen, Phys. Rev. Lett. 107, 090403 (2011).
- (15) A. A. Banishev, C.-C. Chang, R. Castillo-Garza, G. L. Klimchitskaya, V. M. Mostepanenko, and U. Mohideen, Phys. Rev. B 85, 045436 (2012).
- (16) C.-C. Chang, A. A. Banishev, R. Castillo-Garza, G. L. Klimchitskaya, V. M. Mostepanenko, and U. Mohideen, Phys. Rev. B 85, 165443 (2012).
- (17) A. A. Banishev, C.-C. Chang, G. L. Klimchitskaya, V. M. Mostepanenko, and U. Mohideen, Phys. Rev. B 85, 195422 (2012).
- (18) A. A. Banishev, G. L. Klimchitskaya, V. M. Mostepanenko, and U. Mohideen, Phys. Rev. Lett. 110, 137401 (2013).
- (19) A. A. Banishev, G. L. Klimchitskaya, V. M. Mostepanenko, and U. Mohideen, Phys. Rev. B 88, 155410 (2013).
- (20) G. Bimonte, D. López, and R. S. Decca, Phys. Rev. B 93, 184434 (2016).
- (21) Jun Xu, G. L. Klimchitskaya, V. M. Mostepanenko, and U. Mohideen, Phys. Rev. A 97, 032501 (2018).
- (22) C. C. Speake and C. Trenkel, Phys. Rev. Lett. 90, 160403 (2003).
- (23) R. O. Behunin, D. A. R. Dalvit, R. S. Decca, C. Genet, I. W. Jung, A. Lambrecht, A. Liscio, D. López, S. Reynaud, G. Schnoering, G. Voisin, and Y. Zeng, Phys. Rev. A 90, 062115 (2014).
- (24) R. O. Behunin, D. A. R. Dalvit, R. S. Decca, and C. C. Speake, Phys. Rev. D 89, 051301(R) (2014).
- (25) E. D. Palik, O. J. Glembocki, I. Heard, P. S. Burno, and L. Tenerz, J. Appl. Phys. 70, 3291 (1991).
- (26) J. R. Vig, J. Vac. Sci. Technol. A 3, 1027 (1985).
- (27) D. E. King, J. Vac. Sci. Technol. A 13, 1247 (1995).
- (28) A. Kroser and M. Rodahl, J. Vac. Sci. Technol. A 15, 1704 (1997).
- (29) N. S. McIntyre, R. D. Davidson, T. L. Walzak, R. Williston, M. Westcott, and A. Pekarsky, J. Vac. Sci. Technol. A 9, 1355 (1991).
- (30) C. R. Koebley, R. A. Outlaw, and R. R. Dellwo, J. Vac. Sci. Technol. A 30, 060601 (2012).
- (31) A. Rizzi and K. L. Mittal (eds.), Handbook of Adhesive Technology (CRC Press, Boca Raton, FL, 2003).
- (32) H. Lüth, Surfaces and Interfaces of Solid Materials (Springer, Berlin, 2015).
- (33) G. Bimonte, T. Emig, R. L. Jaffe, and M. Kardar, Europhys. Lett. 97, 50001 (2012).
- (34) G. Bimonte, T. Emig, and M. Kardar, Appl. Phys. Lett. 100, 074110 (2012).
- (35) G. Bimonte, Europhys. Lett. 118, 20002 (2017).
- (36) M. Hartman, G.-L. Ingold, and P. A. Maia Neto, Phys. Rev. Lett. 119, 043901 (2017).
- (37) V. Hennig, B. Spreng, M. Hartman, G.-L. Ingold, and P. A. Maia Neto, J. Opt. Soc. Amer. B 36, C77 (2019).
- (38) R. S. Decca, D. López, E. Fischbach, G. L. Klimchitskaya, D. E. Krause, and V. M. Mostepanenko, Phys. Rev. D 75, 077101 (2007).
- (39) R. S. Decca, D. López, E. Fischbach, G. L. Klimchitskaya, D. E. Krause, and V. M. Mostepanenko, Eur. Phys. J. C 51, 963 (2007).
- (40) M. Bordag, G. L. Klimchitskaya, and V. M. Mostepanenko, Int. J. Mod. Phys. A 10, 2661 (1995).
- (41) W. Broer, G. Palasantzas, J. Knoester, and V. Svetovoy, Phys. Rev. B 85, 155410 (2012).