Specific Heat Signature of the Berezinskii-Kosterlitz-Thouless Transition in Ultrathin Superconducting Films
Abstract
The Berezinskii-Kosterlitz-Thouless (BKT) transition is expected to have a clear signature on the specific heat. The singularity at the transition temperature is predicted to be immeasurable, and a broad non-universal peak is expected at . Up to date this has not been observed in two-dimensional superconductors. We use a unique highly sensitive technique to measure the specific heat of ultrathin Pb films. We find that thick films exhibit a specific heat jump at that is consistent with BCS theory. As the film thickness is reduced below the superconducting coherence length and the systems enters the 2D limit the specific heat reveals BKT-like behavior. We discuss these observations in the framework of the continuous BCS-BKT crossover as a function of film thickness.
Within the 2D XY model, a second order phase transition cannot take place due to lack of long range phase coherence and the dominance of phase fluctuations (Goldstone modes). Nevertheless, FBerezinskii and Kosterlitz-Thouless (BKT) berezinskii ; KT showed that a low-temperature quasi-ordered phase of bound vortex pairs exists leading to an infinite order phase-transition from bound vortex-antivortex pairs at low temperatures to unpaired vortices above the BKT critical temperature . From the thermodynamic point of view BKT theory predicts that the specific heat, , is characterized by an immeasurable essential singularity at and a non-universal peak at associated with the liberation of entropy due to the unbounding of vortex-antivortex pairs chaikin . Work on this transition led to the 2016 Nobel Prize in Physics being awarded to Kosterlitz and Thouless.
A paradigmatic system in which the BKT transition may be expected is a 2D superconducting film. Evidences for the BKT physics have been reported in transport measurements via analysis of the - characteristics or by studying the perpendicular magnetoresistance curves min ; kadin ; wolf ; hebard . However up to date there have been no experimental thermodynamic signatures of this transition especially concerning 2D superconducting films. This requires a highly sensitive thermal experiment which is able to resolve the specific heat of ultrathin films in the limit of 2D superconductivity bourgeois2005 ; poran ; poran2 .
Here we report on specific heat, , measurements performed on ultrathin superconducting films. We utilize a unique experimental setup based on a suspended silicone membrane substrate that enables to measure of Pb films with thicknesses ranging from 1.2 nm to 56 nm. We show that the thicker films can be well described by the BCS theory for strong coupled superconductors. In particular, they exhibit a specific heat jump at the critical temperature, , characteristic of the second order phase transition. Much thinner films, on the other hand, do not posses a measurable jump at but are rather characterized by a broad peak at indicating the presence of an excess of entropy. These results are interpreted as thermodynamic signatures for a BCS-BKT crossover as a function of film thickness.
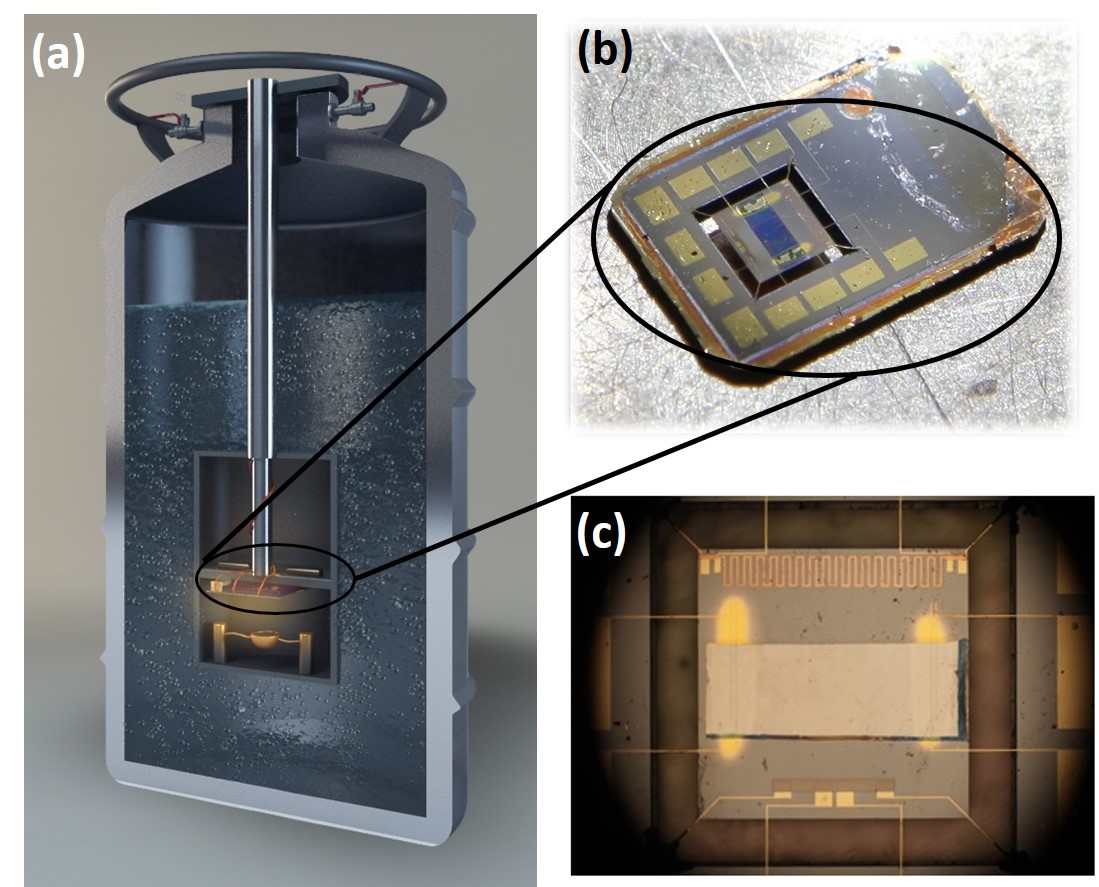
The samples used in this work were sets of ultrathin Pb films having different thickness obtained by the quench condensation technique strongin ; dynes1978 ; dynes1 ; Goldman89 ; olivier i.e. sequential evaporations of ultrathin films on a cryogenically cooled substrate without thermal cycling to room temperature or exposing the film to atmosphere (see Fig. 1(a) and Supplemental Materials SM ). This allows in-situ sequential depositions under UHV conditions and simultaneous transport and thermal measurements on a single sample. Due to its unique advantages, this experimental method allows the study of the thermodynamic properties of the superconducting transition in ultra-thin layers as a function of thickness .
The Pb thin films were evaporated layer by layer onto a calorimetric membrane sensor, after the deposition of an adhesion layer (0.5 nm of Sb) favoring the continuity of the superconducting films. The thermal sensor was composed of a thin silicon membrane with a thickness of about 5 m, suspended by 12 arms for mechanical support as well as for electrical connections to the heater, thermometer and the evaporated sample on the membrane therm (see Fig. 1(b) and (c)). Using this setup we were able to measure simultaneously the resistance per square using four probe techniques and the heat capacity, .
The heat capacity was measured using an ac calorimetry technique, with sensitivity of a few tens of attoJoule per Kelvin bourgeois2005 ; poran ; poran2 , of 22 sequential layers of Pb. The parameters of all layers are summarized in the table of the Supplementary Materials SM , where more details of the experiment can be found.
Fig. 2(a) shows resistance versus temperature curves of a set of quench condensed Pb films with thicknesses ranging between 1.2 and 56 nm. From these measurements, we extracted the critical temperature, , defined as the temperature at which resistance dropped to of its value at K. increased monotonically with increasing thickness of the lead layer, . Our thinnest film ( nm) exhibited K while films with nm had critical temperatures close to that of bulk Pb K. These values are in agreement with previous studies on ultrathin quench condensed Pb films Goldman89 . The heat capacity () measurements of the same films are shown in Fig. 2(b), they are obtained after subtraction of the membrane heat capacity (Si, heater and thermometer, see Supplemental Materials SM ).
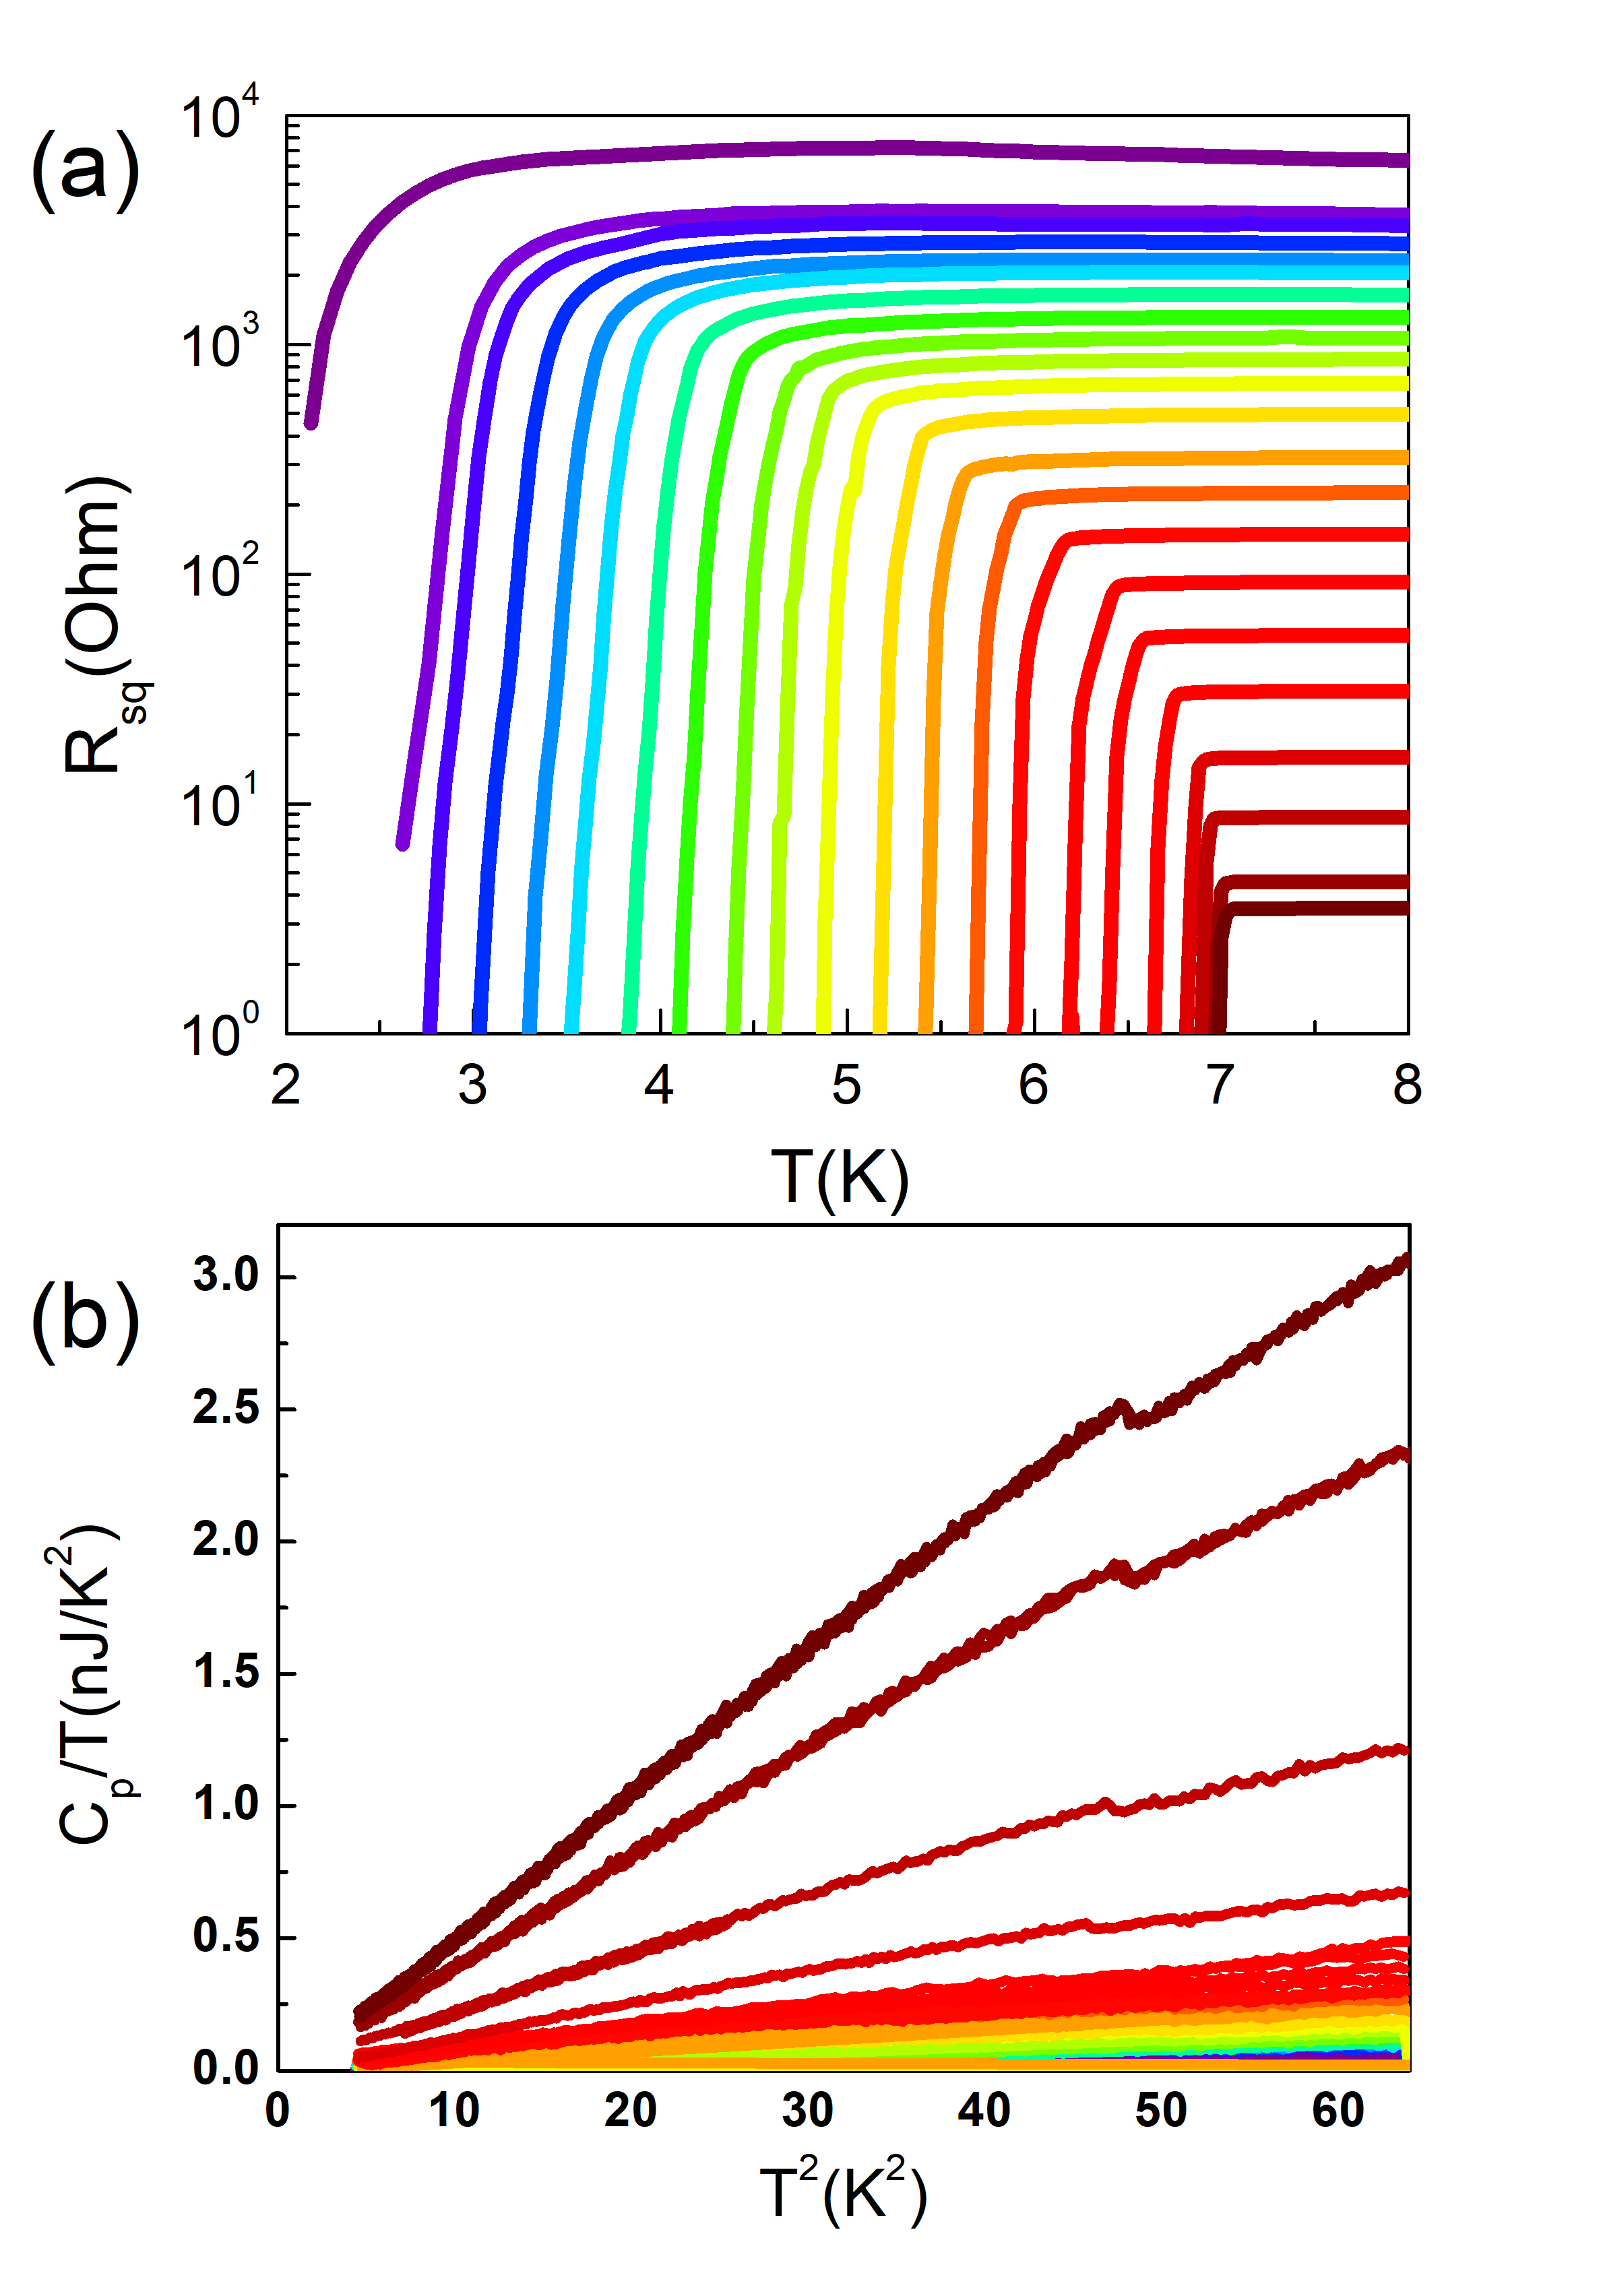
The heat capacity of a metallic sample is expected to follow the well known form:
| (1) |
where and stand for the electron and phonon heat capacities coefficients respectively. For this reason the data is plotted as versus resulting in a linear normal-state curve above . The heat capacity increased with film thickness and at high enough thickness, nm (stage 18 and above), we observed a jump associated with the superconductor second order phase transition. The temperature position of the jump is consistent with the slight decrease of with decreasing thickness in this regime (see Fig. 2(a)). The amplitude of the jump, , decreases with decreasing thickness until for nm the jump becomes immeasurable, smaller than the noise. We note, however, that even for the thickest film (layer 22, nm) the ratio between the jump amplitude and the normal state heat capacity at , is much smaller than the expected BCS value of 1.4 obtained for bulk Pb for instance Shiffman2. Like for Nb Brown and Al Douglas , this indicates that the heat capacity of amorphous Pb films is largely dominated by the phonon contribution.
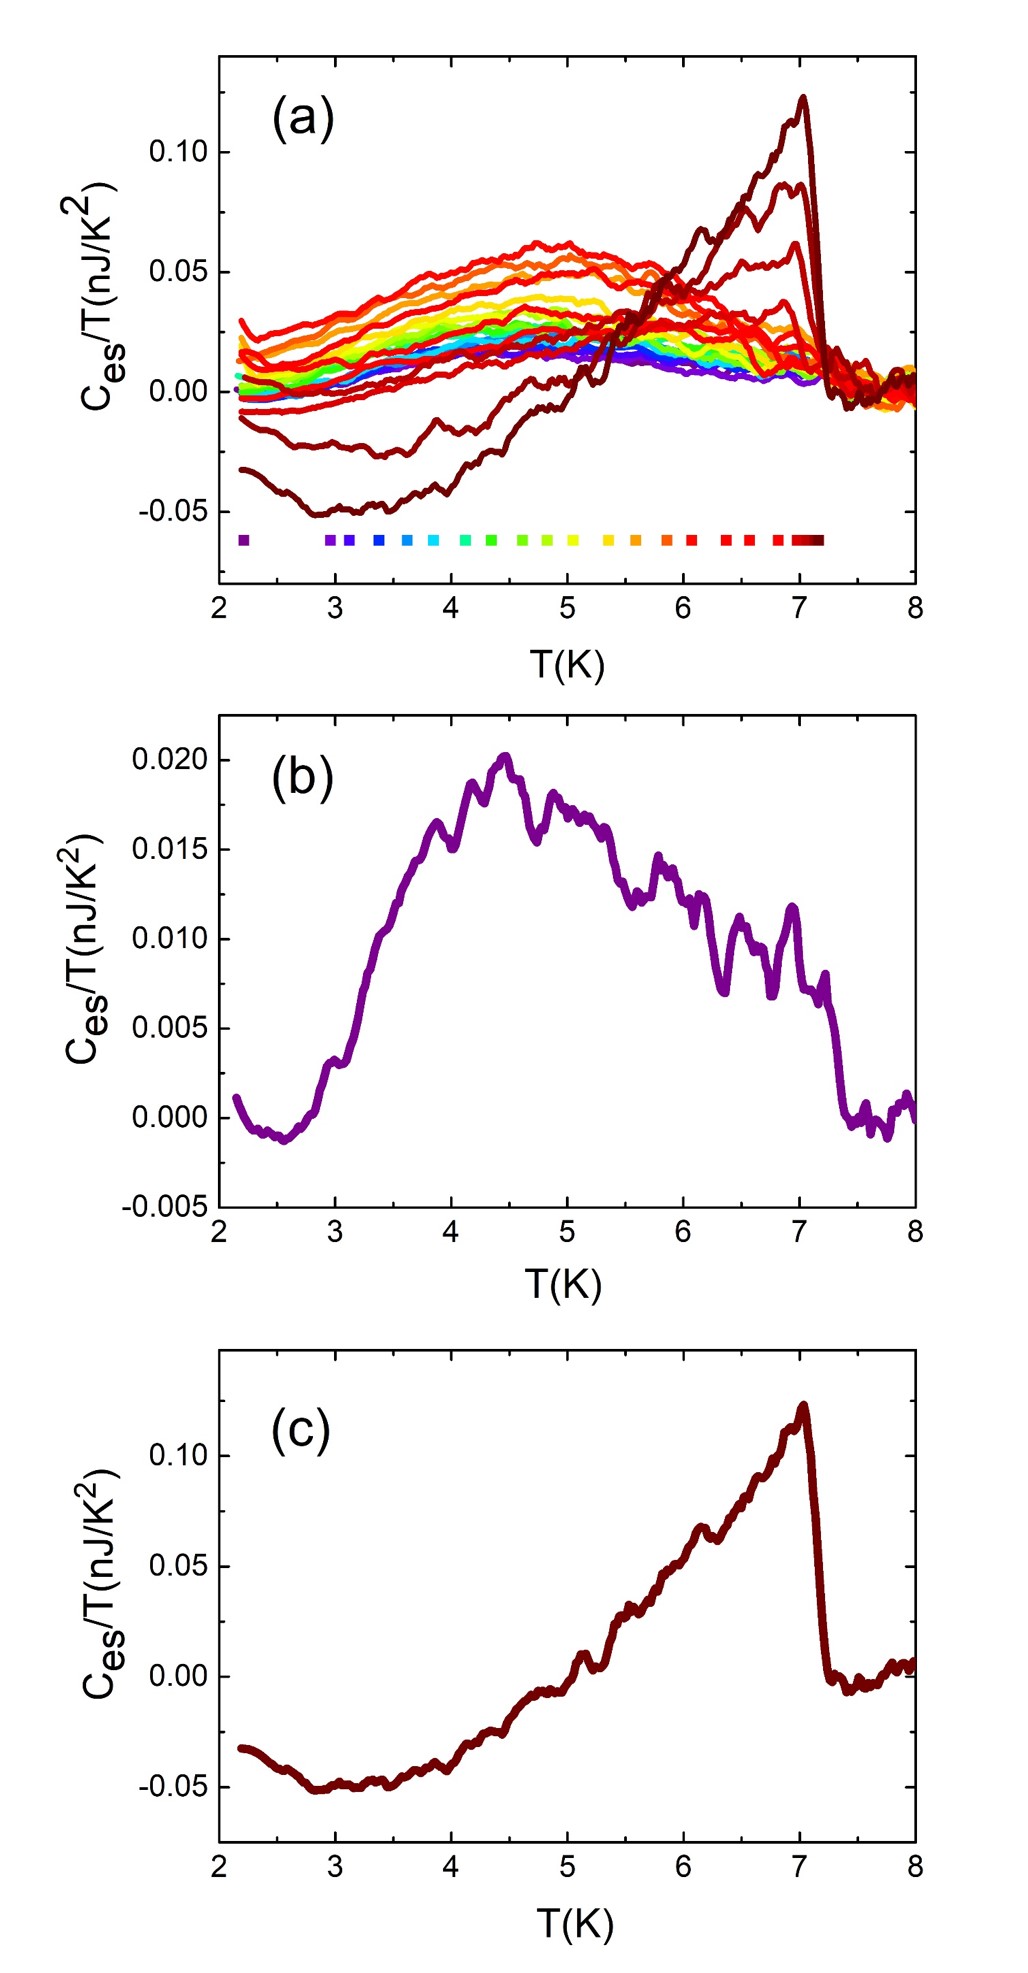
In order to focus only on the contribution to the heat capacity from electrons in the superconducting state we subtract the normal state , extracted from the linear slope in above K, from each respective curve of Fig. 2(b) thus obtaining . for the different layers are shown in Fig. 3(a). versus for the thinnest and thickest films are shown in panels (b) and (c) of Fig. 3 respectively. The curves for the thickest films are consistent with results obtained on bulk Pb samples Shiffman2.
For obtaining the specific heat, , from the measured heat capacity can be achieved by dividing the curve of each layer in Fig. 3(a) by its mass: . versus curves for all layers are shown in Fig. 4. It is illustrating that the specific heat jump amplitude for the thicker films is very close to that observed in bulk Pb samples, mJ.g-1.K-1 as shown in the Fig. 4(b) (see also Supplemental Materials SM ). This is in stark contrast to results obtained on granular Pb films poran2 for which was found to be larger than the bulk value by up to a factor of eight. As the film is thinned, becomes immeasurable and an excess specific heat peak emerges with a temperature region that extends up to K. These results are consistent with a crossover from 3D BCS physics, characterized by K, and to 2D BKT physics with K for the thinnest films while the intermediate layers show a mixture of both.
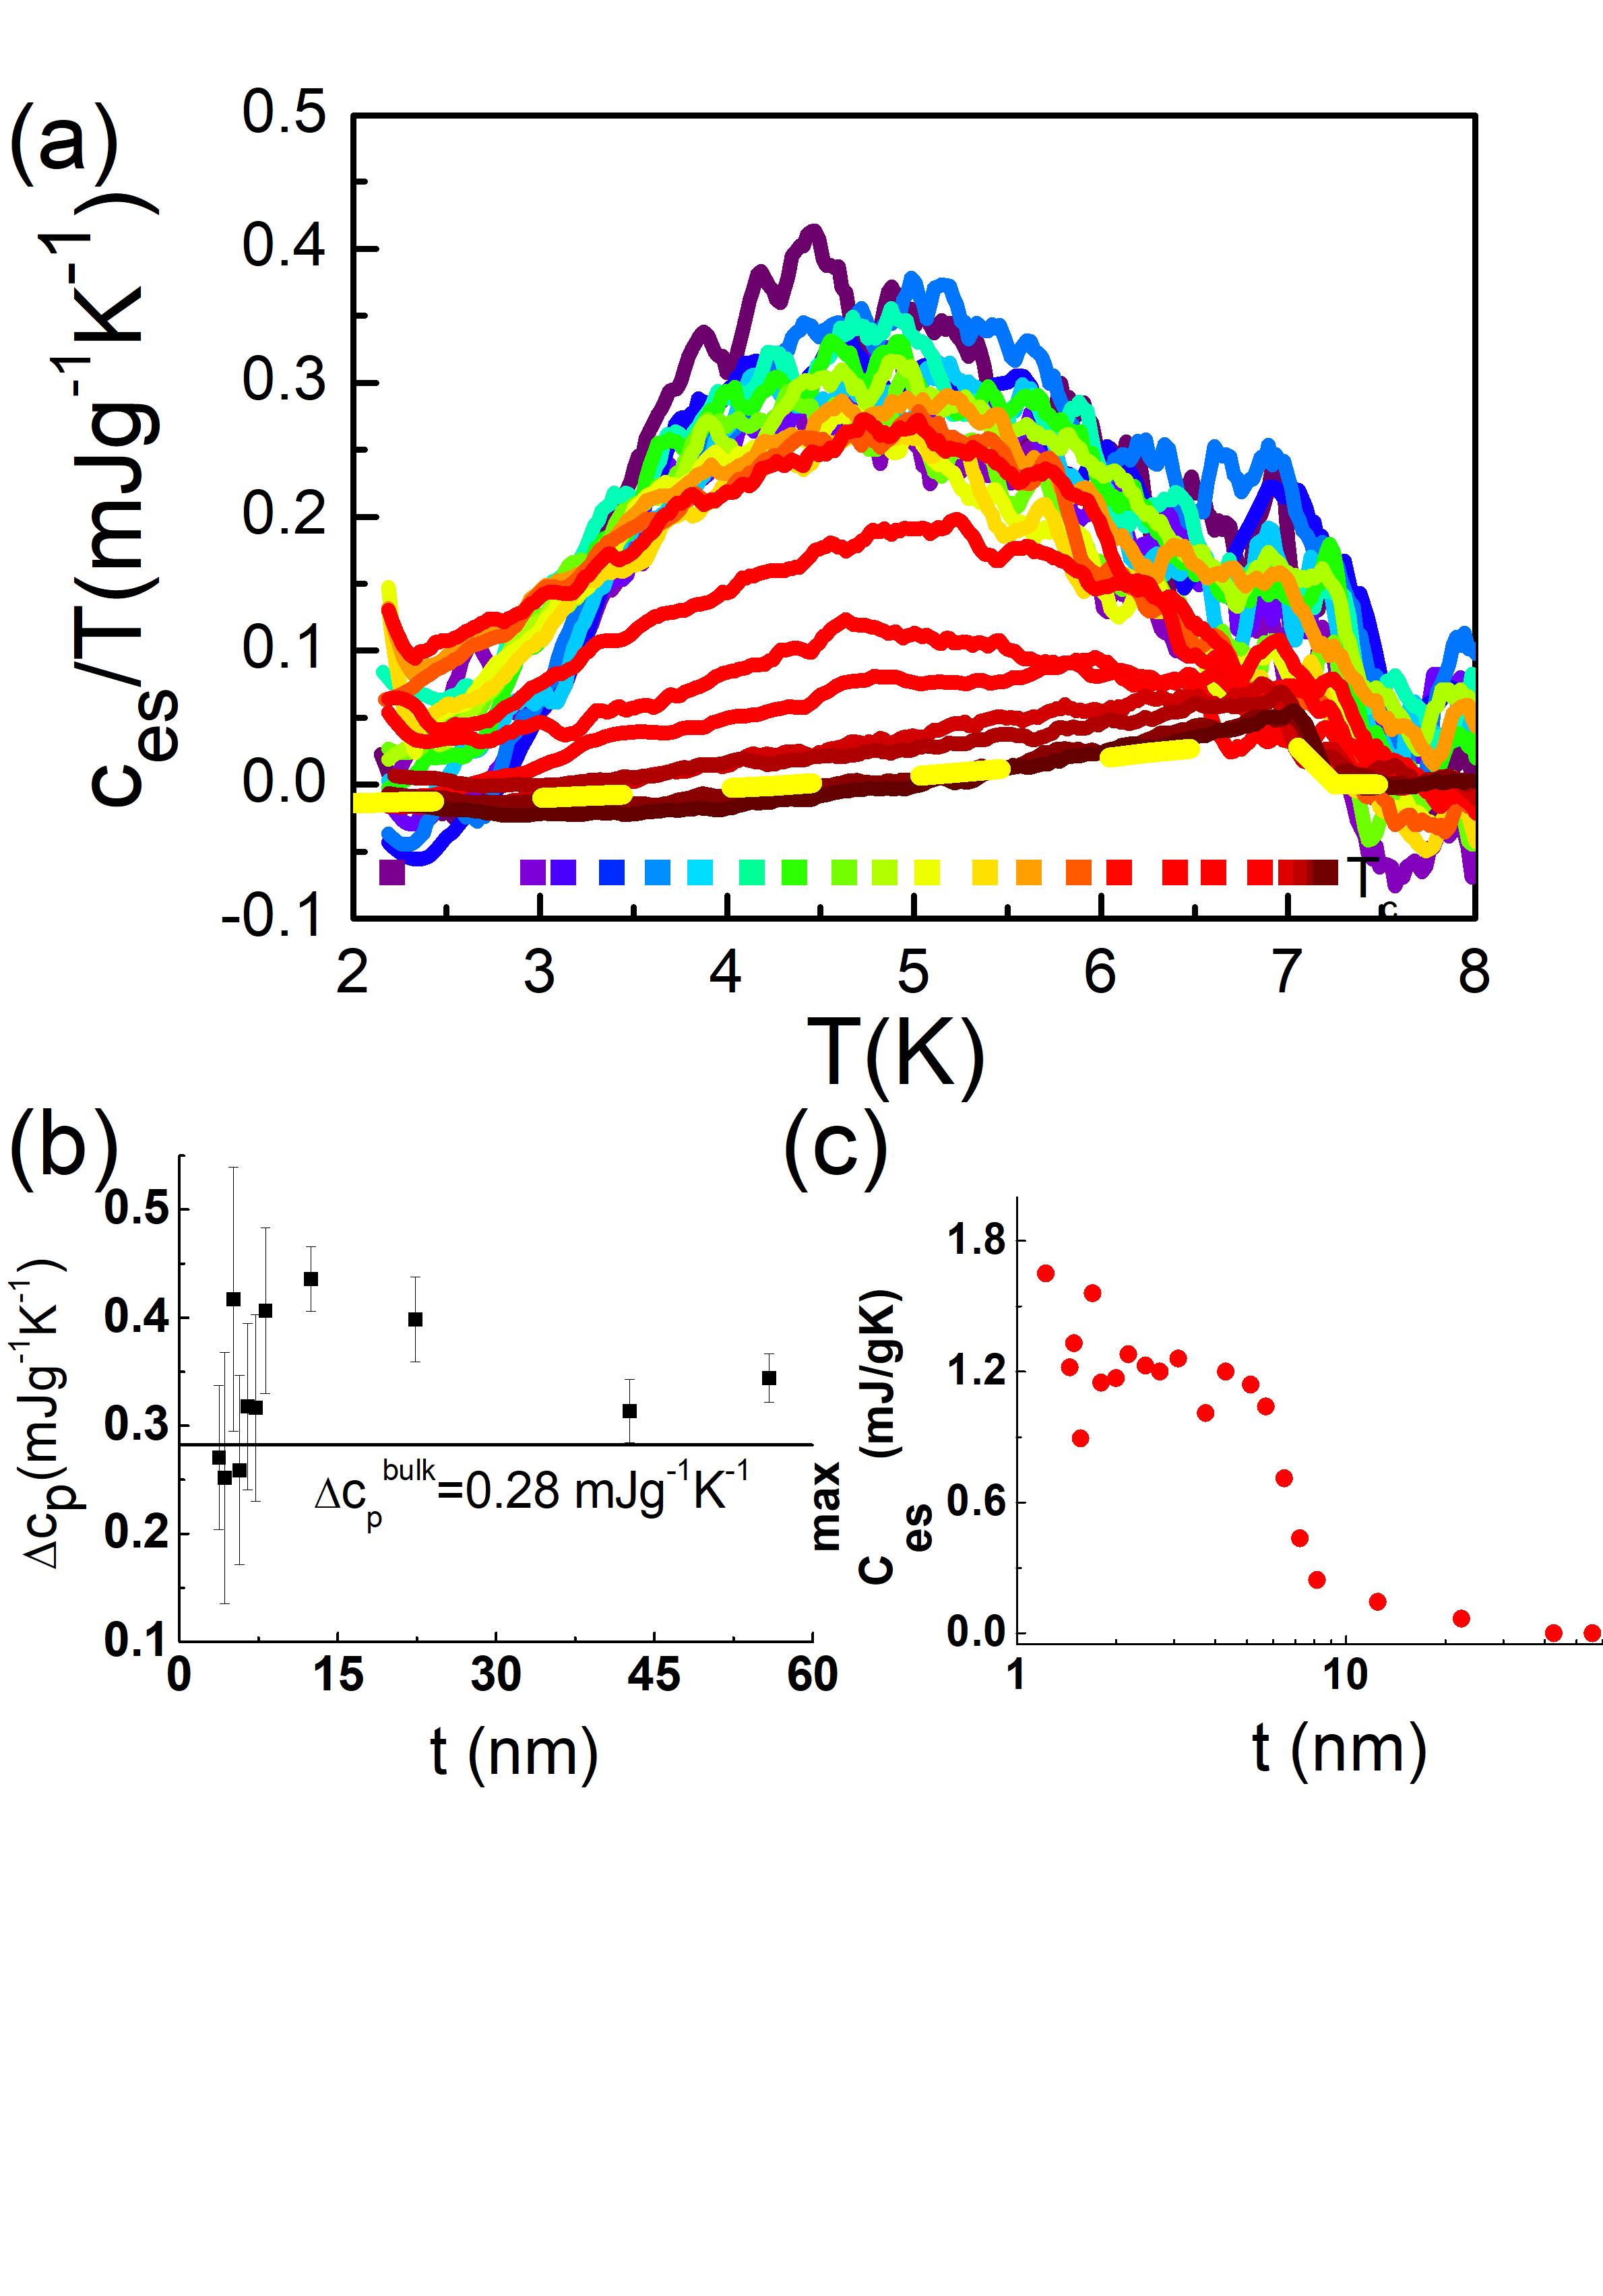
The representation shown in Fig. 4 highlights the importance of the broad peaks which become more significant as the thickness of the layer is reduced. The magnitude of this peak increases sharply for nm and saturates for nm as depicted in Fig. 4(c). This saturation of the specific heat peak amplitude for thicknesses below 5 nm is consistent with the superconducting film becoming 2D. The superconducting dirty limit coherence length, , of the amorphous Pb is given by where is the clean limit coherence length (80 nm for Pb) and is the mean free path which for our samples is 0.3 nm olivierPRB . This yields nm. Hence, the excess specific heat bump reaches its full amplitude as the film thickness becomes comparable to the coherence length.
It should be noted that the amplitude of the specific heat peak at is much larger than what could be naively expected if each vortex degrees of freedom contributes to chaikin . Assuming a single vortex per coherence length, , the measured peak amplitude is close to two orders of magnitude larger than the expected value.
A point to consider is related to the sample dimensionality. The electronic heat capacity includes contributions both from quasiparticles and from vortices. For quasiparticle the system has to be treated as 3D, and the specific heat should be obtained by dividing the heat capacity by the layer thickness (or by the mass). The vortices, on the other hand, should organize in a 2D plane once , and hence the vortex contribution to heat capacity is not expected to change with growing thickness. In this respect, it is interesting to compare Fig. 3(a), which is representative of a 2D treatment, and Fig. 4(a), which highlights 3D physics. One could expect that the heat capacity peak amplitude, in Fig. 3(a) would not change with thickness for thin films. It should be noted, however, that ultrathin superconducting films have been shown to be characterized by ”emergent electronic granularity” i.e. superconducting puddles embedded in an insulating matrix kowal ; ghosal1 ; ghosal2 ; feigelman ; Nandini . These puddles may have different sizes and thus a spread of critical temperatures Biscaras . This may be the reason why the specific heat in the thinnest films does not posses a jump at similar to the one observed in granular Pb samples where each grain is large enough to sustain bulk superconductivity poran2 . Thin enough layers may actually not achieve full coverage of the substrate, both morphologically and electronically. Increasing the thickness of film may increase the area of superconducting regions leading to increase the vortex contribution to heat capacity even in the 2D limit.
In summary, we have successfully performed specific heat measurements on Pb films as thin as 1.2 nm having a mass as small as few tens of nanograms. We have shown that for the thicker films the specific heat jump is well described by the BCS model for strong coupled superconductivity. For the thinner films, a broad peak in is observed without any measurable jump at the resistive critical temperature. These are quantitatively consistent with the BKT predictions in the limit of ultra-thin uniform superconducting films. Since the details of the specific heat versus temperature curves are predicted to be non-universal and are system dependent, we are not able to compare our results to a quantitative model. Nevertheless, the amplitude of the specific heat signal is larger than expected from a naive estimation.
We are grateful for useful discussions with M. Holzmann, N. Trivedi, and M. Randera and for the support from the technical pole of Institut NEEL especially from E. André, T. Crozes, A. Gérardin, G. Moiroux, and J.-L. Mocellin. We acknowledge support from the Laboratoire d’excellence LANEF in Grenoble (ANR-10-LABX-51-01). A.F. acknowledges support from the Israel US bi-national foundation grant no. 2014325.
aviad.frydman@gmail.com olivier.bourgeois@neel.cnrs.fr
References
- (1) V.L. Berezinskii, Sov. Phys. JETP 34, 610 (1972).
- (2) J.M. Kosterlitz, and D.J. Thouless, J. Phys. C 6 1181 (1973).
- (3) P.M. Chaikin, and T.C. Lubensky. Principles of condensed matter physics, 550, Cambridge University Press (1995).
- (4) P. Minnhagen, Rev. Mod. Phys. 59, 1001 (1987).
- (5) K. Epstein, A.M. Goldman, and A. M. Kadin, Phys. Rev. Lett. 47 534 (1981).
- (6) S. A. Wolf, D. U. Gubser, W. W. Fuller, J. C. Garland, and R. S. Newrock, Phys. Rev. Lett. 47, 1071 (1981).
- (7) A. F. Hebard and A. T. Fiory, Phys. Rev. Lett. 50, 1603 (1983).
- (8) O. Bourgeois, S.E. Skipetrov, F. Ong, and J. Chaussy, Phys. Rev. Lett. 94, 057007 (2005).
- (9) S. Poran, M. Molina-Ruiz, A. Gérardin, A. Frydman, O. Bourgeois, Rev. Sci. Instrum. 85, 053903 (2014).
- (10) S. Poran, T. Nguyen-Duc, A. Auerbach, N. Dupuis, A. Frydman, & O. Bourgeois, Nat. Commun. 8, 14464 (2017).
- (11) M. Strongin, R.S. Thompson, O.F. Kammerer, and J.E. Crow, Phys. Rev. B 1, 1078 (1970).
- (12) R.C. Dynes, J.P. Garno, and J.M. Rowell, Phys. Rev. Lett. 40, 479 (1978).
- (13) R.C. Dynes, A.E. White, J.M. Graybeal, and J.P. Garno, Phys. Rev. Lett. 57, 2195 (1986).
- (14) D.B. Haviland, Y. Liu, and A.M. Goldman, Phys. Rev. Lett. 62, 2180 (1989).
- (15) O. Bourgeois, A. Frydman, and R.C. Dynes, Phys. Rev. Lett. 88, 186403 (2002).
- (16) See Supplemental Material at http://link.aps.org/ for details on the fabrication process, on the ac-calorimetry method used for the measurement of the heat capacity and on the Alpha-model used to do the BCS fit on the electronic specific heat in the superconductate.
- (17) T. Nguyen, A. Tavakoli, S. Triqueneaux, R. Swami, A. Ruhtinas, J. Gradel, P. Garcia-Campos, K. Hasselbach, A. Frydman, B. Piot, M. Gibert , E. Collin and O. Bourgeois, Journal of Low Temperature Physics, accepted (arXiv:1907.08443). A. Brown, M.W. Zemansky, and H.A. Boorse, Phys. Rev. 92, 52 (1953).
- (18) D.L. Martin, Proceedings of the Physical Society 78, 1489 (1961).
- (19) O. Bourgeois, A. Frydman, and R.C. Dynes, Phys. Rev. B 68, 092509 (2003).
- (20) D. Kowal and Z. Ovadyahu, Solid State Comm. 90, 783 (1994); ibid Physica C 468 322 (2008).
- (21) A. Ghosal, M. Randeria, and N. Trivedi, Phys. Rev. Lett. 81, 3940 (1998).
- (22) A. Ghosal, M. Randeria, and N. Trivedi, Phys. Rev. B. 65, 014501 (2001).
- (23) M.V. Feigel’man, L.B. Ioffe, V.E. Kravtsov, and E.A. Yuzbashyan, Phys. Rev. Lett. 98, 027001 (2007).
- (24) K. Bouadim, Y. Loh, M. Randeria, and N. Trivedi, Nature Physics 7, 884 (2011).
- (25) J. Biscaras, N. Bergeal, S. Hurand, C. Feuillet-Palma, A. Rastogi, R.C. Budhani, M. Grilli, S. Caprara, and J. Lesueur, Nat. Mat. 12, 542 (2013).