2019 \jmlrworkshop
Feature Robustness in Non-stationary Health Records:
Caveats to Deployable Model Performance in Common Clinical Machine Learning Tasks
Abstract
When training clinical prediction models from electronic health records (EHRs), a key concern should be a model’s ability to sustain performance over time when deployed, even as care practices, database systems, and population demographics evolve. Due to de-identification requirements, however, current experimental practices for public EHR benchmarks (such as the MIMIC-III critical care dataset) are time agnostic, assigning care records to train or test sets without regard for the actual dates of care. As a result, current benchmarks cannot assess how well models trained on one year generalise to another. In this work, we obtain a Limited Data Use Agreement to access year of care for each record in MIMIC and show that all tested state-of-the-art models decay in prediction quality when trained on historical data and tested on future data, particularly in response to a system-wide record-keeping change in 2008 (0.29 drop in AUROC for mortality prediction, 0.10 drop in AUROC for length-of-stay prediction with a random forest classifier). We further develop a simple yet effective mitigation strategy: by aggregating raw features into expert-defined clinical concepts, we see only a 0.06 drop in AUROC for mortality prediction and a 0.03 drop in AUROC for length-of-stay prediction. We demonstrate that this aggregation strategy outperforms other automatic feature preprocessing techniques aimed at increasing robustness to data drift. We release our aggregated representations and code111Code can be accessed at https://github.com/MLforHealth/MIMIC_Generalisation to encourage more deployable clinical prediction models.
1 Introduction
The wide-spread adoption of electronic health records (EHRs) in modern healthcare systems has enabled the secondary use of these records to develop machine learning models for mortality risk (Harutyunyan et al., 2017), sepsis treatment (Raghu et al., 2017), and many other promising applications (Lim and van der Schaar, 2018; Rajkomar et al., 2018). Due to the sensitive nature of patient information, EHR data is typically de-identified in order to reduce risk to patients prior to its use in research. A well-known example of publicly-available, de-identified EHR data is the MIMIC-III database (Johnson et al., 2016), which contains information about intensive care unit (ICU) patients from the Beth Israel Deaconess Medical Center (BIDMC).
A crucial step of de-identification is obscuring calendar dates related to care. In the MIMIC-III dataset, dates are shifted into the future between the years “2100 and 2200” by a consistent random offset for each patient (Johnson et al., 2016). While this preserves privacy, these practices yield a dataset which cannot be analysed in a temporally consistent way—e.g., training a model on historical data, then evaluating on future data. As a result, the wide literature of prior work on MIMIC-III (Harutyunyan et al., 2017; Purushotham et al., 2018; Choi et al., 2017) all use time-agnostic evaluation protocols, which do not account for a significant source of error that would affect models during true deployment: namely, the evolution of care practices over time and the resultant concept drift (Žliobaitė, 2010), which are known to induce significant differences in clinical data (Rajkomar et al., 2018; Lazer et al., 2014). These changes can range from mild, gradual drift, such as the typical evolution of care practices and population demographics, to near-instantaneous dramatic shifts such as when the underlying EHR data management system at BIDMC was changed from Philips CareVue222https://mimic.physionet.org/mimicdata/carevue/ to MetaVision333https://mimic.physionet.org/mimicdata/metavision/ in 2008 (Johnson et al., 2016). This shift caused fundamental changes in the way every clinical measurement was recorded in the EHR (yielding entirely new database tables with new variable names).
To the best of our knowledge, researchers have not yet assessed how robust state-of-the-art models trained on MIMIC-III are to temporal drift. In this work, we use a Limited Data Use Agreement allowing restricted access to the underlying calendar year of each event within MIMIC-III to perform such an assessment, examining how well a variety of models generalise to unseen future-only data across a battery of input representations and time-aware training regimes.
We find that the choice of input representation substantially impacts how robust a model is to changing care practices. Models using raw, non-featurised data representations, as advocated by recent deep learning ICU prediction systems such as Purushotham et al. (2018), are universally unable to generalise well across large dataset shifts as exemplified by the 2008 system switch within MIMIC-III. Neither dimensionality reduction techniques such as PCA nor automated feature aggregations based on natural language processing are entirely able to circumvent this problem. Across these representations, models trained on only historic data report dramatic drops of area under the receiver-operator curve (AUROC) performance for both a mortality prediction task (worst-case drop of 0.29 AUROC on RF) and a long length-of-stay prediction task (drop of 0.10 AUROC on RF). Such performance problems make the prospective deployment of prediction systems untenable.
To avoid problems when generalising across shifts in feature representations, we introduce a novel clinically-motivated feature representation, grouping raw features into underlying concepts, which reduces EHR-shift AUROC drop to 0.06 for mortality, and 0.03 for long length-of-stay. Additionally, by profiling the changes in model performance over time, we find evidence to suggest that both mortality prediction and length-of-stay prediction (each of which are commonly studied tasks) saturate in prediction quality very quickly from little data, suggesting that as a field we should likely focus on more difficult tasks moving forward.
Clinical Relevance
Clinical data is highly dependent on the landscape of clinical practice as well as underlying population demographics and comorbidities, all of which vary over time. The complete utility of a healthcare model can be nearly impossible to ascertain unless one accounts for the inevitable effect of temporal dataset drift. However, due to the sensitivity of year-of-care information, this effect has not yet been quantified on MIMIC-III. This lack of consideration to the data generating process jeopardises the utility of advancements in clinical machine learning by producing models which are unfit to translate into clinical practice. In this work, we establish how serious this problem is and suggest a mediation of it which should help future models have a better chance of showing robust performance in a real-world clinical setting.
Technical Significance
In this work, we profile a large number of models across a battery of input representations and several temporal training regimes to assess the robustness of various paradigms to clinical concept drift. We also establish a new, robust representation based on a expert mapping of raw MIMIC-III features into clinical buckets which will be a valuable resource to the machine learning for health community.
2 Outline
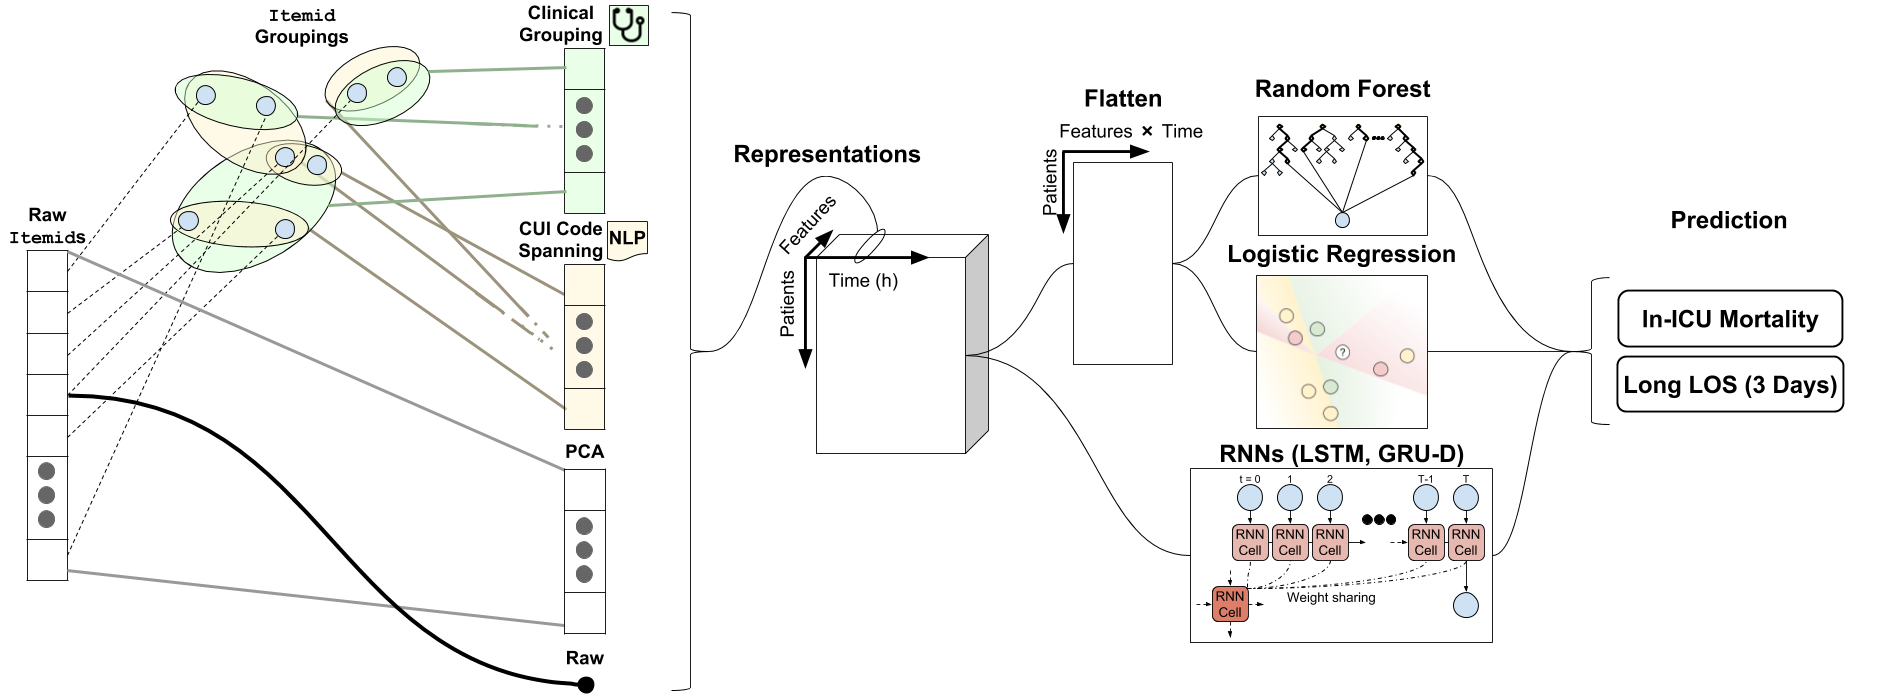
We focus on two binary prediction tasks, mortality and long length-of-stay, which are commonly studied for applying machine learning to the MIMIC-III critical care setting. The cohort selection and task setup are described in Section 3. For each task, we evaluate a thorough set of permutations of feature representations, prediction models, and training paradigms (as described in Section 4). Our full prediction pipeline is illustrated in Figure 1. We consider four possible representations that span a range from little manual involvement (raw features only) to moderate automatic pre-processing to in-depth expert-selection of high-level features (Clinical Aggregate). We further examine four possible models and three possible training regimes that vary how much historical data is included in training. Results are reported in Section 5. Finally, we review related work in generalising across time and clinical sites in Section 6.
3 Data Cohort and Prediction Tasks
3.1 Data Cohort
Within the MIMIC-III dataset, each individual patient may be admitted to the hospital on multiple different occasions, and during each hospital admission may be transferred to and from the intensive care unit (ICU) multiple times. We choose to focus on a patient’s first exposure to the ICU (by far the most common case), avoiding the complications of those that transfer multiple times. We thus extract a targeted cohort of patient EHR data corresponding to the first ICU visit. We include only ICU stays that lasted at least 36 hours. We also focus on non-paediatric case by requiring all patients to be over 15 years old. These criteria, which broadly follow prior work (Ghassemi et al., 2017; Suresh et al., 2017; McDermott et al., 2018), result in a cohort of unique ICU stays.
3.2 Features: Demographics and Hourly Labs and Vitals.
For each patient stay, we capture 7 static demographic features and 181 lab and vital measurements that vary over time. The 7 demographic features consist of one-hot encoded gender and race attributes, which are fully observed. The 181 lab results and vital signs have a high-rate of missingness (), as each patient may only have a few tests ordered depending on medical needs, and these tests occur infrequently over time. We used an early version of the MIMIC-III data extraction code made available by Wang et al. (2019).
Transformation to 24-hour time-series.
All time-varying measurements from one ICU stay are aggregated into regularly-spaced hourly buckets (0–1 hr, 1–2 hr, etc.). Each recorded hourly value is the mean of any measurements captured in that hour. We normalised each numerical feature to have a mean of zero and a standard deviation of one using a transformation fit on the training dataset. We store this transformation and apply it to the held-out data.
The input to each prediction model contains two parts: the 7 demographic features and an hourly multivariate time-series of labs and vitals, where the feature vector at each hour is determined by the chosen data representation (Section 4). We censor the time series to a fixed-duration of 24 hours, representing the first day of a subject’s stay in the ICU.
Imputation of missing values.
To account for the high rate of missingness within MIMIC-III, we impute our data Janssen et al. (2010) via a strategy known as “simple imputation,” which was introduced and validated by Che et al. (2018) for MIMIC time-series prediction tasks. Given a chosen representation’s observed multivariate time-series, each separate univariate measurement is forward filled, concatenated with a binary indicator if the value was measured within that hour, and concatenated with the time since the last measurement of this value.
3.3 Binary Prediction Tasks
We select two representative binary classification tasks for this investigation. First, the mortality task: given the first 24 hours of data for a patient’s ICU stay, predict if the patient will die in the ICU. Second, the long length of stay (LOS) task: given the first 24 hours of data, predict if the patient will stay in the ICU longer than 3 days. These tasks are further described in Appendix C, including previous modelling work and clinical significance. To prevent label leakage we ensured that all included ICU stays lasted for a minimum duration of 36 hours, which yields a gap of at least 12 hours between when the prediction is made (after the first day) and when the predicted event happens (patient dies or is discharged).
4 Methods
In this section, we outline the various data representations we consider, which prediction methods we assess, and 3 different ways to divide data into training and test sets in chronologically consistent ways to assess how trained models might fare when prospectively deployed. This pipeline is shown in Figure 1.
4.1 Representations
Data representation is important for robust model learning (Bengio et al., 2013); however, many of the structures that make learning effective in popular ML benchmarks (e.g., Gabor filters for computer vision given natural images) do not map over to clinical equivalents (Raghu et al., 2019). While others have considered the automated mapping of clinical data elements with mapping tools (Gong et al., 2017) or learned vector space embeddings (Rajkomar et al., 2018), it is unknown whether these methods can withstand time-varying changes in EHR.
We consider four possible data representations in this work: Raw, PCA, CUI Code Spanning, and Clinical Aggregations. These are described in detail below and diagrammed visually in Figure 1. Each representation is strictly a way of transforming the feature vector observed at each hour of the observed time-series of labs and vitals (demographics are not affected by the representation).
Raw
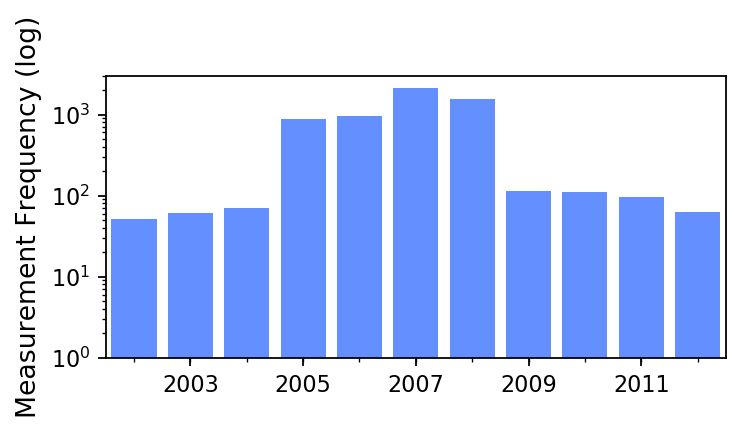
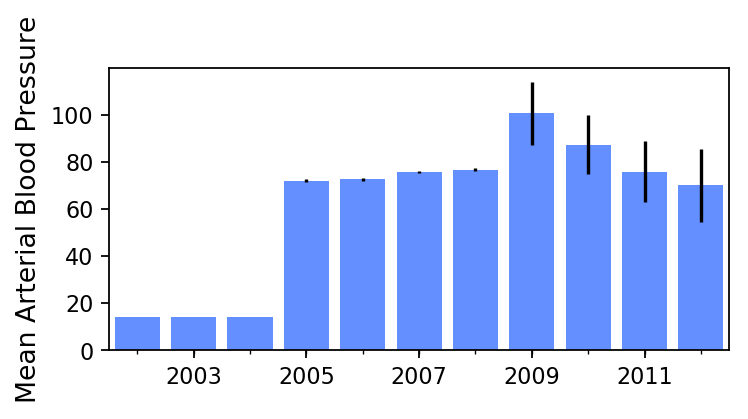
The “Raw” representation is the simplest; we include all selected 181 labs and vitals described above in Section 3.1, each identified via a unique ItemID code in the MIMIC database. This representation suffers from the significant flaw that the ItemIDs are explicitly connected to the underlying EHR software, and thus reflect when logistical practice changes dramatically. This means any raw features used in the CareVue system before 2008 are not used by later MetaVision records, and vice versa. For example, the measurement of “Heart Rate” went from ItemID 211 in CareVue to 220045 under MetaVision. In addition to the EHR system shift, there are vitals such as ”Mean Arterial Blood Pressure” (ItemID 6702) that spontaneously increase their frequency of recording in 2004 (Figure 4). As a result, the “raw” hourly time-series are extremely sparse with many missing values before imputation.
PCA
We use principal component analysis (Hotelling, 1933; Jolliffe, 2002) to reduce dimensionality of per-hour raw features. To train this representation, we provide as input the full simple imputation of the 181 raw features, where each of the 181 features has a value, a binary indicator, and a time since last measurement. Given this 543-dimensional feature vector for each hour of every ICU stay in the training set, we select the first 68 principle components, where 68 was chosen to match the dimensionality of the clinical aggregate features. This yields a dense per-hour feature vector with no missingness.
CUI Code Spanning
In a manner similar to that of Gong et al. (2017), we use the human-readable descriptions of the original raw ItemIDs to automatically aggregate features into groups associated with Concept Unique Identifiers (CUIs) from the Unified Medical Language System (UMLS) (Bodenreider, 2004). In doing so, a single raw ItemID may be mapped to multiple CUIs, and various raw ItemIDs may be mapped to the same CUI; thus, the resulting feature representation reflects an abstraction into a space of shared semantic concepts. This representation yields reduced rates of missingness—though missingness is still present—and has been demonstrated to be more robust across EHR transitions (i.e., when ItemIDs change abruptly due to a new EHR) (Gong et al., 2017). While this representation requires no manual expertise to define the groupings, it relies on the existence of an ontology, UMLS, to provide this CUI to free-text mapping. Note that because multiple CUIs may be identified in the human-readable description of a raw ItemID, we use the Spanning pruning technique identified in Gong et al. (2017), which has been shown to identify the most specific CUIs in a given description (Divita et al., 2014).
Clinical Aggregations
For this representation, we use expert knowledge to manually define groupings of ItemIDs which are converted to a canonical unit space then averaged together. These groupings span the discrepancies between CareVue and MetaVision, such as by grouping ItemID values “Heart Rate” under CareVue (211) and MetaVision (220045). The groupings also gather together ItemIDs which measure the same biophysical quantity merely through different means, such as aggregating MetaVision ItemIDs 225664 (“Glucose finger stick”), 220621 (“Glucose (serum)”), and 226537 (“Glucose (whole blood)”) into one unified category for glucose blood sugar. The resulting representation groups all 181 raw ItemIDs into 68 clinically meaningful categories, and yields a dataset with a rate of 78.25% missingness before imputation.
4.2 Models
To illustrate the effects of non-stationarity, we benchmark four commonly used models in the machine learning literature for clinical prediction from time series data: logistic regression (LR), random forests (RF), long short-term memory (LSTM) network (Hochreiter and Schmidhuber, 1997) and a gated recurrent unit with decay (GRU-D) network (Che et al., 2018). While LSTM and GRU-D can process time series input directly to make a binary prediction for each ICU stay, both LR and RF make predictions using a flattened vector of the 24-hour time-series data. More details about model implementation can be found in appendix A.
4.3 Training Regimes
In addition to measuring the performance of our models when trained in a year-agnostic manner (i.e., the way models are typically run, with no knowledge of the admission year), we use three temporal training paradigms. These training paradigms are designed to capture distinct mechanisms in which practitioners aiming to deploy a clinical model could do so using historical data. We detail these approaches below, and describe them visually in Figure 2.
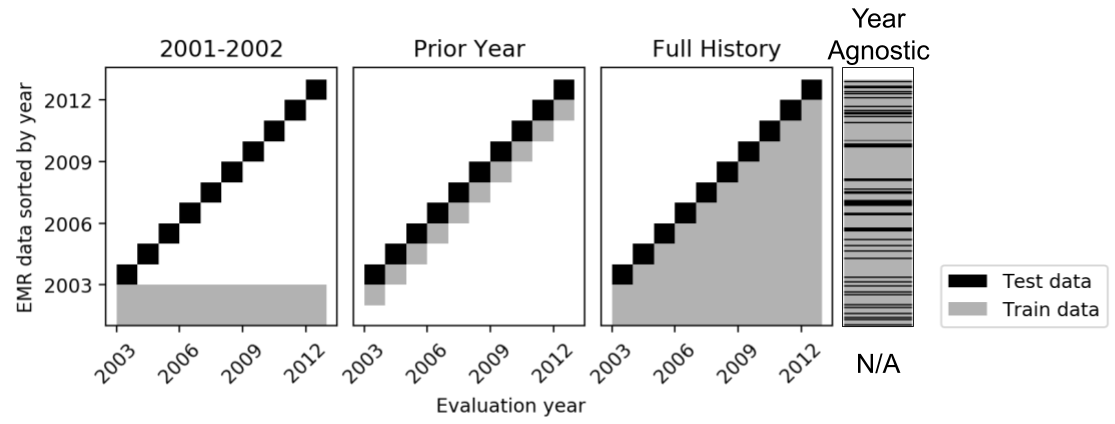
Year-Agnostic
Models are trained and tested on randomly shuffled data, with no knowledge of the year of care. This reflects the performance of works reported on publicly available MIMIC data where the true year is not known.
2001–2002
Models are trained on data from 2001–2002 only, and then tested on all future years. This reflects the performance a practitioner can expect when they to train a model on historical data, then deploy it over many years without updating it to reflect more recent data.
Prior Year
For each testing year (from 2003 onward), models are trained on the data from the prior year only—e.g., data from 2005 will be used to train a model that is tested on data from 2006. This reflects the performance one can expect if a model were deployed and updated with yearly frequency by re-training from scratch on only the prior year’s data. This approach provides the model with the most temporally relevant training data at the expense of training dataset size.
Full History
For each testing year (from 2003 onward), models are trained on all prior data—e.g., data from 2001–2005 will be used to train a model that is tested on data from 2006. This reflects the performance one can expect if they deployed a model, updating it yearly by retraining it on all data ever observed. This provides the most available training data, at the expense of temporal significance.
5 Results
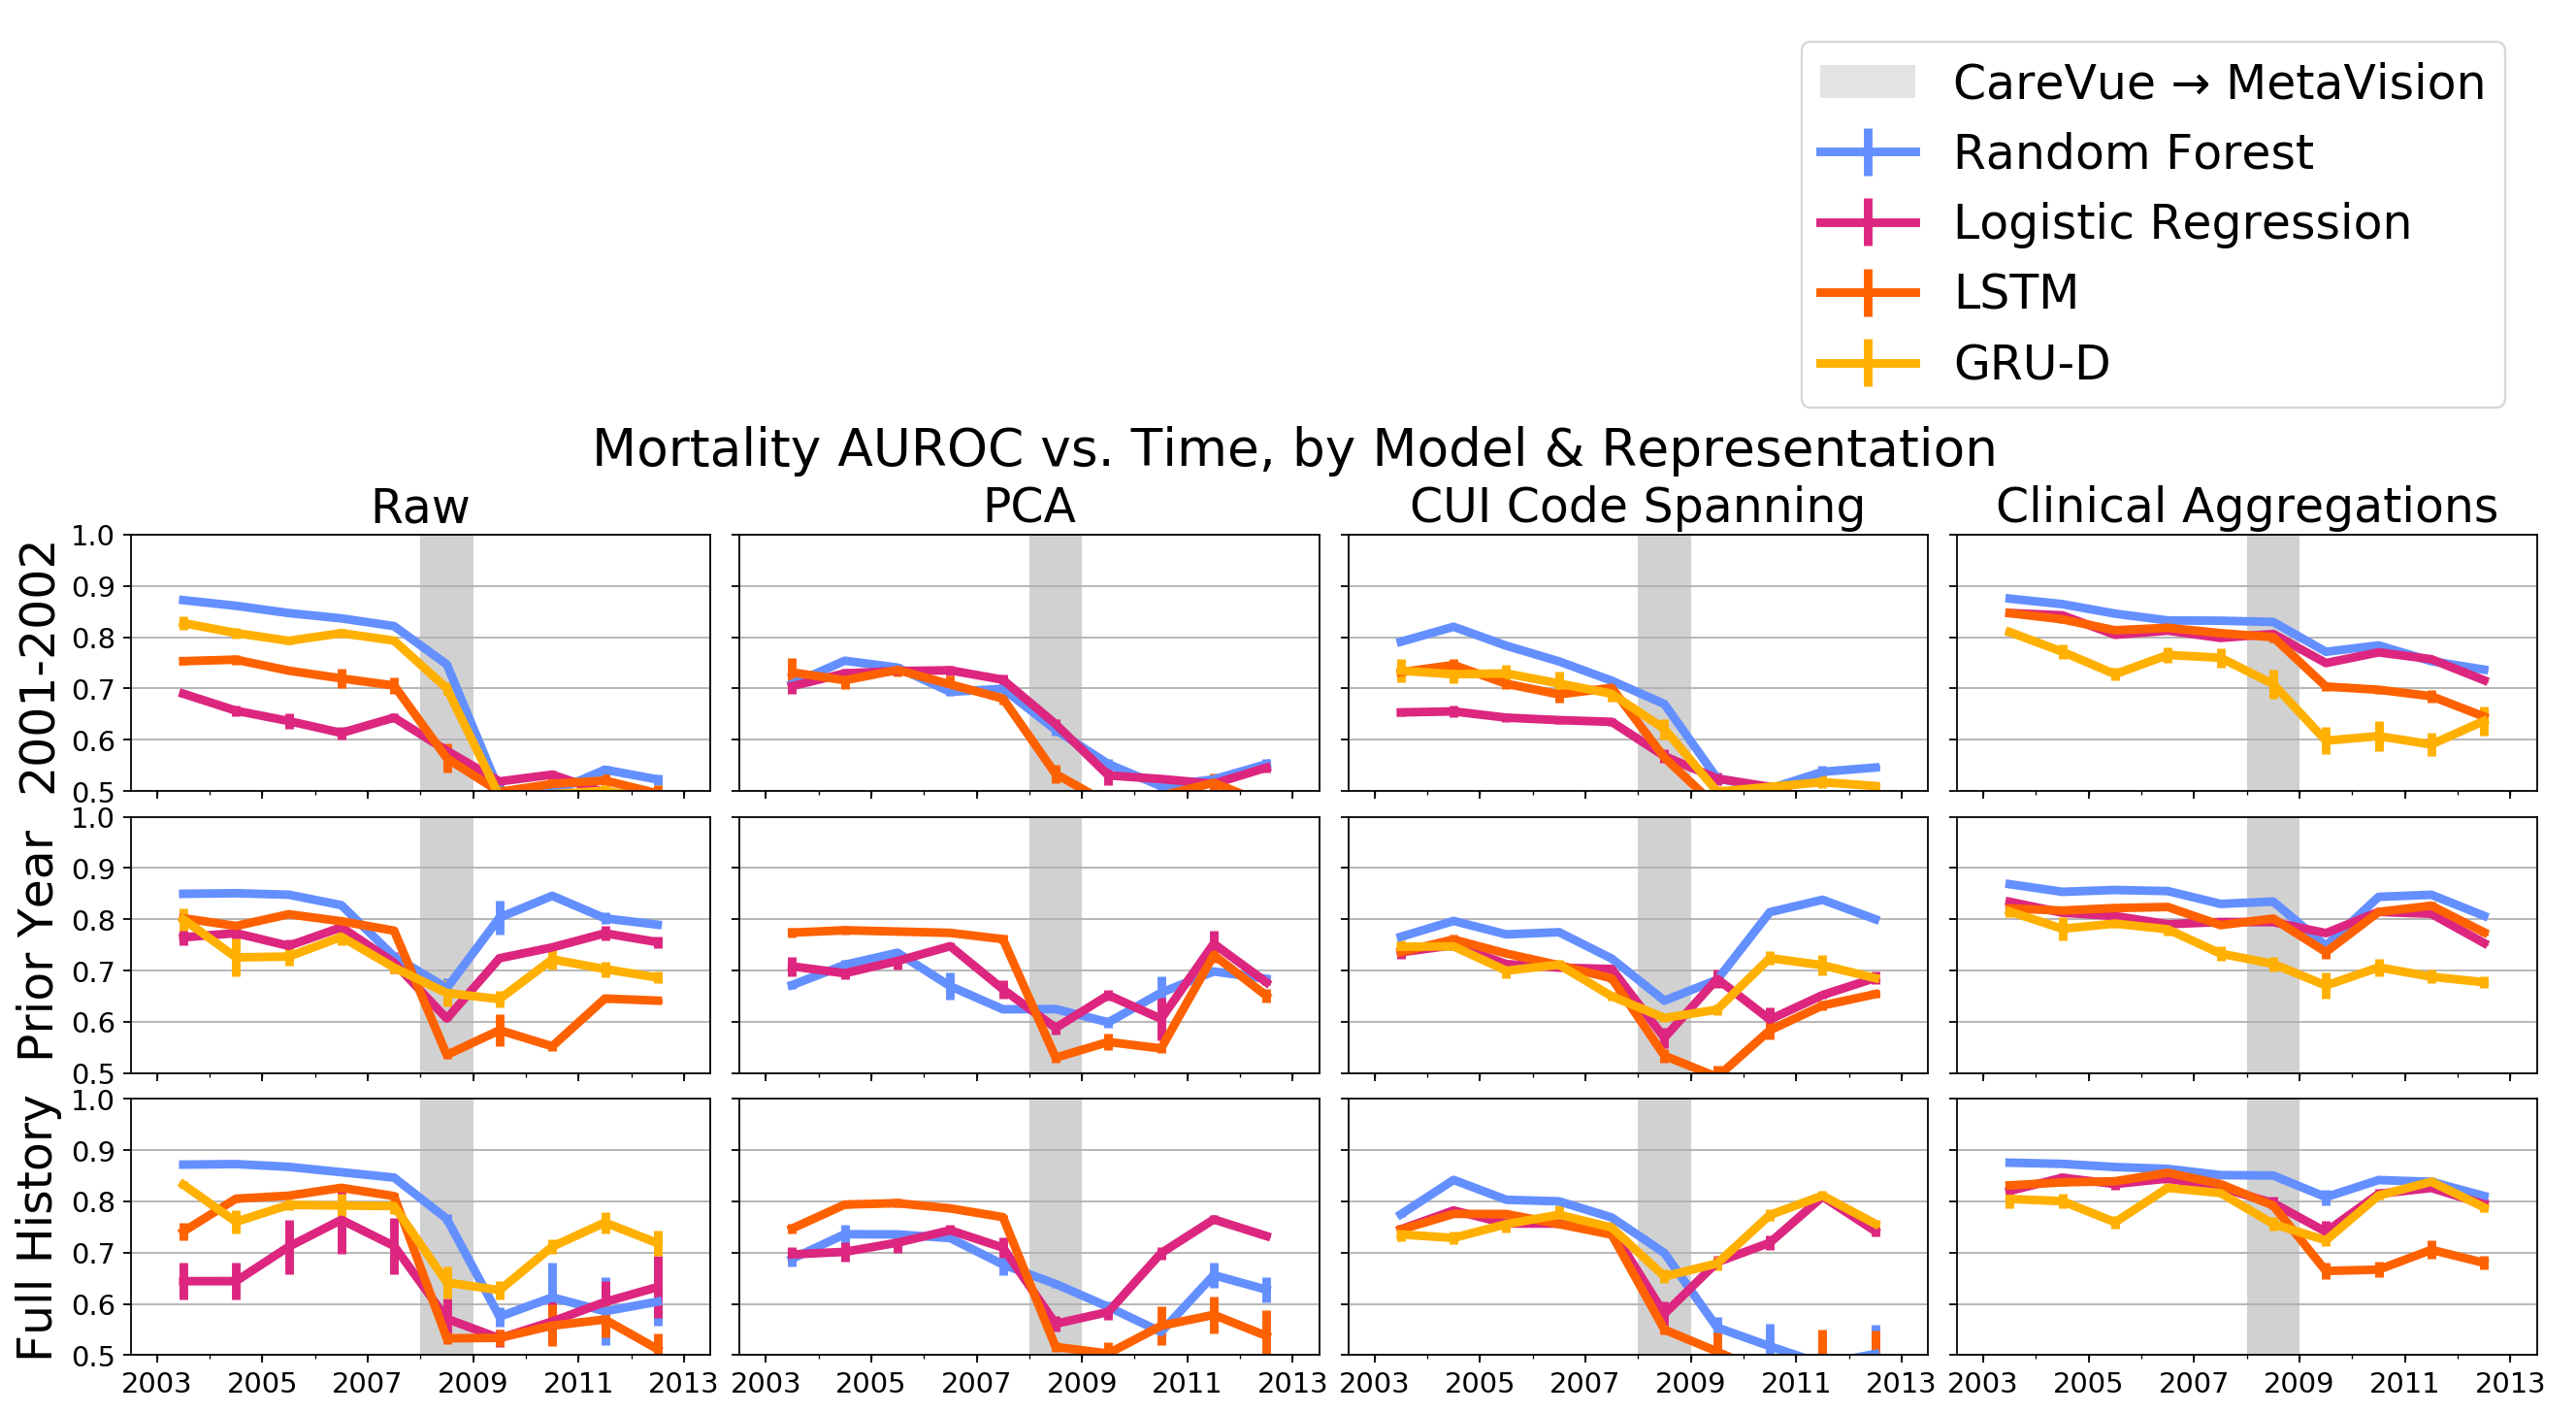
We present the average AUROC per model and representation across all years for the task of early mortality classification in Figure 3. In Table 1, we compare the average ( standard deviation) AUROCs and maximum drop in AUROC observed when comparing the first year of evaluation to each subsequent unseen year from 2003 onward using the Full History training regime between the Raw and Clinical Aggregation representations. We summarise the main points of our results below for the task of mortality prediction, and include results for length-of-stay (LOS) in Appendix E, Figure 6, and Table 4
5.1 Clinical Aggregate Representations are Most Robust to Non-stationarity
Models trained on the Raw representation suffer a rapid performance decrease in 2008, after the EHR change. We also note that most models do not recover quickly, even those with high capacity (e.g., LSTMs and GRU-D); this is perhaps unexpected under the Full History training paradigm. The exception is that the GRU-D begins to recover after receiving approximately 2 years of data. This may suggest GRU-D’s explicit handling of missingness offers benefits in response to concept drift. The clinically aggregated representation maintains much more consistent performance across years for all of the models regardless of model complexity. This is demonstrated quantitatively in Table 1 as well. It is important to note that clinical aggregation confers much lower standard deviation across all models, which in addition to performance offers more clinically trustworthy models.
PCA performed consistently lower than the Raw representation, and struggled to generalise throughout time. Note that we also tested non-linear dimensional reduction with UMAP (McInnes and Healy, 2018), but found similar results: minor perturbations in data distributions from year-to-year renders the model obsolete at test time. Representations that attempt to automatically detect similarities in data elements for grouping managed to sustain both the GRU-D and the logistic regression model to some extent, however failed to help the random forest and LSTM models to recover when trained on the full history of available data.
Overall, the Clinical Aggregate representation is most robust to the performance deterioration which is observed for the other representations, surpassing prior work by Gong et al. (2017) with learned representations. This suggests that there is room for future research towards automatically generating mappings between multiple EHR systems. We also analyse these trends broken out by protected subgroup information, to determine if different subgroups are susceptible to data drift. We find that, in general, smaller subgroups have (not unexpectedly) higher variance and worse generalisation (see Appendix F for more information).
5.2 Date-Agnostic Training Overstates Performance, Especially in Raw Data
We replicate the year-agnostic training and test practice common to most reporting in machine learning papers, and found that this method creates an unrealistic upper bound to model performance, especially on the raw representation. For example, RF models report a year-agnostic mortality AUROC of (5 x 2 fold CV splits (Dietterich, 1998)), as compared to their true year-averaged AUROC under the raw representation of . Under the Clinical Aggregate representation, in contrast, RF reports a year-agnostic mortality AUROC of , in comparison to the true year-averaged AUROC of . A full comparison of static models can be found in Appendix D. The overestimate in performance in the clinical representation is thus only , as compared to under the raw representation.
This problem is also especially challenging as increasingly high capacity models are developed and evaluated in a date-agnostic fashion. Prior work in longitudinal EHR data on wound healing noted that the most complex models achieved significantly higher AUROC than all other models only under conditions approximating stationarity (Jung and Shah, 2015). In a non-stationary setting, model complexity had no advantage, and the gap between the best model and the simplest model was substantially reduced. We see similar impacts in this work where lower capacity models (RF, LR) are preferred on both our tasks.
5.3 Performance Saturation and Task Importance
By profiling the changes in model performance over time, we find evidence to suggest that both of the tasks considered (each of which are commonly studied) require relatively few years of aggregated data to saturate in prediction quality. In particular, in Figure 3, under the Full History training regime and the Clinical Aggregates representation, model performance is very steady from the beginning of the training period where only one year of data is used. Even as the training dataset grows significantly (increasing tenfold in size from test year 2003 to 2012), performance on unseen future data does not dramatically change. This suggests that as a field we should likely focus on more difficult tasks moving forward, or find alternative signals not already in the measured 181 labs and vitals to improve performance.
| Model | Average AUROC | Max AUROC Drop | ||
|---|---|---|---|---|
| Raw | Clinical | Raw | Clinical | |
| LR | ||||
| RF | ||||
| LSTM | ||||
| GRUD | ||||
6 Related Work
Machine Learning for Health on MIMIC
Much of the prior work in machine learning for healthcare focuses on the MIMIC-III dataset, which contains electronic health record (EHR) data from adults spanning hospital admissions at Beth Israel Deaconess Medical Center from 2001 to 2012 (Johnson et al., 2016). Researchers have predicted mortality, billing codes, length-of-stay prediction, intervention onset and offset prediction, among other targets (Ghassemi et al., 2018; Suresh et al., 2017; Raghu et al., 2017; Choi et al., 2017; Ghassemi et al., 2017; Che et al., 2018). Harutyunyan et al. and Purushotham et al. have also defined specific cohorts and benchmarking tasks for MIMIC-III, primarily aiming to enable comparisons of models of varying capacity across meaningful classification tasks. In all cases, authors report aggregate performance on date-agnostic splits into train and test.
Robust Machine Learning over Time
Works have explored concept drift and proposed specialised methods to account for the resulting data distribution changes in machine learning systems, but predominantly in isolated contexts and typically far from the traditional machine learning for health literature. Davis et al., for example, studies performance and calibration drift in machine learning models trained to predict hospital acquired acute kidney over nine years of care practice evolution. Interestingly, they found that models largely maintained performance, though calibration suffered over a number of model types (Davis et al., 2017). Beyene et al. examines concept drift in the task of predicting surgeries, and proposes a novel algorithm to detect significant clinical practice changes and adjust accordingly (Beyene et al., 2015). Subbaswamy and Saria (2018) address dataset shift by estimating causal features and creating a latent space on which to build classification models. Another approach estimates a relationship between source and target domains that incorporates prior knowledge of how the data generating process might differ (or stay the same) between domains (Subbaswamy et al., 2019). The prior two methods do not handle the mapping between multiple EHR systems, hence can be seen as complimentary to the work presented here. Work by Jung and Shah (2015) examines predictive models of wound healing in outpatient care centers over multiple years of data. Jung and Shah show that gains from non-linear models that capture feature interactions are visible in stationary settings (what we call year-agnostic), but disappear when models are evaluated in non-stationary prospective fashion due to covariate shift. Outside the healthcare domain, Becker and Arias (2007) evaluate the use of weighted majority techniques for dealing with concept drift; while their approach considers applications to ranking, the underlying use of ensembles could be adapted to the classification tasks considered here.
Overall, the issue of distributional shift is still considered to be a major barrier in the safety and robustness of ML/AI systems, especially in healthcare (Challen et al., 2019).
Multi-site Generalisability
Though examinations of model robustness over time are rare in machine learning for healthcare, a number of prior works have focused on the notion of generalisability across healthcare institutions. Gong et al., for example, uses the clinical Text Analysis Knowledge Extraction System (cTAKES) (Savova et al., 2010) to identify UMLS concept unique identifiers (CUIs) (Bodenreider, 2004) from human-readable feature descriptions, and aggregates features into higher level buckets based on this CUI overlap. The resulting representation improves model transfer between the CareVue portion of MIMIC-III (pre-2008) and the Metavision portion of MIMIC-III (post-2008) (Gong et al., 2017). 444This split can be re-identified from the differences in the data directly, though further granularity over time is not generally accessible. They frame the CareVue-to-MetaVision transition as a proxy for multiple institution data, not for temporal drift.
Using the recently released multi-source eICU dataset (Pollard et al., 2018), other work has additionally investigated the use of multi-source training data to create models with robust transferability to novel institutions (Johnson et al., 2018). Similarly, Rajkomar et al. trains models using a site-agnostic representation which shows strong predictive performance when transferring between two distinct institutions (Rajkomar et al., 2018). Both Johnson et al. (2018) and Rajkomar et al. (2018) assume strong overlap in feature representations, because the underlying EHR systems are the same or there are a sufficiently large number of samples to capture correlations even in the presence of underlying measure sparsity. In this work, we emphasise evaluating how prediction systems are vulnerable to abrupt changes in the EHR system when little overlap exists between representations.
7 Conclusion
By augmenting the popular de-identified MIMIC dataset with non-public year-of-care information obtained via a Limited Data Use Agreement, our experiments have quantified the robustness of state-of-the-art machine learning pipelines to real-world non-stationarity over two common critical care tasks: mortality prediction and length-of-stay prediction. We have established that ignoring time during evaluation, as is common to MIMIC and other public datasets, will consistently overestimate prediction quality and should be regarded sceptically when assessing future deployment potential. Further, we exposed key problems with the robustness of raw feature representations regardless of model type, even in time-aware evaluation scenarios. Finally, we have developed novel aggregate representations that are demonstrably more effective at generalising to future years than several automated preprocessing methods. The maximum AUROC performance loss throughout the 2002-2012 in MIMIC-III is reduced from 0.29 to just 0.06 for ICU mortality prediction and from 0.10 to 0.03 for length of stay prediction.
This work is intended to serve as a first step towards identifying and overcoming obstacles to effective model deployment. As such, it has several limitations. First and foremost, our present study would not have been possible without the dated events acquired via a Limited Use agreement which others may not have access to immediately. Second, our suggested aggregate representations required manual definition specific to the MIMIC database, so transfer to other EHR systems would require new taxonomies to be developed with input from clinical experts. While several existing automated approaches did help, we expect further research could alleviate more of the burden of manual concept definition. Finally, we only consider two of the most common tasks used in the MIMIC-III dataset, and more work is needed to understand the impact of non-stationarity in other tasks that may not have such rapid performance saturation.
We conclude by cautioning researchers in machine learning for healthcare to consider the deployability limits of their models. To benchmark progress in clinical machine learning it is essential to use standardised datasets and tasks, however, we should not expect models trained on date-agnostic, de-identified data to translate into clinical practice.
Acknowledgements
Dr. Marzyeh Ghassemi is funded in part by Microsoft Research, a CIFAR AI Chair at the Vector Institute, a Canada Research Council Chair, and an NSERC Discovery Grant.
Matthew McDermott is funded in part by National Institutes of Health: National Institutes of Mental Health grant P50-MH106933 as well as a Mitacs Globalink Research Award.
References
- Becker and Arias (2007) Hila Becker and Marta Arias. Real-time ranking with concept drift using expert advice. In KDD, volume 7, pages 86–94, 2007.
- Bengio et al. (2013) Yoshua Bengio, Aaron Courville, and Pascal Vincent. Representation learning: A review and new perspectives. IEEE transactions on pattern analysis and machine intelligence, 35(8):1798–1828, 2013.
- Bergstra and Bengio (2012) James Bergstra and Yoshua Bengio. Random search for hyper-parameter optimization. Journal of Machine Learning Research, 13(Feb):281–305, 2012.
- Beyene et al. (2015) Ayne A. Beyene, Tewelle Welemariam, Marie Persson, and Niklas Lavesson. Improved concept drift handling in surgery prediction and other applications. Knowledge and Information Systems, 44(1):177–196, July 2015. ISSN 0219-3116. 10.1007/s10115-014-0756-9. URL https://doi.org/10.1007/s10115-014-0756-9.
- Bodenreider (2004) Olivier Bodenreider. The Unified Medical Language System (UMLS): integrating biomedical terminology. Nucleic Acids Res, 32(suppl 1):D267–D270, 2004.
- Challen et al. (2019) Robert Challen, Joshua Denny, Martin Pitt, Luke Gompels, Tom Edwards, and Krasimira Tsaneva-Atanasova. Artificial intelligence, bias and clinical safety. BMJ Qual Saf, 28(3):231–237, March 2019. ISSN 2044-5415, 2044-5423. 10.1136/bmjqs-2018-008370. URL https://qualitysafety.bmj.com/content/28/3/231.
- Che et al. (2018) Zhengping Che, Sanjay Purushotham, Kyunghyun Cho, David Sontag, and Yan Liu. Recurrent Neural Networks for Multivariate Time Series with Missing Values. Scientific Reports, 8(1), 2018. URL http://www.nature.com/articles/s41598-018-24271-9.
- Choi et al. (2017) Edward Choi, Mohammad Taha Bahadori, Le Song, Walter F Stewart, and Jimeng Sun. Gram: graph-based attention model for healthcare representation learning. In Proceedings of the 23rd ACM SIGKDD International Conference on Knowledge Discovery and Data Mining, pages 787–795. ACM, 2017.
- Cui (UW) Zhiyong Cui (UW). Gated Recurrent Unit with a Decay mechanism for Multivariate Time Series with Missing Values, March 2019. URL https://github.com/zhiyongc/GRU-D. original-date: 2018-05-13T00:07:42Z.
- Davis et al. (2017) Sharon E Davis, Thomas A Lasko, Guanhua Chen, Edward D Siew, and Michael E Matheny. Calibration drift in regression and machine learning models for acute kidney injury. Journal of the American Medical Informatics Association : JAMIA, 24(6):1052–1061, November 2017. ISSN 1067-5027. 10.1093/jamia/ocx030. URL https://www.ncbi.nlm.nih.gov/pmc/articles/PMC6080675/.
- Dietterich (1998) Thomas G Dietterich. Approximate statistical tests for comparing supervised classification learning algorithms. Neural computation, 10(7):1895–1923, 1998.
- Divita et al. (2014) Guy Divita, Qing T Zeng, Adi V Gundlapalli, Scott Duvall, Jonathan Nebeker, and Matthew H Samore. Sophia: a expedient UMLS concept extraction annotator. In Proc. of AMIA Annual Symposium, volume 2014, page 467. American Medical Informatics Association, 2014.
- Ghassemi et al. (2017) Marzyeh Ghassemi, Mike Wu, Michael Hughes, and Finale Doshi-Velez. Predicting intervention onset in the icu with switching state space models. In Proceedings of the AMIA Summit on Clinical Research Informatics (CRI), volume 2017. American Medical Informatics Association, 2017.
- Ghassemi et al. (2018) Marzyeh Ghassemi, Tristan Naumann, Peter Schulam, Andrew L Beam, and Rajesh Ranganath. Opportunities in machine learning for healthcare. arXiv preprint arXiv:1806.00388, 2018.
- Gong et al. (2017) Jen J Gong, Tristan Naumann, Peter Szolovits, and John V Guttag. Predicting Clinical Outcomes Across Changing Electronic Health Record Systems. In the 23rd ACM SIGKDD International Conference, pages 1497–1505, New York, New York, USA, 2017. ACM Press.
- Han-JD (2019) Han-JD. inspired by ‘Recurrent Neural Networks for Multivariate Time Series with Missing Values’, March 2019. URL https://github.com/Han-JD/GRU-D. original-date: 2018-09-17T19:24:26Z.
- Harutyunyan et al. (2017) Hrayr Harutyunyan, Hrant Khachatrian, David C Kale, and Aram Galstyan. Multitask learning and benchmarking with clinical time series data. arXiv preprint arXiv:1703.07771, 2017.
- Hochreiter and Schmidhuber (1997) Sepp Hochreiter and Jürgen Schmidhuber. Long Short-Term Memory. Neural Comput., 9(8):1735–1780, November 1997. ISSN 0899-7667. 10.1162/neco.1997.9.8.1735. URL http://dx.doi.org/10.1162/neco.1997.9.8.1735.
- Hotelling (1933) Harold Hotelling. Analysis of a complex of statistical variables into principal components. Journal of educational psychology, 24(6):417, 1933.
- Hripcsak et al. (2015) George Hripcsak, David J Albers, and Adler Perotte. Parameterizing time in electronic health record studies. Journal of the American Medical Informatics Association, 22(4):794–804, 2015.
- Ioffe and Szegedy (2015) Sergey Ioffe and Christian Szegedy. Batch normalization: Accelerating deep network training by reducing internal covariate shift. arXiv preprint arXiv:1502.03167, 2015.
- Janssen et al. (2010) Kristel J.M. Janssen, A. Rogier T. Donders, Frank E. Harrell, Yvonne Vergouwe, Qingxia Chen, Diederick E. Grobbee, and Karel G.M. Moons. Missing covariate data in medical research: To impute is better than to ignore. Journal of Clinical Epidemiology, 63(7):721–727, 2010.
- Johnson et al. (2018) Alistair E. W. Johnson, Tom J. Pollard, and Tristan Naumann. Generalizability of predictive models for intensive care unit patients. arXiv:1812.02275 [cs, stat], December 2018. URL http://arxiv.org/abs/1812.02275. arXiv: 1812.02275.
- Johnson et al. (2016) Alistair EW Johnson, Tom J Pollard, Lu Shen, H Lehman Li-wei, Mengling Feng, Mohammad Ghassemi, Benjamin Moody, Peter Szolovits, Leo Anthony Celi, and Roger G Mark. Mimic-iii, a freely accessible critical care database. Scientific data, 3:160035, 2016.
- Jolliffe (2002) I.T. Jolliffe. Principal Component Analysis. Springer Verlag, second edition, 2002.
- Jung and Shah (2015) Kenneth Jung and Nigam H Shah. Implications of non-stationarity on predictive modeling using ehrs. Journal of biomedical informatics, 58:168–174, 2015.
- Kingma and Ba (2014) Diederik P Kingma and Jimmy Ba. Adam: A method for stochastic optimization. arXiv preprint arXiv:1412.6980, 2014.
- Kocher et al. (2010) Robert Kocher, Ezekiel J Emanuel, and Nancy-Ann M DeParle. The affordable care act and the future of clinical medicine: the opportunities and challenges. Annals of internal medicine, 153(8):536–539, 2010.
- Lasko et al. (2013) Thomas A Lasko, Joshua C Denny, and Mia A Levy. Computational phenotype discovery using unsupervised feature learning over noisy, sparse, and irregular clinical data. PloS one, 8(6):e66341, 2013.
- Lazer et al. (2014) David Lazer, Ryan Kennedy, Gary King, and Alessandro Vespignani. The parable of google flu: traps in big data analysis. Science, 343(6176):1203–1205, 2014.
- Lim and van der Schaar (2018) Bryan Lim and Mihaela van der Schaar. Disease-atlas: Navigating disease trajectories with deep learning. arXiv preprint arXiv:1803.10254, 2018.
- Martín Abadi et al. (2015) Martín Abadi, Ashish Agarwal, Paul Barham, Eugene Brevdo, Zhifeng Chen, Craig Citro, Greg S. Corrado, Andy Davis, Jeffrey Dean, Matthieu Devin, Sanjay Ghemawat, Ian Goodfellow, Andrew Harp, Geoffrey Irving, Michael Isard, Yangqing Jia, Rafal Jozefowicz, Lukasz Kaiser, Manjunath Kudlur, Josh Levenberg, Dandelion Mané, Rajat Monga, Sherry Moore, Derek Murray, Chris Olah, Mike Schuster, Jonathon Shlens, Benoit Steiner, Ilya Sutskever, Kunal Talwar, Paul Tucker, Vincent Vanhoucke, Vijay Vasudevan, Fernanda Viégas, Oriol Vinyals, Pete Warden, Martin Wattenberg, Martin Wicke, Yuan Yu, and Xiaoqiang Zheng. TensorFlow: Large-Scale Machine Learning on Heterogeneous Systems. Technical report, TensorFlow, 2015. URL https://www.tensorflow.org/.
- McDermott et al. (2018) M.B.A. McDermott, T. Yan, T. Naumann, N. Hunt, H. Suresh, P. Szolovits, and M. Ghassemi. Semi-supervised Biomedical Translation with Cycle Wasserstein Regression GANs. In Association for the Advancement of Artificial Intelligence, New Orleans, LA, 2018.
- McInnes and Healy (2018) L. McInnes and J. Healy. UMAP: Uniform Manifold Approximation and Projection for Dimension Reduction. ArXiv e-prints, February 2018.
- Paszke et al. (2017) Adam Paszke, Sam Gross, Soumith Chintala, Gregory Chanan, Edward Yang, Zachary DeVito, Zeming Lin, Alban Desmaison, Luca Antiga, and Adam Lerer. Automatic differentiation in pytorch. In NIPS 2017 Autodiff Workshop, 2017. URL https://openreview.net/forum?id=BJJsrmfCZ¬eId=BJJsrmfCZ.
- Pedregosa et al. (2011) Fabian Pedregosa, Gaël Varoquaux, Alexandre Gramfort, Vincent Michel, Bertrand Thirion, Olivier Grisel, Mathieu Blondel, Peter Prettenhofer, Ron Weiss, Vincent Dubourg, Jake Vanderplas, Alexandre Passos, David Cournapeau, Matthieu Brucher, Matthieu Perrot, and Édouard Duchesnay. Scikit-learn: Machine Learning in Python. Journal of Machine Learning Research, 12:2825–2830, October 2011. ISSN 1533-7928. URL http://jmlr.csail.mit.edu/papers/v12/pedregosa11a.html.
- Pollard et al. (2018) Tom J. Pollard, Alistair E. W. Johnson, Jesse D. Raffa, Leo A. Celi, Roger G. Mark, and Omar Badawi. The eICU Collaborative Research Database, a freely available multi-center database for critical care research. Scientific Data, 5:180178, September 2018. 10.1038/sdata.2018.178. URL https://www.nature.com/articles/sdata2018178.
- Purushotham et al. (2018) Sanjay Purushotham, Chuizheng Meng, Zhengping Che, and Yan Liu. Benchmarking deep learning models on large healthcare datasets. Journal of biomedical informatics, 83:112–134, 2018.
- Raghu et al. (2017) A. Raghu, M. Komorowski, L.A. Celi, P. Szolovits, and M. Ghassemi. Continuous state-space models for optimal sepsis treatment: a deep reinforcement learning approach. In Machine Learning for Healthcare Conference (MLHC), pages 147–163, 2017.
- Raghu et al. (2019) Maithra Raghu, Chiyuan Zhang, Jon Kleinberg, and Samy Bengio. Transfusion: Understanding transfer learning with applications to medical imaging. arXiv preprint arXiv:1902.07208, 2019.
- Rajkomar et al. (2018) Alvin Rajkomar, Eyal Oren, Kai Chen, Andrew M Dai, Nissan Hajaj, Michaela Hardt, Peter J Liu, Xiaobing Liu, Jake Marcus, Mimi Sun, et al. Scalable and accurate deep learning with electronic health records. NPJ Digital Medicine, 1(1):18, 2018.
- Savova et al. (2010) Guergana K Savova, James J Masanz, Philip V Ogren, Jiaping Zheng, Sunghwan Sohn, Karin C Kipper-Schuler, and Christopher G Chute. Mayo clinical text analysis and knowledge extraction system (ctakes): architecture, component evaluation and applications. J Am Med Inform Assoc, 17(5):507–513, 2010.
- Subbaswamy and Saria (2018) Adarsh Subbaswamy and Suchi Saria. Counterfactual normalization: Proactively addressing dataset shift using causal mechanisms. In UAI, pages 947–957, 2018.
- Subbaswamy et al. (2019) Adarsh Subbaswamy, Peter Schulam, and Suchi Saria. Preventing failures due to dataset shift: Learning predictive models that transport. In The 22nd International Conference on Artificial Intelligence and Statistics, pages 3118–3127, 2019.
- Suresh et al. (2017) Harini Suresh, Nathan Hunt, Alistair Johnson, Leo Anthony Celi, Peter Szolovits, and Marzyeh Ghassemi. Clinical intervention prediction and understanding with deep neural networks. In Proceedings of the 2nd Machine Learning for Healthcare Conference, volume 68 of Proceedings of Machine Learning Research, pages 322–337, Boston, Massachusetts, 18–19 Aug 2017. PMLR.
- Wang et al. (2019) Shirly Wang, Matthew McDermott, Geeticka Chauhan, Michael C Hughes, Tristan Naumann, and Marzyeh Ghassemi. Mimic-extract: A data extraction, preprocessing, and representation pipeline for mimic-iii. arXiv preprint arXiv:1907.08322, 2019.
- Žliobaitė (2010) I. Žliobaitė. Learning under Concept Drift: an Overview. ArXiv e-prints, October 2010.
Appendix A Model Training Details
Models which do not implicitly handle missingness (LR, RF and LSTM) require data to be imputed. Che et al. (2018) detail a thorough list of imputation schemes in their experiments where the simple imputation scheme tends to perform well. Alternatively, Gaussian processes have been used to impute missing values in a clinical setting successfully(Lasko et al., 2013). Other works have shown that parameterising features by sequence time produces stationary and invariant sets of features(Hripcsak et al., 2015). To isolate the effect of representation on generalisability we do not explicitly test the effects of imputation schemes on the model performance in this work.
All models have hyperparameters selected via random search (Bergstra and Bengio, 2012), with parameters detailed below. Additional implementation details can be found in the code base: https://github.com/MLforHealth/MIMIC_Generalisation.
Logistic Regression (LR)
LR models are linear classification models of low capacity and moderate interpretability. Because LR does not naturally handle temporal data, 24 one-hour buckets of patient history are concatenated into one vector along with the static demographic vector. We use the LR implementation in SciKit Learn’s LogisticRegression class (Pedregosa et al., 2011). A model was selected from a random search of regularisation strength (C), regularisation type (L1 or L2), solvers (“liblinear” or “saga”), and maximum number of iterations.
Random Forest (RF)
RF models are nonlinear classification models defined using bagged decision trees which are often competitive non-neural, non-linear baseline methods. The data is prepared in the same way as the logistic regression model and the RF implementation in SciKit Learn’s RandomForestClassifier class is used. A model was selected from a random search of minimum number of samples to split a node, the minimum number of samples per leaf node, maximum depth of the tree, number of estimators in the ensemble.
Long Short-Term Memory (LSTM)
LSTM models (Hochreiter and Schmidhuber, 1997) are a popular variant of recurrent neural networks (RNNs) capable of processing arbitrary length sequences in a non-linear, high-capacity fashion. We implement a bidirectional LSTM using TensorFlow (Martín Abadi et al., 2015). We used a bidirectional LSTM model selected via a random search of dropout (0.1 0.2, 0.3, 0.4, 0.5), number of epochs (1 to 5), hidden layer size (16, 32, 64, or 128 units), activation function (tanh, ReLU), and optimizer (rmsprop, adam, adagrad).
Gated Recurrent Unit with Decay (GRU-D)
GRU-D models (Che et al., 2018) are a recent variant of recurrent neural networks (RNNs) designed to specifically model irregularly sampled timeseries by inducing learned exponential regressions to the mean for unobserved values. Note that as GRU-D is intentionally designed to account for irregularly sampled timeseries (or equivalently timeseries with missingness), evaluating it on representations that internally absorb missingness does not make sense. As such, we do not evaluate GRU-D on the PCA representation. We implemented the model in PyTorch (Paszke et al., 2017) based on (Han-JD, 2019; Cui, UW). We use a hidden layer size of 67 units, batch normalisation(Ioffe and Szegedy, 2015), and dropout with a probability of 0.5 on the classification layer like in the original work (Che et al., 2018). The Adam optimizer (Kingma and Ba, 2014) is applied with the early stopping criteria(Che et al., 2018).
Tuning Procedure
For the RF, LR and LSTM classifiers, 5-fold cross validation was applied to the training data, using a random search to find best parameters for maximum area under the receiver-operator curve (AUROC) on the validation split. For the GRU-D model, we use the early stopping criteria on the validation during training to find the best model for the specified hyper-parameters (variance shown is only attributable to the train/validation split).
Appendix B Feature aggregation description
In MIMIC-III, CHARTEVENTS with ItemIDs 861, 1127, 1542, and 220546 are averaged into one feature in the Clinically Aggregated feature vector called White blood cell count. Note that ItemIDs 861, 1127, and 1542 were recorded in the 2001–2008 system and ItfemID 220546 was recorded in the 2008–2012 system.
A full description of the clinical aggregations can be found in Wang et al. (2019).
Appendix C Task Descriptions
In-ICU Mortality Task.
In-ICU Mortality is defined by patient death within the ICU. Mortality prediction in general is a common prediction target (Harutyunyan et al., 2017; Purushotham et al., 2018) as it is a direct signal of acuity strongly associated with EHR signals. The ICU mortality rate of patients in our subset is 7.4%. We also know that policy changes from the Affordable Care Act led to a changes in clinical practice regarding mortality prevention (Kocher et al., 2010).
Long LOS Task.
Predicting long LOS has significant utility in clinical operations management, and has been predicted repeatedly in prior work (Harutyunyan et al., 2017; Purushotham et al., 2018). In this work, we define a “long LOS” to be a LOS greater than the median LOS we observe in our cohort (3 days). We use the same data as described previously to predict if a patient will need to be in the ICU for greater than or less than 3 days, e.g., a binary label of 0 if length-of-stay is less than 3 days, otherwise 1. This creates a 47.1% positive subject rate in-task. This task has the added benefit of investigating date randomisation effects in a more balanced-class problem without a directly targeted policy change.
Appendix D Year Agnostic Results
Tables 2 & 3 contain the model performances when trained without knowledge of the years (5 x 2 fold CV splits (Dietterich, 1998)).
| Model | Average AUROC for Random Splits | |||
|---|---|---|---|---|
| Raw | PCA | CUI Code Spanning | Clinical | |
| LR | ||||
| RF | ||||
| LSTM | ||||
| GRUD | - | |||
| Model | Average AUROC | |||
|---|---|---|---|---|
| Raw | PCA | CUI Code Spanning | Clinical | |
| LR | ||||
| RF | ||||
| LSTM | ||||
| GRUD | ||||
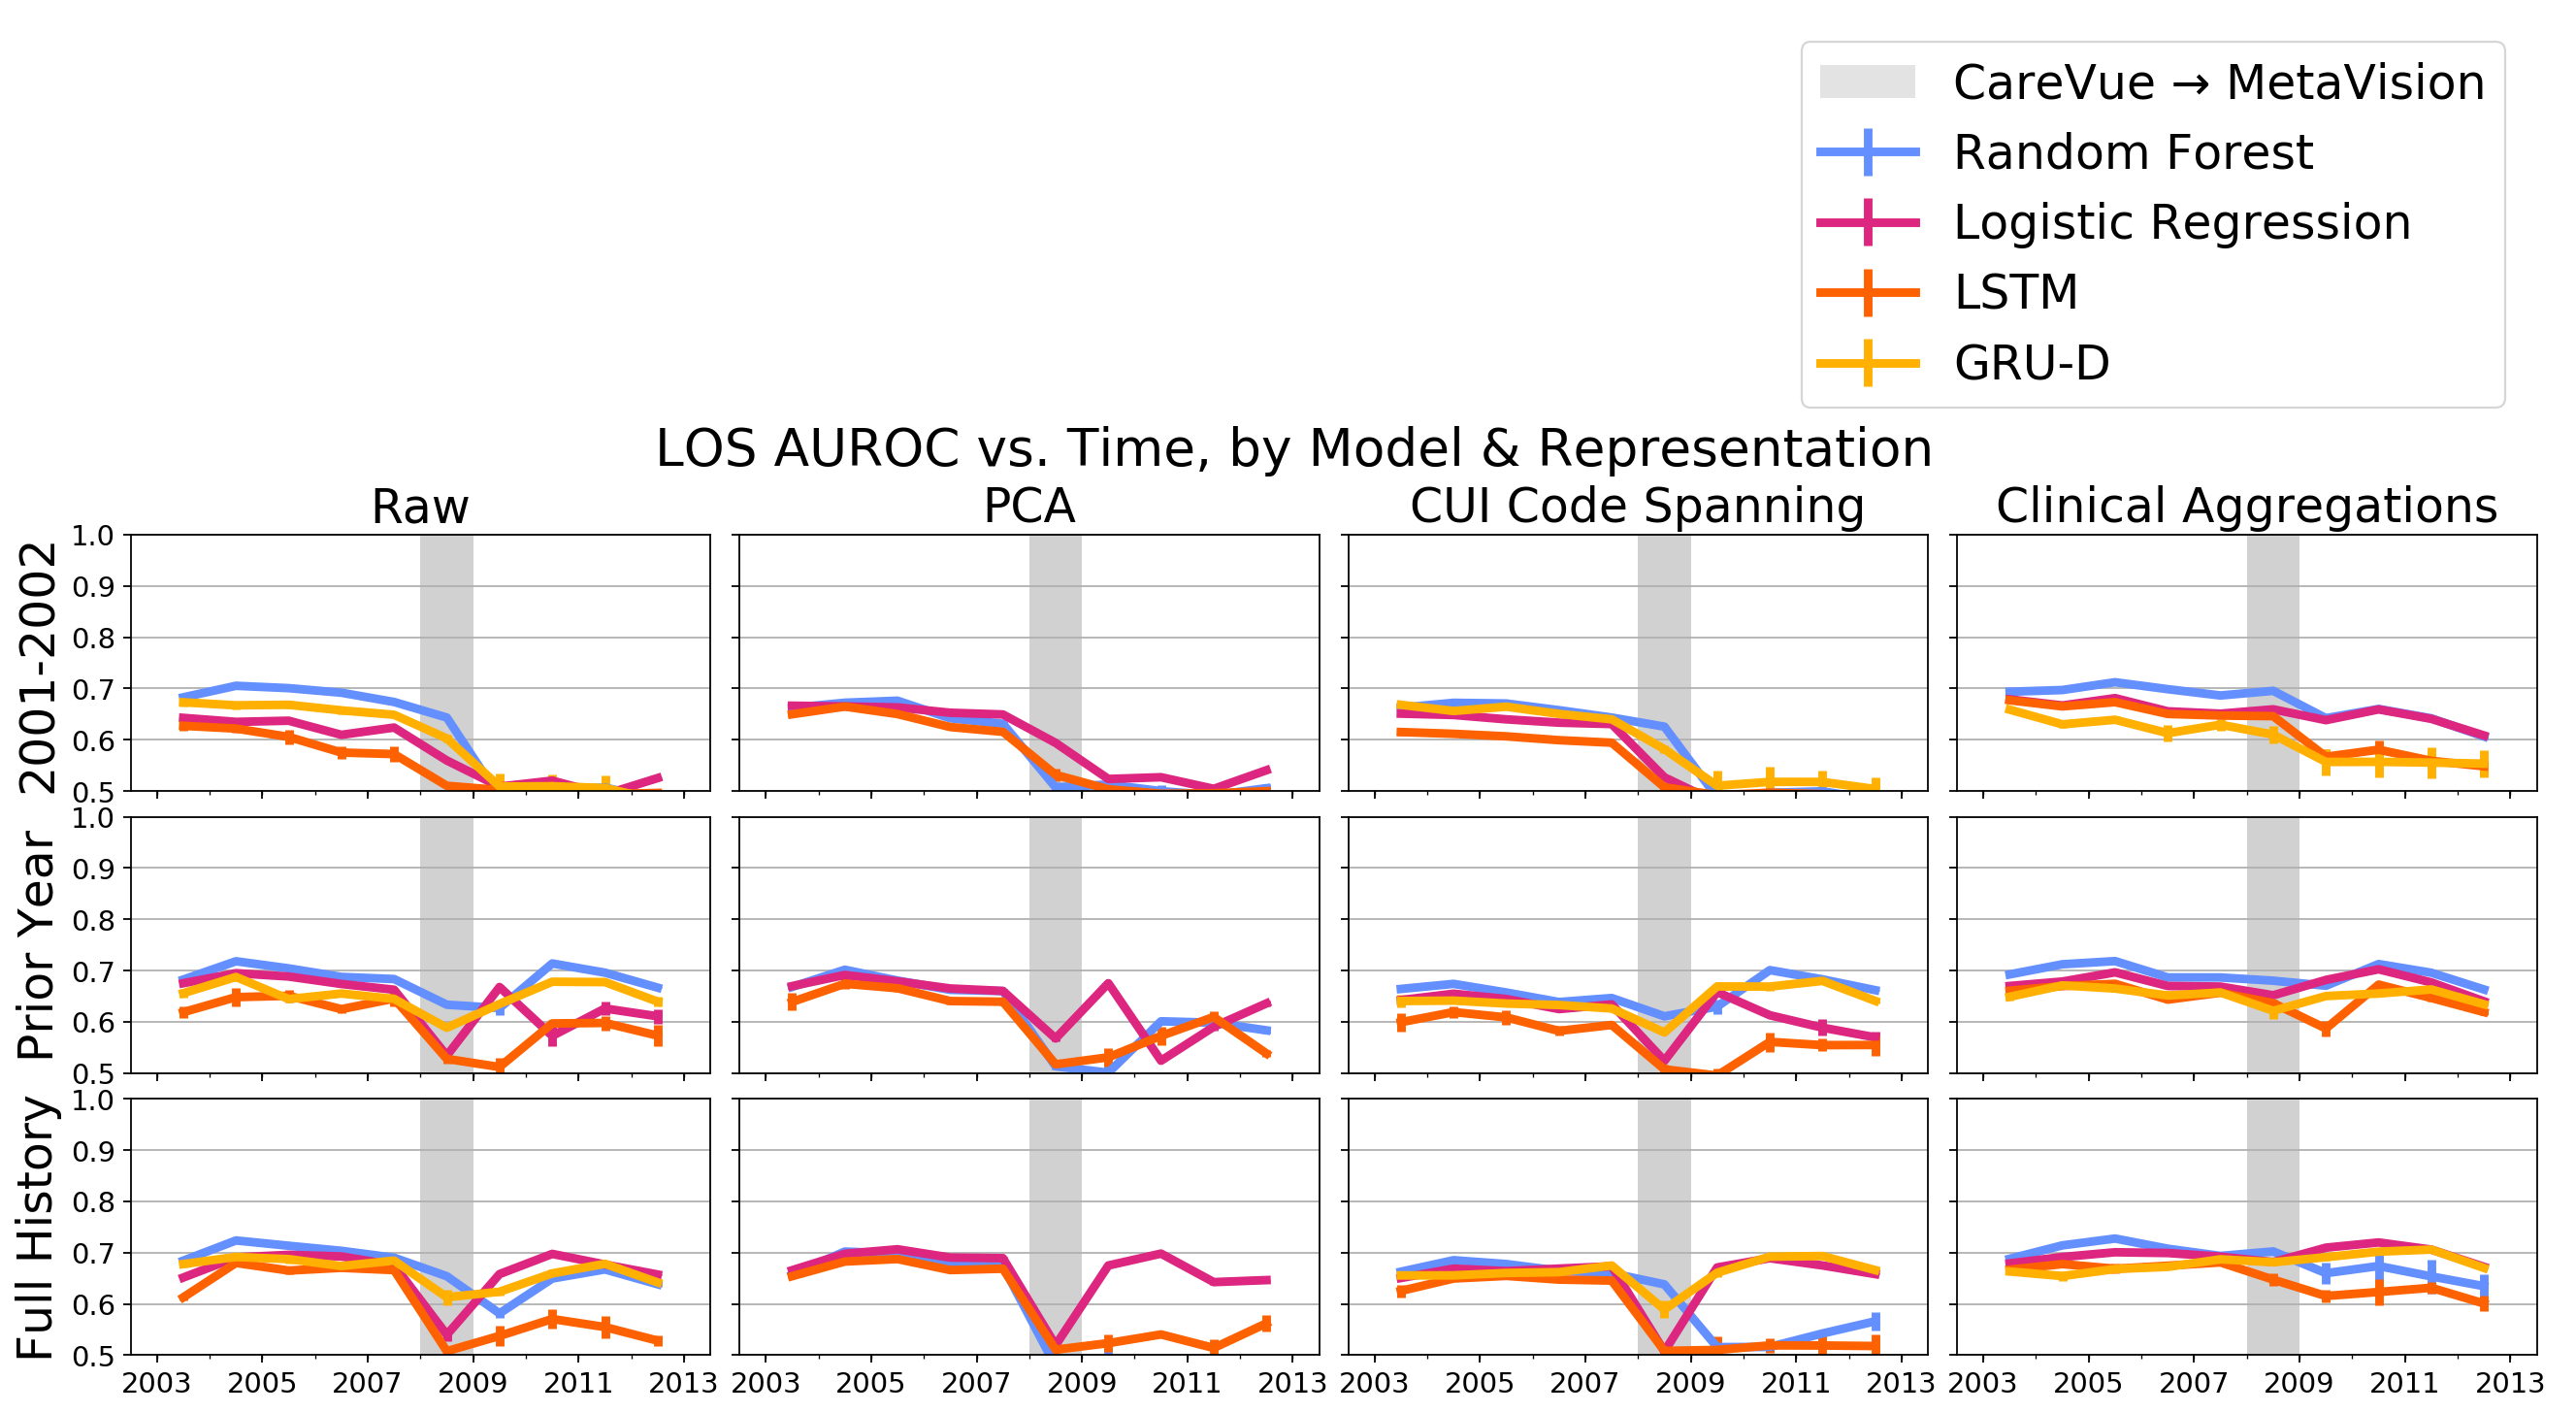
Appendix E Performance on Length-of-Stay Task
We show the full results for the LOS task reported on in the main text of this work here. As noted previously, much of the commentary for mortality holds here as well. Figure 6 shows the AUROC of various models over time across all our representations and training regimes. Similar to the results in Figure 3, we see dramatic decays in response to the CareVue to MetaVision shift, which are recovered by the clinical aggregation representation. Again, similar to Figure 3, under training regimes that offer insufficient prior data, we see general decay year-over-year as well. Table 4 compares the average ( standard deviation) AUROCs and maximum drop in AUROC observed when comparing the first year of evaluation to each subsequent unseen year from 2003 onward using the Full History training regime between the Raw and Clinical Aggregation representations.
| Model | Average AUROC | Max AUROC Drop | |||
|---|---|---|---|---|---|
| Raw | Clinical | Raw | Clinical | ||
| LR | 0.69 0.02 | ||||
| RF | 0.68 0.03 | ||||
| LSTM | 0.65 0.03 | ||||
| GRUD | 0.67 0.03 | ||||
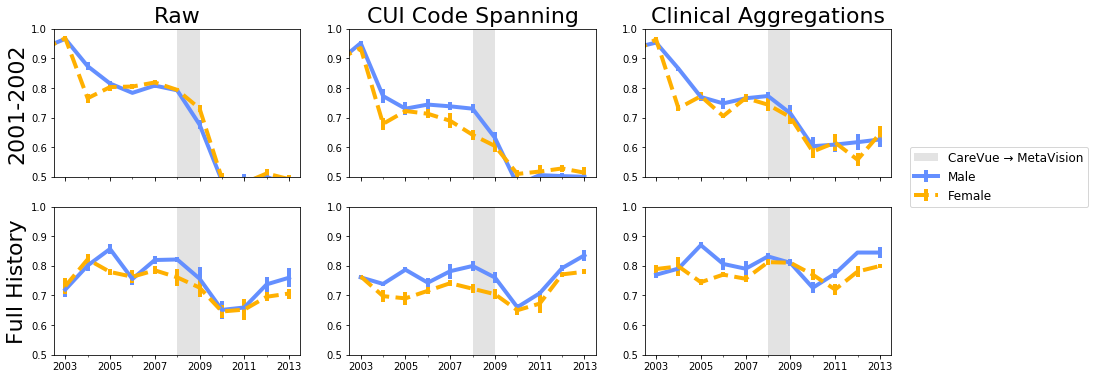
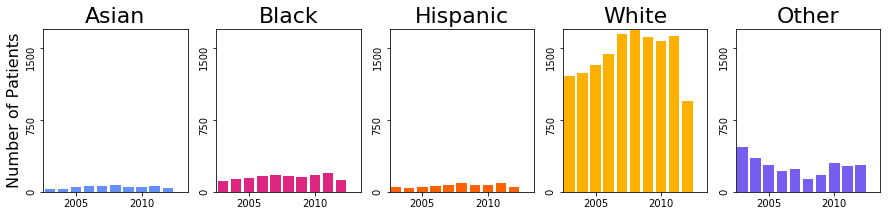
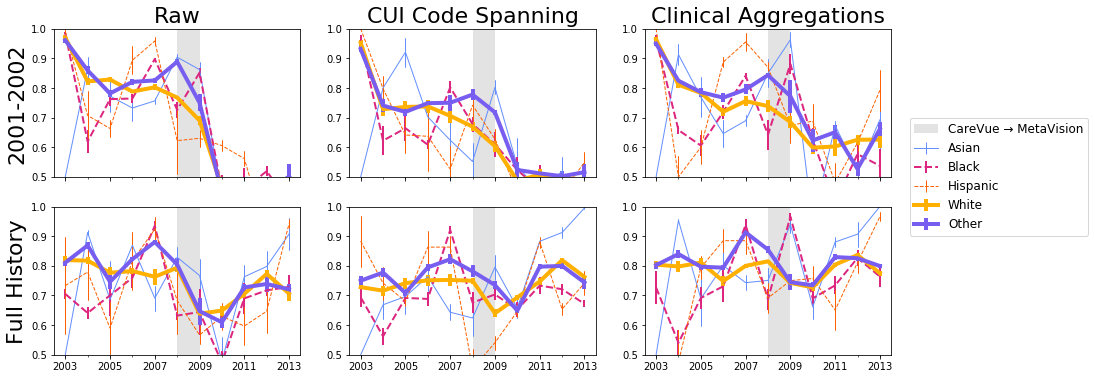
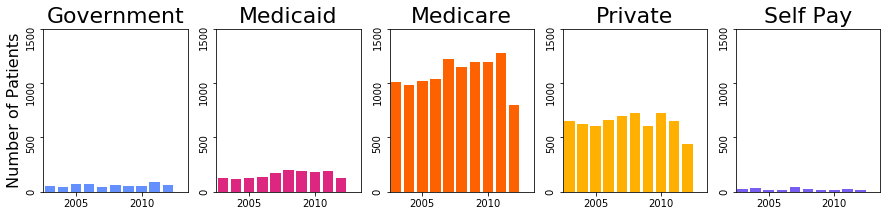
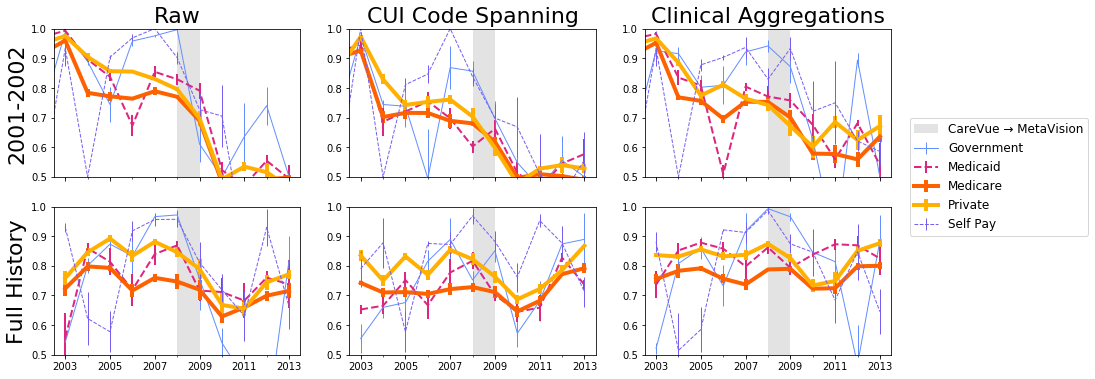
Appendix F Subpopulation Sensitivity Analyses
Here, we consider subpopulation sensitivity. In Figure 7 we partition our prediction task across gender. In Figure 9 we partition our prediction task across ethnicity. A bidirectional LSTM shown on all representations. In Figure 8 we show the occurrence of each of the sensitive groups from Figure 9. The predictive performance is erratic for groups with fewer samples. In Figure 11 we partition our prediction task across insurance type. The performance is demonstrated for the GRU-D model In Figure 10 we show the occurrence of each insurance type from Figure 11. Note that unlike ethnicity, insurance type was not included in our feature sets. Self-pay patients and government insurance patients have highly erratic mortality results due to the lack of training samples. Models deteriorated slower for individuals with private insurance as opposed to individuals with Medicaid. The deterioration of performance (both gradual, and over the CareVue/MetaVision shift) is shown in Figure 11.