22email: weiskopf@visus.uni-stuttgart.de
ORCID iD: https://orcid.org/0000-0003-1174-1026
This is a preprint of a chapter for a planned book that was initiated by participants of the Dagstuhl Seminar 18041 (“Foundations of Data Visualization”) and that is expected to be published by Springer. The final book chapter will differ from this preprint.
Vis4Vis: Visualization for (Empirical) Visualization Research
Abstract
Appropriate evaluation is a key component in visualization research. It is typically based on empirical studies that assess visualization components or complete systems. While such studies often include the user of the visualization, empirical research is not necessarily restricted to user studies but may also address the technical performance of a visualization system such as its computational speed or memory consumption. Any such empirical experiment faces the issue that the underlying visualization is becoming increasingly sophisticated, leading to an increasingly difficult evaluation in complex environments. Therefore, many of the established methods of empirical studies can no longer capture the full complexity of the evaluation. One promising solution is the use of data-rich observations that we can acquire during studies to obtain more reliable interpretations of empirical research. For example, we have been witnessing an increasing availability and use of physiological sensor information from eye tracking, electrodermal activity sensors, electroencephalography, etc. Other examples are various kinds of logs of user activities such as mouse, keyboard, or touch interaction. Such data-rich empirical studies promise to be especially useful for studies in the wild and similar scenarios outside of the controlled laboratory environment. However, with the growing availability of large, complex, time-dependent, heterogeneous, and unstructured observational data, we are facing the new challenge of how we can analyze such data. This challenge can be addressed by establishing the subfield of visualization for visualization (Vis4Vis): visualization as a means of analyzing and communicating data from empirical studies to advance visualization research.
1 Introduction
This position statement primarily focuses on empirical studies with user involvement but also touches other empirical studies that may collect data from technical performance benchmarks to assess the computational characteristics of a visualization system.
I argue that we need to establish a new subfield to address the challenges of empirical evaluation in visualization research:
We need visualization for visualization (Vis4Vis).
\endMakeFramed
The underlying problem is the difficulty in performing an appropriate evaluation for complex visualization systems. For these, many of the traditional approaches to empirical research adopted from other fields cannot be used directly. Section 2 provides background references that discuss various aspects of the underlying problems, methodological challenges, and possible solutions.
I argue that one promising route is to use as much information as possible from empirical studies. Unfortunately, many of the traditional methods for user studies and other empirical research in visualization come from other fields and earlier times in which there was much less data accessible from studies. One example of such data that is still underutilized in visualization research is gaze data from eye tracking experiments. Section 3 discusses examples of eye tracking in visualization research in more detail. However, there are many other potential sources of sensor data that could be collected. Several of these examples rely on physiological sensors, often in the context of work on human-computer interaction (HCI): electroencephalography (EEG) Anderson:2011:USV and, in general, the use of brain-computer interfaces (BCIs) and EEG for interaction Gurkok:2012:BCI , pervasive BCI Peck:2010:YBY , near-infrared spectroscopy (NIRS) Hirshfield:2011:TYB ; Strait:2014:RNB , functional magnetic resonance imaging (fMRI) Cui:2011:QCN , or the combination of several physiological sensors to characterize emotions Wagner:2005:PSE or investigate interfaces Prendinger:2005:UHP .
However, data is not restricted to coming from physiological sensors. For example, logging user activities with the visualization interface, based on recording mouse, keyboard, touch, or other ways of interaction, can provide a detailed and rich source of highly relevant information Vuillemot:2016:LIV . Other examples are video and audio recordings during user studies that can serve as a basis for think-aloud protocol analysis Ericsson:1993:PAV .
Overall, technological advances for various kinds of sensors and other data sources have made it easy and cost-effective to capture largely increasing amounts of data for empirical visualization research. And with further progress in technology, in particular, for non-stationary or wearable devices for visualization and user studies, we will see even more diverse types of user studies in visualization research. A recent trend in the visualization community addresses immersive analytics Marriott:2018:IA , which will lead to the problem of evaluating visualizations in the context of virtual reality or augmented reality.
With the challenges of empirical research for complex visualizations on the one hand, and opportunities that come with advanced data acquisition on the other hand, we will have to rethink how we can conduct, evaluate, and report empirical studies. With this text, I focus on the issues related to data analysis for the evaluation and reporting of the results of studies based on large, complex, time-dependent, heterogeneous, and unstructured observational data. I argue that visual data analysis and communication is a promising approach to address these issues. Accordingly, I will discuss opportunities and open questions for visualization research. My proposal for the need for Vis4Vis, especially in the context of empirical visualization research, extends my position statement that I gave as part of the panel discussion at the 2016 Workshop on Beyond Time And Errors: Novel Evaluation Methods For Visualization (BELIV).111Panel “On the Future of Evaluation and BELIV” with panelists Daniel Weiskopf, Laura McNamara, Mark Whiting, Niklas Elmqvist, and Tamara Munzner, BELIV 2016 (Workshop on Beyond Time And Errors: Novel Evaluation Methods For Visualization) at IEEE VIS 2016. https://beliv-workshop.github.io/2016/schedule.html
2 Background of Empirical Studies
The relevance of empirical studies for evaluation, especially user-oriented evaluation, is well accepted by the visualization research community. In general, there are many well-established approaches to empirical studies for visualization and visual analytics Carpendale:08:EIV ; Plaisant:2004:CIV ; Wijk:2013:ECV . Tory Tory:14:USV provides a recent overview and categorization of user study approaches, covering various quantitative and qualitative methods. Freitas et al. Freitas:14:HIC discuss a user-centered perspective on evaluation. There are also examples in which different types of study methods are combined, including the combination of usability metrics and eye tracking Coltekin:2009:EEI .
Evaluation methodology is the special focus of the series of BELIV Workshops, which investigate approaches beyond the traditional user performance measures of completion time and accuracy. Therefore, many BELIV Workshop papers address topics relevant to this text. For example, Elmqvist and Yi Elmqvist:12:PVE describe a collection of patterns for evaluation, Ellis and Dix Ellis:06:EAU provide an explorative analysis of user studies, Lam and Munzner Lam:08:IUQ discuss quantitative empirical studies in the context of meta analysis, and Anderson Anderson:12:EVU employs cognitive measures for evaluation.
However, the above papers do not focus on empirical studies that use rich sets of observations. However, Kurzhals et al. Kurzhals:2014:EVA ; Kurzhals:2016:ETE consider this approach as critical for future and improved evaluation methods for visual analytics. They especially focus on the combination of eye tracking information with traditional task performance indicators, but they also discuss the issue of data fusion integrating further time-oriented data acquired during an empirical study. One example is the combination of eye tracking and interaction logs Blascheck:2014:TAE . Kurzhals et al. Kurzhals:2014:EVA call for exploratory data analysis and hypothesis building to address the difficult analysis questions that come with complex data. In follow-up work, Kurzhals et al. Kurzhals:2016:TBV adopt the perspective of analysis tasks on eye tracking data, with a respective overview of such tasks.
A further step in the direction of integrating different data sources from empirical research into an interactive visual analysis approach was taken by Blascheck et al. Blascheck2016:VA2 ; Blascheck:2016:TUB : they describe how visual analytics methods can be used to evaluate visual analytics systems, for example, by including think-aloud protocol analysis, eye tracking information, or interaction data from the same experiment. Blascheck et al. Blascheck:2016:VAC enrich this approach by integrating visual data analysis and coding of user behavior.
I argue to follow-up and extend this direction of advanced visualization methods for analyzing complex and rich data sources. This will become particularly relevant for studies that address more complex research questions than in traditional, quite focused, and restricted laboratory studies. A trend in HCI and other communities tries to address realistic scenarios by adopting research in the wild Crabtree:2013:ISI , following early work on cognition in the wild from the perspective of anthropology Hutchins:1995:CW ; Lave:1988:CP ; Suchman:1987:PSA . A related evaluation need has been identified in the visualization community by Lam et al. Lam:2012:ESI and Isenberg et al. Isenberg:2013:SRP . They discuss scenarios that go beyond traditional user experience, user performance, or (technical) algorithm performance, for example, how we can evaluate communication through visualization, visual data analysis and reasoning, or collaborative visual data analysis. I am convinced that the visualization of data-rich recordings will be especially useful for empirical research in such areas.
3 Example: Eye Tracking Studies and Evaluation
Let us use eye tracking studies as one example of experimental research with data-rich observations. Gaze is a highly relevant source of data for empirical visualization research because it provides quite accurate and fast information that can be useful to understand attention, reading patterns, and the like. Even though there is not always a direct interpretation of eye tracking data Kim:2012:DET , most studies can be set up in a way that eye tracking provides informative feedback if it is used with the right study design and interpretation of results Goldberg:10:CIG . Eye tracking might even be an alternative way to measure indicators of insight North:2006:TMV . Background on eye tracking is described in the books by Duchowski Duchowski:2007:ETM and Holmqvist et al. Holmqvist:2011:ETC .
This section focuses on eye tracking for user studies and how we can visually analyze gaze information acquired in such studies. There are other, yet related applications of eye tracking: For example, gaze can serve as a basis for interaction techniques Jacob:2003:ETH , eye movements can be employed for activity recognition Bulling:2011:EMA ; Fathi:2012:LRD , eye tracking can help identify tasks and abilities of users of information visualizations Steichen:2013:UAI , and it can be used to improve interactive visualization by recommendations built on inferred user interest Shao:2017:VEL ; Silva:2018:LEG and by adaptive interfaces based on the recognition of user tasks and intent Silva:2019:ETS .
Now, let us focus on eye tracking in empirical visualization research. Extending the fundamental visualization pipeline Chi:2000:TVT ; Haber:1990:VIC , the process of acquisition and visual analysis of eye tracking data can be described by the pipeline of Figure 1, as defined by Kurzhals et al. Kurzhals:2016:TBV . The study data consists of gaze information and—potentially—further complementary data. These are processed and annotated before the mapping to the visualization is computed. The overarching process consists of two interlinked loops: a foraging loop to investigate and explore the study observables, and a sensemaking loop for the interpretation of the data Pirolli:2005:SPV . This interpretation may lead to confirming, rejecting, or building new hypotheses.
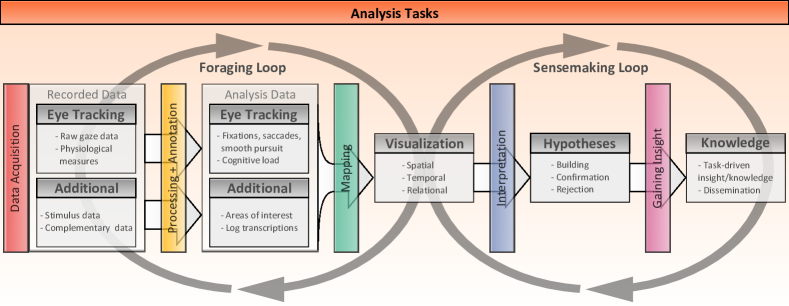
Figure 1 shows that data-rich information from eye tracking leads to a quite complex data analysis problem. General, rather high-level analysis tasks include compare, relate, and detect Kurzhals:2016:TBV . There are a number of specific questions such as: on which parameters or data are these tasks performed (independent or dependent variables), do we want to define derived variables from raw data (other types of independent or dependent variables), which visualization techniques support these tasks and data types, what are the eventual research questions that should be answered by the analysis?
There is a comprehensive overview of visualization techniques for eye tracking data Blascheck:14:SAV ; Blascheck:2017:VET , along with a taxonomy that incorporates types of data, stimuli, and visualization techniques. Alternatively, Andrienko et al. Andrienko:2012:VAM provide a critical assessment and review of geo-inspired visual analytics techniques from the perspective of eye tracking analysis. These overview and review papers are a good starting point for choosing appropriate visualization techniques, depending on the visual analysis problem; see center part of Figure 1.
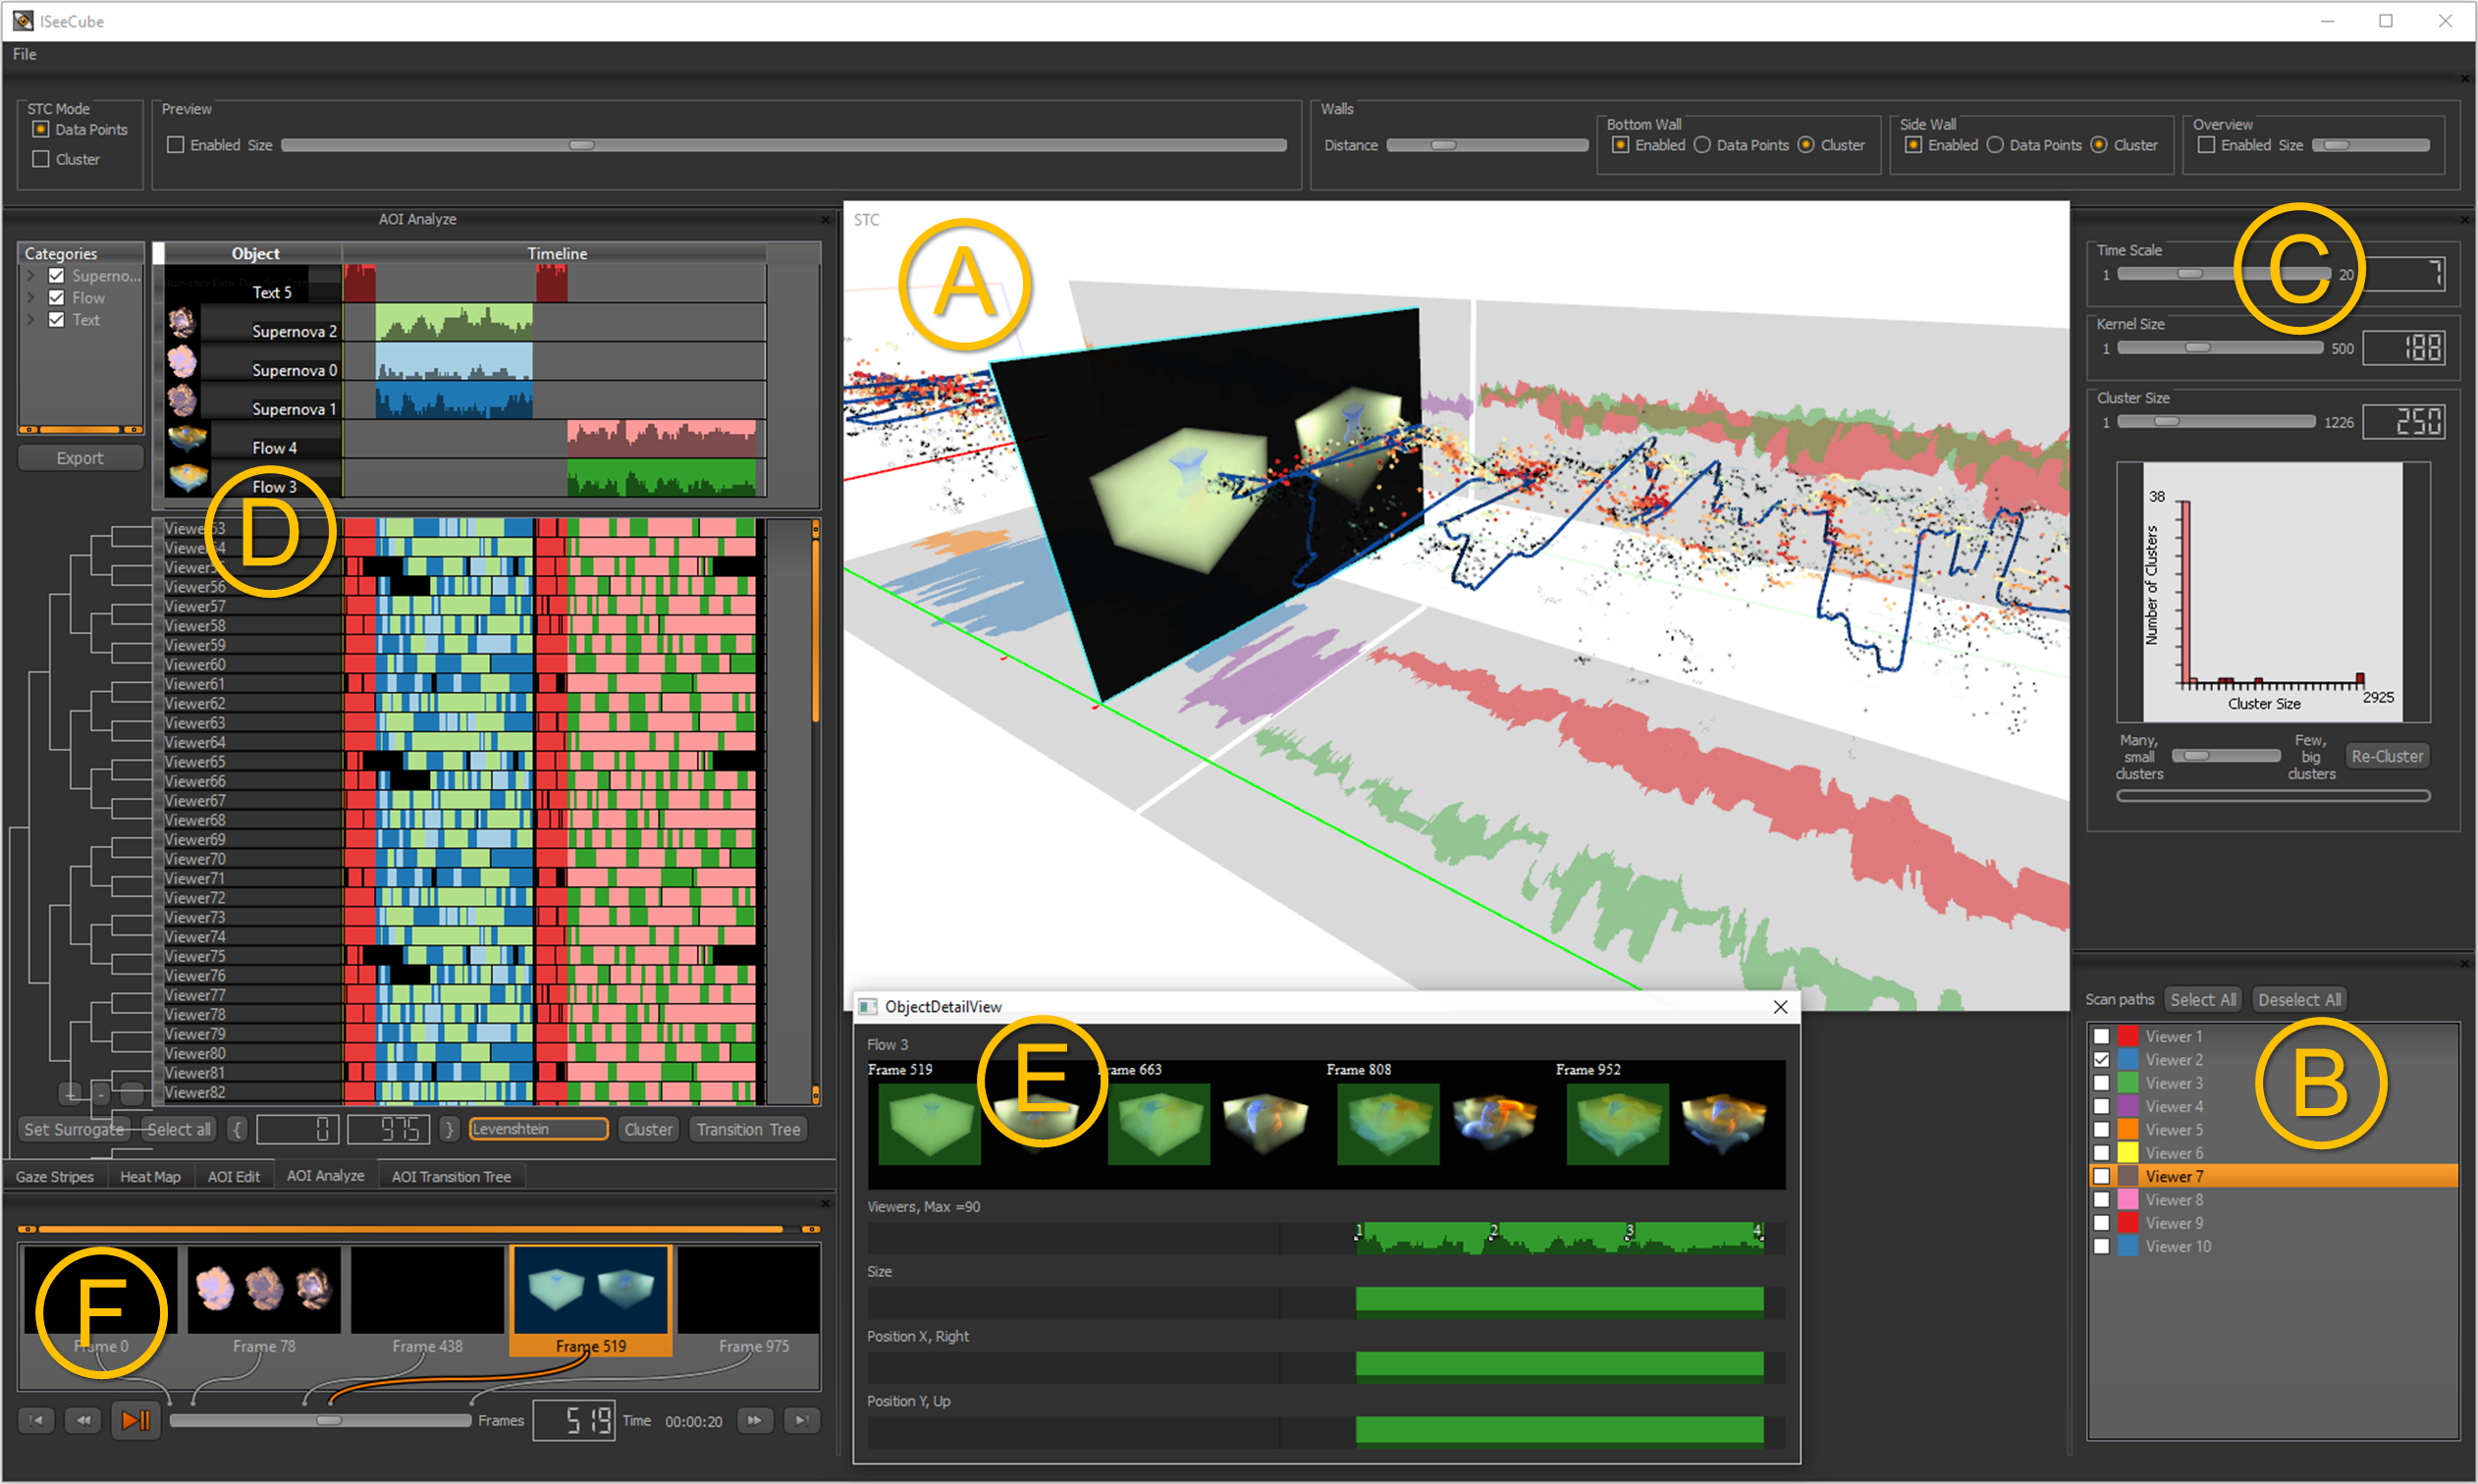
Overall, there has been quite some progress recently in novel and improved visualization techniques to support the evaluation of eye tracking studies. In particular, there are techniques that allow researchers to combine spatiotemporal gaze analysis Kurzhals:2013:STV with the integrated interpretation of scanpaths and areas of interest (AOIs) Kurzhals:2014:ISC (see Figure 2 for an example), visually compare scanpaths Koch:2018:IBS , examine large sets of gaze trajectories by bundling Hurter:2013:BVD , analyze time-dependent AOIs for long-timespan studies Muthumanickam:2019:ITV , work with fixation metrics for the large-scale analysis of information visualizations Bylinskii:2015:EFM , show gaze and stimulus simultaneously in a volume representation Bruder:2019:STV , or relate gaze to data of interest in a visualization Jianu:2018:DMT .
There are many examples of the usefulness of such visual data analysis for eye tracking experiments. Typically, visual data analysis is a critical component in pilot studies that can then inform the design of the study process and statistical evaluation. I just want to briefly sketch a few typical examples of how visualization supported our own previous work on eye tracking evaluation of visualization techniques. One example is an eye tracking study that compares parallel coordinates and scatterplots Netzel:2017:CET . Here, the visualization of scanpaths, attention, and AOIs for pilot studies helped us formulate hypotheses that eventually led to an advanced computational description of transitions between AOIs that could be used for statistical testing of complex reading behavior. Similarly, for an eye tracking study on transportation maps Netzel:2017:UPR , visualization allowed us to define a new numerical indicator for geodesic distance plots that served as a basis for statistical inference on reading behaviors. Finally, Burch et al. Burch:2013:VTS showcased many different types of visualization techniques and discussed how they could be used to identify qualitative findings in eye tracking data from a study on tree visualization techniques Burch:2011:ETO : visualization allowed us to identify reading strategies, reasons for the bad performance of radial tree layouts, and spatiotemporal characteristics of the eye tracking information.
Despite the advances in visual analysis and the above success stories, Kurzhals et al. Kurzhals:2016:ETE pointed out a number of open issues related to evaluating visualization and visual analytics with eye tracking: we are still missing sufficient methods for scanpath comparison, fusion of different data sources (e.g., gaze with interaction logs or EEG), and practical tools and working analysis systems. Furthermore, Kurzhals et al. see the need of linking to cognitive models and translational evaluation of human cognition, which asks for building an interdisciplinary community that combines expertise in computer, cognitive, and social sciences. I think that these issues still remain as challenges today. In particular, the combination of data from different sources is a key aspect that needs to be addressed further. There is a need to reach out beyond eye tracking alone and include various other types of data that we can access during studies.
Another challenge is scalability, especially if we want to address long-timespan studies and/or studies with large numbers of participants, leading to a big data visual analytics problem for eye tracking Blascheck:15:CPB . This problem will also arise when visualization is evaluated with pervasive eye tracking Chuang:2019:UGS , unconstrained mobile eye tracking, or in-the-wild research, typically with mobile eye tracking glasses. The analysis becomes challenging here because each study participant will see individual stimuli, which makes it hard to register or align gaze data between participants and relate them to the semantics of objects from the stimuli. In fact, the data analysis has to include much analysis for time-varying image data acquired by the world camera of the eye tracking glasses. There are some first attempts in this direction Kurzhals:2017:VAM that combine computer-based image analysis with visual interaction, but we are still far from a simple, reliable, and time-efficient analysis process.
Up to now, the discussion has focused on eye tracking as an element of methods for quantitative research. However, for a more comprehensive evaluation approach, qualitative methods should also be considered—typically leading to a combination in the form of mixed methods Johnson:2007:TDM . I see an integration of data-rich research methods (often the quantitative ones, especially when based on physiological sensors like eye tracking) with data-poor research methods (often the qualitative ones) as another area where visualization can play an important role. An example of this research direction is the triangulation of different approaches (here, gaze combined with think-aloud protocol analysis and interaction logs) by Blascheck et al. Blascheck2016:VA2 ; Blascheck:2016:TUB . Taking this approach further, visual analysis and coding of participants’ behavior and actions are possible Blascheck:2016:VAC , integrating data-rich gaze information in the form of word-sized graphics Beck:2015:EWS with other sources of information from experiments.
4 Generalized Problem Characterization
The above discussion was centered around the specific example of eye tracking studies and the evaluation of the results of such studies. Many of the basic challenges already occur in this context of eye tracking and carry over to other types of studies. This section extends the discussion to a generalized view on visual data analysis for empirical visualization research.
4.1 Data and Visualization Types
The choice of visualization technique largely depends on the type of data that needs to be analyzed. In general, observational data will be large, complex, time-dependent, heterogeneous, and unstructured, coming from different types of sensors or information sources. However, in general, we can assume that observational data can be assigned some time stamp, i.e., data even from different sources can be eventually registered along the timeline (even though it might be difficult technically). In other words, the underlying data model is that of a time-dependent data set with different types of time-varying data attributes.
The actual data attributes can be of largely varying type, and they may not be sampled at the same timepoints or same frequency. Some might not even be sampled at points in time, but spread across the timeline or even be associated with the full trial (i.e., the full timeline). There is a large set of potential variables that could be acquired as raw data during the experiments- Typical types of time-series data consist of multidimensional data, i.e., multiple real-valued fields, or multiple categorical (nominal) data attributes (e.g., categories of events from user logs). Other types of much larger data sources include videos (images) and audio that may, for example, be recorded for protocol analysis or mobile eye tracking. Data may also include information about technical or algorithmic measures of performance Bruder:2019:ERP ; Larsen:2016:PMI ; Rizzi:2014:PMV . For any kind of such data, we may also obtain measures of reliability or uncertainty, which is relevant for many types of sensor data.
The characterization of data does not stop at the stage of the original or raw data. In fact, many examples of visual analysis work on derived data that might be more informative than raw data. For the example of eye tracking in Figure 1, the ‘analysis data’ is typically derived data. Preferably, the derived data is fully automatically computed from the original sources, but there might be cases where user intervention might be required, for example, for the visual-interactive annotation of data.
The choice of visualization technique(s) depends on the type of data to be analyzed. A general strategy is to use multiple coordinated views to support several data attributes Roberts:2007:CMV . More integrated visual representations may lead to better results but typically require a specific visual design. To address the complexity of the data analysis problem and facilitate scalability to large data, interactive visualization is routinely combined with automatic data analysis—such as statistical methods, unsupervised, or supervised learning—in a visual analytics setup. Finally, the choice of visualization may also depend on the independent variables, for example, whether we have to analyze data for individual participants or groups of participates, or whether we need comparative visualization to show differences with respect to independent variables.
4.2 Analysis and Dissemination Goals
Of course, the choice of visualization technique also depends on the goals of the analysis. Typical analysis tasks include outlier detection, summarization, aggregation, or grouping. A related perspective on data analysis goals for knowledge discovery in databases (KDD) is provided by Fayyad et al. Fayyad:1996:KDD . Where possible, automatic data analysis or statistical techniques are employed to support the task, but as discussed above, the typical approach will follow the combination with interactive visualization. In particular, the visual analysis should also include the original input data or stimuli. The analysis of qualitative aspects of studies is especially challenging Corbin:2015:BQR ; a general approach is based on coding such qualitative study data Saldana:2015:CMQ .
A fundamental issue of any visual data analysis is the question of reliability: interactive data exploration might lead to different findings, depending on the interaction steps taken by the analyst. This issue is present for the analysis of study data as well; after all, we want reliable and robust results from studies. Therefore, interactive visualization is typically accompanied by statistical analysis to obtain more controlled answers, yet based on hypotheses informed by visualization. The sensemaking loop of Figure 1 indicates hypothesis building and testing for the example of eye tracking experiments; however, the general structure of the sensemaking loop extends to any kind of experimental evaluation and could include statistical testing.
Another issue is related to properly planning the setup of the studies. Their quality critically depends on an appropriate choice of stimuli or other input shown to the participants. Therefore, the generation of input data is of high relevance to support informative results of studies or facilitate benchmarking. A promising approach employs generative data models to do so Schulz:2016:GDM .
Finally, the goal of visualization does not stop at data analysis. In fact, visualization is equally relevant for disseminating results of studies after interpretation and insight generation in the sensemaking loop of Figure 1. Therefore, visualization approaches for dissemination Beck:2016:VAD and storytelling Lee:2015:MTT ; Ma:2012:SSU are required.
5 Future Research Perspectives and Call for Action
Based on the specific observations and experiences with eye-tracking-based empirical visualization research (Section 3) and the generalized problem characterization (Section 4), I have identified the following, quite subjective recommendations for future research directions and a call for action.
Let us be our own domain experts: visualization for visualization (Vis4Vis)!
\endMakeFramed
I argue that we should prominently position visualization research as an application domain for visualization. So far, the call for papers and keywords in the paper submission systems of the main conferences of the visualization community (IEEE VIS, EuroVis, PacificVis) specifically ask for application or design study papers, but they do not explicitly consider visualization research—even in cases where they list many other research areas. Furthermore, the call for papers and submission keywords typically contain empirical research, especially user studies, but they focus on actual studies and not on methods that support the evaluation of studies. The series of BELIV Workshops is a good example of a venue that specifically asks for the development of research methods and, thus, implicitly supports the topic of Vis4Vis. Similarly, the series of Workshops on Eye Tracking and Visualization (ETVIS)222ETVIS: Workshop on Eye Tracking and Visualization. https://www.etvis.org Burch:2016:ETV facilitates such research, yet restricted to eye tracking.
To advance our field, a more prominent integration of Vis4Vis in the main conferences would be helpful. Being our own domain experts has several benefits. First, we have an intrinsic and tight link to assessing whether our visual data analysis methods work well or how they need to be improved, leading to short development cycles; therefore, we can expect a fast development of useful visualization techniques that may even carry over to applications beyond those for empirical visualization research. Second, we will benefit from improved ways of evaluating our empirical studies, leading to a better understanding of visualization. Finally, since other disciplines such as HCI are facing similar evaluation challenges, there is a potential impact of improved data analysis for empirical research outside the visualization community.
Data-driven research for the next generation of empirical studies
in visualization!
\endMakeFramed
I am convinced that the integration of as-much-as-possible data acquired during studies is a viable way to conduct advanced empirical visualization studies that may support in-the-wild experiments, unconstrained settings, and individual participants and group work alike. Therefore, in the sense of Vis4Vis, we are facing the challenge of data fusion and combined visual analysis of massive, often messy sensor and other study data. This, in particular, may include various kinds of physiological sensor, image/video, and audio data. However, with the recent progress in machine learning, especially deep neural networks, there is a great potential that we will be able to work with data-rich experiments, with a strong emphasis on data-driven research. In fact, the combination of machine learning with visual analytics is a most promising approach to address these hard analysis problems, for example, in combination with video visual analytics Hoeferlin:2015:SVV . In this context, it will be critical to keep the original data as long as possible in the analysis pipeline in order to be able to obtain reliable results. Furthermore, it is equally important to obtain reliable and controlled results for data analysis by complementing visual analysis with rigorous statistical testing.
New ways of reporting, privacy preservation, and open science!
\endMakeFramed
With extended or new approaches to visual data analysis, we are also facing the issue of how we can report findings from empirical research. One part of this issue is the concise presentation of results, for example, in a research article. Here, traditional styles of reporting by using established statistical descriptions no longer work, but it is not yet clear how the wide variety of more complex analysis results could be summarized in a brief, yet comprehensible and replicable way. Here, visualization can play an important role in the sense of using it for storytelling of the scientific data, but respective methods are yet to be developed.
Another part of this issue is related to how we should communicate the massive data potentially acquired during studies. The straightforward approach is to provide the complete set of research data along with the publication, for example, in repositories that guarantee reliable and long-term access of open research data. However, raw data alone is not useful, and even if meta information is provided, it might still be hard to fully replicate previous studies if they come with complex data. Therefore, it might become relevant to even provide visual analysis tools and descriptions thereof along with the research data. Alternatively, our community could establish a set of tools on which the reproducibility of studies could rely, adopting similar ideas from eye tracking research Munz:2019:VMV . The issues of both storytelling and open science are connected to the development of visual data analysis methods in the sense of Vis4Vis.
Furthermore, with open empirical data, we have to carefully consider issues related to privacy of participants and research ethics. With data-rich empirical data combined from different types of sensors, we might acquire enough information that could lead to a breach of anonymity if the data is published in original raw format, i.e., there is an intrinsic conflict between open science and privacy preservation. However, visualization has the potential to help here if it is extended toward novel privacy-preserving visualizations integrated into the research process. The outcome could be privacy-preserving, modified versions of the original data that could still be shared as open research data—with sufficient details to support reproducibility of the relevant research results.
Best practices for the next generation of evaluation methods!
\endMakeFramed
The three areas of recommendations and future research directions mentioned above will have to be complemented by the adoption of the visualization techniques in the processes and reporting of empirical visualization research. To this end, I see an ongoing process of identifying best practices for novel evaluation approaches and establishing new standards of empirical research.
6 Conclusion
It is obvious that visualization for visualization (Vis4Vis) is not the only answer to the challenges that we are facing in improving our set of methods for empirical visualization research. However, I am convinced that there is room for more advanced visualization methods for data analysis and reporting to be used in the context of studies within the visualization community, eventually improving our approach to empirical research.
Acknowledgments
Funded by the Deutsche Forschungsgemeinschaft (DFG, German Research Foundation) – Project-ID 251654672 – TRR 161 (Project B01 and Task Force TF-B). I thank the participants of the Dagstuhl Seminar 18041 (“Foundations of Data Visualization”) for fruitful discussions. Special thanks to Kuno Kurzhals for the many discussions on eye tracking and visualization. The screenshot in Figure 2 was taken from his ISeeCube implementation Kurzhals:2014:ISC .
References
- (1) Anderson, E.W.: Evaluating visualization using cognitive measures. In: Proceedings of the Workshop on Beyond Time And Errors: Novel Evaluation Methods for Visualization (BELIV), pp. 1–4 (2012)
- (2) Anderson, E.W., Potter, K.C., Matzen, L.E., Shepherd, J.F., Preston, G.A., Silva, C.T.: A user study of visualization effectiveness using EEG and cognitive load. Computer Graphics Forum 30(3), 791–800 (2011)
- (3) Andrienko, G.L., Andrienko, N.V., Burch, M., Weiskopf, D.: Visual analytics methodology for eye movement studies. IEEE Transactions on Visualization and Computer Graphics 18(12), 2889–2898 (2012)
- (4) Beck, F., Blascheck, T., Ertl, T., Weiskopf, D.: Exploring word-sized graphics for visualizing eye tracking data within transcribed experiment recordings. In: M. Burch, L. Chuang, B. Fisher, A. Schmidt, D. Weiskopf (eds.) Eye Tracking and Visualization: Foundations, Techniques, and Applications, pp. 113–128. Springer (2016)
- (5) Beck, F., Koch, S., Weiskopf, D.: Visual analysis and dissemination of scientific literature collections with SurVis. IEEE Transactions on Visualization and Computer Graphics 22(1), 180–189 (2016)
- (6) Blascheck, T., Beck, F., Baltes, S., Ertl, T., Weiskopf, D.: Visual analysis and coding of data-rich user behavior. In: Proceedings of the IEEE Conference on Visual Analytics Science and Technology, pp. 141–150 (2016)
- (7) Blascheck, T., Burch, M., Raschke, M., Weiskopf, D.: Challenges and perspectives in big eye-movement data visual analytics. In: Proceedings of the IEEE International Symposium on Big Data Visual Analytics, pp. 1–8 (2015)
- (8) Blascheck, T., Ertl, T.: Towards analyzing eye tracking data for evaluating interactive visualization systems. In: Proceedings of the Workshop on Beyond Time And Errors: Novel Evaluation Methods for Visualization (BELIV), pp. 70–77 (2014)
- (9) Blascheck, T., John, M., Koch, S., Bruder, L., Ertl, T.: Triangulating user behavior using eye movement, interaction, and think aloud data. In: Proceedings of the ACM Symposium on Eye Tracking Research & Applications, pp. 175–182 (2016)
- (10) Blascheck, T., John, M., Kurzhals, K., Koch, S., Ertl, T.: VA2: A visual analytics approach for evaluating visual analytics applications. IEEE Transactions on Visualization and Computer Graphics 22, 61–70 (2016)
- (11) Blascheck, T., Kurzhals, K., Raschke, M., Burch, M., Weiskopf, D., Ertl, T.: State-of-the-art of visualization for eye tracking data. In: EuroVis – STARs, pp. 63–82 (2014)
- (12) Blascheck, T., Kurzhals, K., Raschke, M., Burch, M., Weiskopf, D., Ertl, T.: Visualization of eye tracking data: A taxonomy and survey. Computer Graphics Forum 36(8), 260–284 (2017)
- (13) Bruder, V., Kurzhals, K., Frey, S., Weiskopf, D., Ertl, T.: Space-time volume visualization of gaze and stimulus. In: Proceedings of the ACM Symposium on Eye Tracking Research & Applications, pp. 12:1–12:9 (2019)
- (14) Bruder, V., Müller, C., Frey, S., Ertl, T.: On evaluating runtime performance of interactive visualizations. IEEE Transactions on Visualization and Computer Graphics (2019). DOI 10.1109/TVCG.2019.2898435
- (15) Bulling, A., Ward, J.A., Gellersen, H., Troster, G.: Eye movement analysis for activity recognition using electrooculography. IEEE Transactions on Pattern Analysis and Machine Intelligence 33(4), 741–753 (2011)
- (16) Burch, M., Andrienko, G.L., Andrienko, N.V., Höferlin, M., Raschke, M., Weiskopf, D.: Visual task solution strategies in tree diagrams. In: Proceedings of the IEEE Pacific Visualization Symposium, pp. 169–176 (2013)
- (17) Burch, M., Chuang, L., Fisher, B., Schmidt, A., Weiskopf, D. (eds.): Eye Tracking and Visualization: Foundations, Techniques, and Applications. Springer (2016)
- (18) Burch, M., Konevtsova, N., Heinrich, J., Höferlin, M., Weiskopf, D.: Evaluation of traditional, orthogonal, and radial tree diagrams by an eye tracking study. IEEE Transactions on Visualization and Computer Graphics 17(12), 2440–2448 (2011)
- (19) Bylinskii, Z., Borkin, M.A.: Eye fixation metrics for large scale analysis of information visualizations. In: M. Burch, L. Chuang, B. Fisher, A. Schmidt, D. Weiskopf (eds.) Eye Tracking and Visualization: Foundations, Techniques, and Applications, pp. 235–255. Springer (2016)
- (20) Carpendale, S.: Evaluating information visualizations. In: A. Kerren, J.T. Stasko, J.D. Fekete, C. North (eds.) Information Visualization: Human-Centered Issues and Perspectives, pp. 19–45. Springer (2008)
- (21) Chi, E.H.: A taxonomy of visualization techniques using the data state reference model. In: Proceedings of the IEEE Symposium on Information Visualization, pp. 69–75 (2000)
- (22) Chuang, L., Duchowski, A., Qvarfordt, P., Weiskopf, D.: Ubiquitous gaze sensing and interaction (Dagstuhl Seminar 18252). Dagstuhl Reports 8(6), 77–148 (2019)
- (23) Çöltekin, A., Heil, B., Garlandini, S., Fabrikant, S.I.: Evaluating the effectiveness of interactive map interface designs: a case study integrating usability metrics with eye-movement analysis. Cartography and Geographic Information Science 36(1), 5–17 (2009)
- (24) Corbin, J., Strauss, A.: Basics of Qualitative Research: Techniques and Procedures for Developing Grounded Theory, 4th edn. SAGE Publications (2015)
- (25) Crabtree, A., Chamberlain, A., Grinter, R.E., Jones, M., Rodden, T., Rogers, Y.: Introduction to the special issue of ‘the turn to the wild’. ACM Transactions on Computer-Human Interaction 20(3), 13:1–13:4 (2013)
- (26) Cui, X., Bray, S., Bryant, D.M., Glover, G.H., Reiss, A.L.: A quantitative comparison of NIRS and fMRI across multiple cognitive tasks. Neuroimage 54(4), 2808–2821 (2011)
- (27) Duchowski, A.: Eye Tracking Methodology: Theory and Practice, 2nd edn. Springer (2007)
- (28) Ellis, G., Dix, A.J.: An explorative analysis of user evaluation studies in information visualisation. In: Proceedings of the Workshop on Beyond Time And Errors: Novel Evaluation Methods for Visualization (BELIV), pp. 1–7 (2006)
- (29) Elmqvist, N., Yi, J.S.: Patterns for visualization evaluation. In: Proceedings of the Workshop on Beyond Time And Errors: Novel Evaluation Methods for Visualization (BELIV), pp. 12:1–12:8 (2012)
- (30) Ericsson, K.A., Simon, H.A.: Protocol Analysis: Verbal Reports as Data, revised edn. MIT Press (1993)
- (31) Fathi, A., Li, Y., Rehg, J.M.: Learning to recognize daily actions using gaze. In: Proceedings of the European Conference on Computer Vision, pp. 314–327. Springer (2012)
- (32) Fayyad, U., Piatetsky-Shapiro, G., Smyth, P.: The KDD process for extracting useful knowledge from volumes of data. Communications of the ACM 39(11), 27–34 (1996)
- (33) Freitas, C.M.D.S., Pimenta, M.S., Scapin, D.L.: User-centered evaluation of information visualization techniques: Making the HCI-InfoVis connection explicit. In: W. Huang (ed.) Handbook of Human Centric Visualization, pp. 315–336. Springer (2014)
- (34) Goldberg, J.H., Helfman, J.I.: Comparing information graphics: a critical look at eye tracking. In: Proceedings of the Workshop on Beyond Time And Errors: Novel Evaluation Methods for Visualization (BELIV), pp. 71–78 (2010)
- (35) Gürkök, H., Nijholt, A.: Brain–computer interfaces for multimodal interaction: a survey and principles. International Journal of Human-Computer Interaction 28(5), 292–307 (2012)
- (36) Haber, R.B., McNabb, D.A.: Visualization idioms: A conceptual model for visualization systems. In: G.M. Nielson, B.D. Shriver, L.J. Rosenblum (eds.) Visualization in Scientific Computing, pp. 74–93. IEEE Computer Society Press (1990)
- (37) Hirshfield, L.M., Gulotta, R., Hirshfield, S., Hincks, S., Russell, M., Ward, R., Williams, T., Jacob, R.: This is your brain on interfaces: enhancing usability testing with functional near-infrared spectroscopy. In: Proceedings of the SIGCHI Conference on Human Factors in Computing Systems, pp. 373–382 (2011)
- (38) Höferlin, B., Höferlin, M., Heidemann, G., Weiskopf, D.: Scalable video visual analytics. Information Visualization 14(1), 10–26 (2015)
- (39) Holmqvist, K., Nyström, M., Andersson, R., Dewhurst, R., Jarodzka, H., Van de Weijer, J.: Eye Tracking: A Comprehensive Guide to Methods and Measures. Oxford University Press (2011)
- (40) Hurter, C., Ersoy, O., Fabrikant, S., Klein, T., Telea, A.: Bundled visualization of dynamic graph and trail data. IEEE Transactions on Visualization and Computer Graphics 20(8), 1141–1157 (2013)
- (41) Hutchins, E.: Cognition in the Wild. MIT Press (1995)
- (42) Isenberg, T., Isenberg, P., Chen, J., Sedlmair, M., Möller, T.: A systematic review on the practice of evaluating visualization. IEEE Transactions on Visualization and Computer Graphics 19(12), 2818–2827 (2013)
- (43) Jacob, R.J., Karn, K.S.: Eye tracking in human-computer interaction and usability research: Ready to deliver the promises. In: J. Hyönä, R. Radach, H. Deubel (eds.) The Mind’s Eye: Cognitive and Applied Aspects of Eye Movement Research, pp. 573–605. Elsevier (2003)
- (44) Jianu, R., Alam, S.S.: A data model and task space for data of interest (DOI) eye-tracking analyses. IEEE Transactions on Visualization and Computer Graphics 24(3), 1232–1245 (2018)
- (45) Johnson, R.B., Onwuegbuzie, A.J., Turner, L.A.: Toward a definition of mixed methods research. Journal of Mixed Methods Research 1(2), 112–133 (2007)
- (46) Kim, S.H., Dong, Z., Xian, H., Upatising, B., Yi, J.S.: Does an eye tracker tell the truth about visualizations?: Findings while investigating visualizations for decision making. IEEE Transactions Visualization Computer Graphics 18(12), 2421–2430 (2012)
- (47) Koch, M., Kurzhals, K., Weiskopf, D.: Image-based scanpath comparison with slit-scan visualization. In: Proceedings of the ACM Symposium on Eye Tracking Research & Applications, pp. 55:1–55:5 (2018)
- (48) Kurzhals, K., Burch, M., Blascheck, T., Andrienko, G., Andrienko, N., Weiskopf, D.: A task-based view on the visual analysis of eye-tracking data. In: M. Burch, L. Chuang, B. Fisher, A. Schmidt, D. Weiskopf (eds.) Eye Tracking and Visualization: Foundations, Techniques, and Applications, pp. 3–22. Springer (2016)
- (49) Kurzhals, K., Fisher, B.D., Burch, M., Weiskopf, D.: Evaluating visual analytics with eye tracking. In: Proceedings of the Workshop on Beyond Time And Errors: Novel Evaluation Methods for Visualization (BELIV), pp. 61–69 (2014)
- (50) Kurzhals, K., Fisher, B.D., Burch, M., Weiskopf, D.: Eye tracking evaluation of visual analytics. Information Visualization 15(4), 340–358 (2016)
- (51) Kurzhals, K., Heimerl, F., Weiskopf, D.: ISeeCube: Visual analysis of gaze data for video. In: Proceedings of the ACM Symposium on Eye Tracking Research & Applications, pp. 43–50 (2014)
- (52) Kurzhals, K., Hlawatsch, M., Seeger, C., Weiskopf, D.: Visual analytics for mobile eye tracking. IEEE Transactions on Visualization and Computer Graphics 23(1), 301–310 (2017)
- (53) Kurzhals, K., Weiskopf, D.: Space-time visual analytics of eye-tracking data for dynamic stimuli. IEEE Transactions on Visualization and Computer Graphics 19(12), 2129–2138 (2013)
- (54) Lam, H., Bertini, E., Isenberg, P., Plaisant, C., Carpendale, S.: Empirical studies in information visualization: Seven scenarios. IEEE Transactions on Visualization and Computer Graphics 18(9), 1520–1536 (2012)
- (55) Lam, H., Munzner, T.: Increasing the utility of quantitative empirical studies for meta-analysis. In: Proceedings of the Workshop on Beyond Time And Errors: Novel Evaluation Methods for Visualization (BELIV) (2008). Article No. 2
- (56) Larsen, M., Harrison, C., Kress, J., Pugmire, D., Meredith, J.S., Childs, H.: Performance modeling of in situ rendering. In: Proceedings of the International Conference for High Performance Computing, Networking, Storage and Analysis, pp. 276–287 (2016)
- (57) Lave, J.: Cognition in Practice. Cambridge University Press (1988)
- (58) Lee, B., Henry Riche, N., Isenberg, P., Carpendale, S.: More than telling a story: Transforming data into visually shared stories. IEEE Computer Graphics and Applications 35(5), 84–90 (2015)
- (59) Ma, K., Liao, I., Frazier, J., Hauser, H., Kostis, H.: Scientific storytelling using visualization. IEEE Computer Graphics and Applications 32(1), 12–19 (2012)
- (60) Marriott, K., Schreiber, F., Dwyer, T., Klein, K., Riche, N.H., Itoh, T., Stuerzlinger, W., Thomas, B.H. (eds.): Immersive Analytics. Springer (2018)
- (61) Munz, T., Chuang, L., Pannasch, S., Weiskopf, D.: VisME: visual microsaccades explorer. Journal of Eye Movement Research 12(6) (2019). DOI 10.16910/jemr.12.6.5
- (62) Muthumanickam, P.K., Vrotsou, K., Nordman, A., Johansson, J., Cooper, M.D.: Identification of temporally varying areas of interest in long-duration eye-tracking data sets. IEEE Transactions on Visualization and Computer Graphics 25(1), 87–97 (2019)
- (63) Netzel, R., Ohlhausen, B., Kurzhals, K., Woods, R., Burch, M., Weiskopf, D.: User performance and reading strategies for metro maps: An eye tracking study. Spatial Cognition & Computation 17(1-2), 39–64 (2017)
- (64) Netzel, R., Vuong, J., Engelke, U., O’Donoghue, S.I., Weiskopf, D., Heinrich, J.: Comparative eye-tracking evaluation of scatterplots and parallel coordinates. Visual Informatics 1(2), 118–131 (2017)
- (65) North, C.: Toward measuring visualization insight. IEEE Computer Graphics and Applications 26(3), 6–9 (2006)
- (66) Peck, E.M., Solovey, E.T., Chauncey, K., Sassaroli, A., Fantini, S., Jacob, R.J.K., Girouard, A., Hirshfield, L.M.: Your brain, your computer, and you. Computer 43(12), 86–89 (2010)
- (67) Pirolli, P., Card, S.: The sensemaking process and leverage points for analyst technology as identified through cognitive task analysis. In: Proceedings of the International Conference on Intelligence Analysis, vol. 5, pp. 2–4 (2005)
- (68) Plaisant, C.: The challenge of information visualization evaluation. In: Proceedings of the Working Conference on Advanced Visual Interfaces, pp. 109–116 (2004)
- (69) Prendinger, H., Mori, J., Ishizuka, M.: Using human physiology to evaluate subtle expressivity of a virtual quizmaster in a mathematical game. International Journal of Human-Computer Studies 62(2), 231–245 (2005)
- (70) Rizzi, S., Hereld, M., Insley, J., Papka, M.E., Uram, T., Vishwanath, V.: Performance modeling of vl3 volume rendering on GPU-based clusters. In: Proceedings of the Eurographics Symposium on Parallel Graphics and Visualization, pp. 65–72 (2014)
- (71) Roberts, J.C.: State of the art: Coordinated multiple views in exploratory visualization. In: Proceedings of the International Conference on Coordinated and Multiple Views in Exploratory Visualization, pp. 61–71 (2007)
- (72) Saldana, J.: The Coding Manual for Qualitative Researchers, 3rd edn. SAGE Publications (2015)
- (73) Schulz, C., Nocaj, A., El-Assady, M., Frey, S., Hlawatsch, M., Hund, M., Karch, G.K., Netzel, R., Schätzle, C., Butt, M., Keim, D.A., Ertl, T., Brandes, U., Weiskopf, D.: Generative data models for validation and evaluation of visualization techniques. In: Proceedings of the Workshop on Beyond Time And Errors: Novel Evaluation Methods for Visualization (BELIV), pp. 112–124 (2016)
- (74) Shao, L., Silva, N., Eggeling, E., Schreck, T.: Visual exploration of large scatter plot matrices by pattern recommendation based on eye tracking. In: Proceedings of the ACM Workshop on Exploratory Search and Interactive Data Analytics, pp. 9–16 (2017)
- (75) Silva, N., Blascheck, T., Jianu, R., Rodrigues, N., Weiskopf, D., Raubal, M., Schreck, T.: Eye tracking support for visual analytics systems: foundations, current applications, and research challenges. In: Proceedings of the ACM Symposium on Eye Tracking Research & Applications, pp. 11:1–11:10 (2019)
- (76) Silva, N., Schreck, T., Veas, E., Sabol, V., Eggeling, E., Fellner, D.W.: Leveraging eye-gaze and time-series features to predict user interests and build a recommendation model for visual analysis. In: Proceedings of the ACM Symposium on Eye Tracking Research & Applications (2018). Article No. 13
- (77) Steichen, B., Carenini, G., Conati, C.: User-adaptive information visualization: using eye gaze data to infer visualization tasks and user cognitive abilities. In: Proceedings of the ACM International Conference on Intelligent User Interfaces, pp. 317–328 (2013)
- (78) Strait, M., Canning, C., Scheutz, M.: Reliability of NIRS-based BCIs: A placebo-controlled replication and reanalysis of Brainput. In: CHI ’14 Extended Abstracts on Human Factors in Computing Systems, pp. 619–630 (2014)
- (79) Suchman, L.A.: Plans and Situated Actions: The Problem of Human-Machine Communication. Cambridge University Press (1987)
- (80) Tory, M.: User studies in visualization: A reflection on methods. In: W. Huang (ed.) Handbook of Human Centric Visualization, pp. 411–426. Springer (2014)
- (81) Vuillemot, R., Boy, J., Tabard, A., Perin, C., Fekete, J.D. (eds.): Proceedings of LIVVIL: Logging Interactive Visualizations and Visualizing Interaction Logs (2016). Workshop at IEEE VIS 2016, https://hal.inria.fr/hal-01535913/file/proceedings.pdf
- (82) Wagner, J., Kim, J., André, E.: From physiological signals to emotions: Implementing and comparing selected methods for feature extraction and classification. In: Proceedings of the IEEE International Conference on Multimedia and Expo, pp. 940–943 (2005)
- (83) van Wijk, J.J.: Evaluation: A challenge for visual analytics. IEEE Computer 46(7), 56–60 (2013)