High-Resolution Near Infrared Spectroscopy of HD 100546: IV. Orbiting Companion Disappears on Schedule
Abstract
HD 100546 is a Herbig Ae/Be star surrounded by a disk with a large central region that is cleared of gas and dust (i.e., an inner hole). High-resolution near-infrared spectroscopy reveals a rich emission spectrum of fundamental ro-vibrational CO emission lines whose time variable properties point to the presence of an orbiting companion within the hole. The Doppler shift and spectroastrometric signal of the CO v=1-0 P26 line, observed from 2003 to 2013, are consistent with a source of excess CO emission that orbits the star near the inner rim of the disk. The properties of the excess emission are consistent with those of a circumplanetary disk. In this paper, we report follow up observations that confirm our earlier prediction that the orbiting source of excess emission would disappear behind the near side of the inner rim of the outer disk in 2017. We find that while the hotband CO lines remained unchanged in 2017, the v=1-0 P26 line and its spectroastrometric signal returned to the profile observed in 2003. With these new observations, we further constrain the origin of the emission and discuss possible ways of confirming the presence of an orbiting planetary companion in the inner disk.
1 Introduction
The identification of forming planets will allow us to connect the initial conditions in disks to the kinds of planets that form, connect the initial architecture of planetary systems to the final distribution of planets observed around main sequence stars, and validate indirect signposts of gas giant formation. High-resolution near-infrared spectroscopy of the circumplanetary material surrounding forming gas giant planets will help to elucidate the physics of planet formation. For example, determining how material accretes from the circumstellar disk to the circumplanetary disk and finally on the planet will shed light on what sets the mass of gas giant planets. Measuring the size and temperature of circumplanetary disks will provide observational constraints on the initial conditions for the formation of satellites (e.g., the Gallilean moons; Canup & Ward 2002; Ward & Canup 2010).
While even the highest spatial resolution instruments planned for next generation facilities (e.g., the 30-meter class telescopes) will only at best be able to marginally resolve such structures, high-resolution spectroscopy of warm gas using instruments on current 10-meter class telescopes can serve as a surrogate for high-spatial resolution. Spectroastrometric observations reported over the past decade, which provide complementary sub-milliarcsecond-scale spatial information on the dynamics of disk gas, demonstrate the promise of this approach (Pontoppidan et al., 2008, 2011; Brittain et al., 2009, 2013, 2014, 2015).
Theory predicts that an orbiting giant planet will dynamically clear a gap in the vicinity of its orbit, or possibly deplete the entire inner disk creating a large inner hole. The large optically thin region that results will produce a spectral energy distribution (SED) with a large deficit at mid-infrared wavelengths, a transition disk SED. Gas accreting through the disk onto the forming gas giant planet is expected to form a circumplanetary disk that fills roughly 1/3 of the Hill radius (e.g., Quillen & Trilling 1998 ). Recent modeling indicates that circumplanetary structures are vertically extended and intrinsically 3D, although they retain the rotationally supported disk found in 2D simulations (e.g., Ayliffe & Bate 2009; Machida et al. 2010; Tanigawa et al. 2012; Gressel et al. 2013; Szulágyi et al. 2014).
Although observational evidence of circumplanetary structures remains scant, several recent studies have reported evidence for planetary companions in the cleared inner regions of transition disks. The young stars LkCa 15, PDS 70, and HD 142527 harbor companions (perhaps a stellar companion in the case of HD 142527) that appear to be accreting as evidenced by the H emission detected from these sources (Sallum et al., 2015; Wagner et al., 2018; Close et al., 2014, respectively). Although attempts to detect a circumplanetary disk with ALMA have yielded little success thus far (e.g., Keppler et al. 2019; Pineda et al. 2019; but see Pérez et al. 2019, high-contrast near-infrared (NIR) imagery of LkCa 15 (Kraus & Ireland, 2012; Sallum et al., 2015), and PDS 70 (Keppler et al., 2018; Christiaens et al., 2019) reveal compact NIR emission that could be produced by forming gas giant planets and/or their circumplanetary disk. Complementary information about any circumplanetary emission can be acquired with high-resolution NIR spectroscopy.
We have previously identified in the Herbig Ae/Be system HD 100546 a possible signpost of giant planet formation: an orbiting source of CO fundamental emission that may arise in a circumplanetary disk (Brittain et al., 2014). Herbig Ae/Be stars are pre- and zero-age main sequence stars with accretion disks (e.g., Waters & Waelkens, 1998). The disk orbiting HD 100546 is devoid of dust interior to au (Jamialahmadi et al., 2018). This region is also devoid of molecular gas and PAHs (Habart et al., 2006; Brittain et al., 2009; van der Plas et al., 2009; Carmona et al., 2011; Liskowsky et al., 2012)
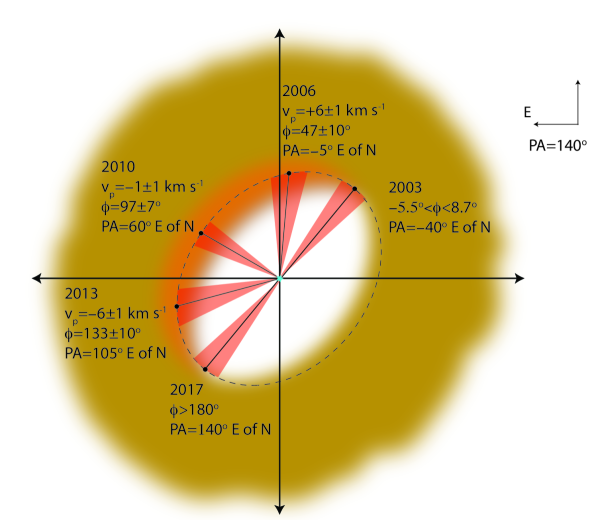
Using Phoenix on Gemini South and CRIRES on the Very Large Telescope, we inferred the presence of a potential companion within the inner hole, based on an excess component of the high-J v=1-0 ro-vibrational CO emission that varies relative to the stable hotband emission (Brittain et al., 2014). The variation of the Doppler shift and the spectroastrometric signal of the excess component over a 10 year period can be explained by a compact source of emission in a Keplerian orbit near the edge of the disk gap (Fig. 1). The discovery of a companion at the location inferred for the orbiting component has been reported based on high contrast near-infrared imaging (Currie et al., 2015).
The CO flux of the excess component is consistent with emission from a circumplanetary disk with a radius of 0.3 AU if we assume the emitting gas is optically thick and at the same temperature as the circumstellar gas near the disk edge (1400 K; Brittain et al. 2013). These values are consistent with the theoretically predicted thermal properties of circumplanetary disks of giant planets. Szulágyi et al. (2014) reported a disk temperature of 2000K out to a Hill radius R0.8 au for the case, in their theoretical study, of a 10 MJ planet at 5 au (see also Szulágyi 2017; Szulágyi & Mordasini 2017). Similar temperatures have been reported for the inner circumplanetary disk in other three-dimensional radiation hydrodynamical simulations (Klahr & Kley, 2006; Gressel et al., 2013).
From our earlier observations, we constrained the orbital radius of the excess CO emission source to R=12.9 au. We were also able to constrain the 2003 orbital phase relative to the northwest extent of the semi-major axis to =6 (Brittain et al., 2014). Based on this orbit, we predicted that the compact emission source would disappear behind the near side of the inner disk wall sometime between February 2017 and February 2019. Here we report follow-up spectroscopy of HD 100546 acquired in July 2017 and December 2017. We show that the excess emission component is no longer evident, with the profile of the v=1-0 lines having returned to the line shape originally observed in 2003.
2 Observations
We acquired high-resolution (R=50,000), near-infrared spectra of HD 100546 on July 9, 2017 and December 3-4, 2017 using PHOENIX at the Gemini South telescope (Hinkle et al., 2003, 2000, 1998). In addition the hot star HIP 60718 was observed for telluric correction. The 4 pixel slit (0.34) was used for all observations providing 1.5 km s-1 per pixel sampling of the spectrum. The seeing in the -band during these epochs ranged from 0.9–1.0 and the airmass of the observations ranged from 1.5-1.6. In July, half of the spectra were taken with the slit in its default position angle of 90 east of north, and the other half were taken with the slit rotated 180. In the December, all of the spectra were acquired with the slit in its default position. A summary of observations is presented in Table 1.
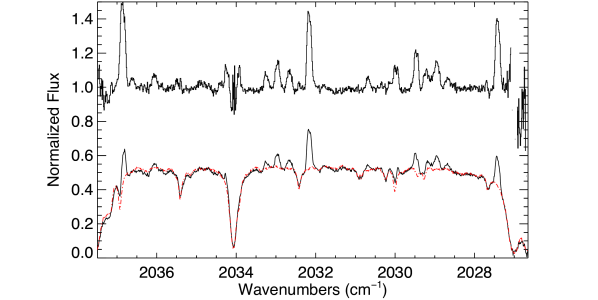
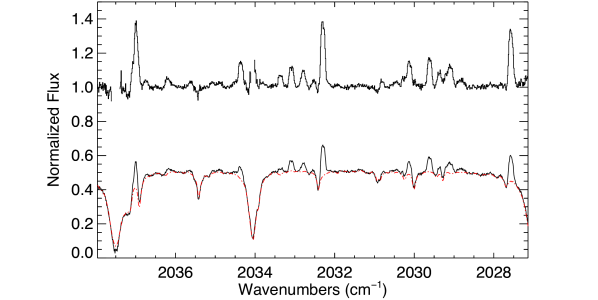
Observations were centered near 2034 cm-1, which covers the v=1-0 P26 line (hereafter we will refer to this transition as P26) and numerous hot band lines. These same transitions were also observed in 2003, 2006, 2010, and 2013. These spectra were previously presented in Brittain et al. (2014).
Observations in the band are dominated by a strong thermal background. Therefore, an ABBA nod pattern between two positions separated by is used to cancel the thermal continuum to first order. The scans are flat fielded, cleaned of hot and dead pixels, including cosmic ray hits, and then combined in the sequence (A1-B1-B2+A2)/2. Because the spectra are curved along the detector, they are first rectified by finding the centroid of the point spread function (PSF) in each column. A third degree polynomial was fit to the centroids and used to determine the shift of each column to a common row.
In principle, the spectra can also be tilted along the slit. To check this, we compared the sky emission spectrum at the bottom of the slit to the spectrum at the top of the slit. The offset was less than half of a pixel along the length of the slit. A sky emission spectrum generated by the Spectral Synthesis Program (Kunde & Maguire, 1974), which accesses the 2000HITRAN molecular database (Rothman et al., 2003) was used to measure the shift of each row. A first degree polynomial was fit to the central wavenumber of each row to measure the shift. Each row was then rectified in the spectral direction.
To capture all of the CO emission, a 2 window was extracted to generate the one-dimensional spectrum. The wavelength calibration was achieved by fitting an atmospheric transmittance model generated by the Spectral Synthesis Program. Each spectrum is then ratioed to a standard star observed at a similar airmass to remove telluric absorption lines. Areas where the transmittance is below 50% are omitted (Figs. 2a & 2b).
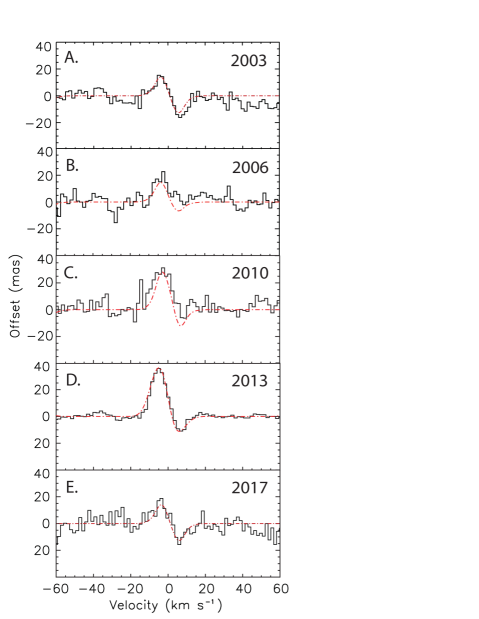
The spectra acquired in July were observed with two PAs in order to make a spectroastrometric measurement of the emission lines (see for example, Brittain et al., 2015, 2018). To measure the spectroastrometric signal of the emission lines, the centroids of the A and B rows of the rectified array are measured for each column and then averaged. The centroid measurements of the parallel and anti-parallel position angles are then subtracted and divided by two in order to remove systematic features. The spectroastrometric measurement is presented in figure 3.
3 Results
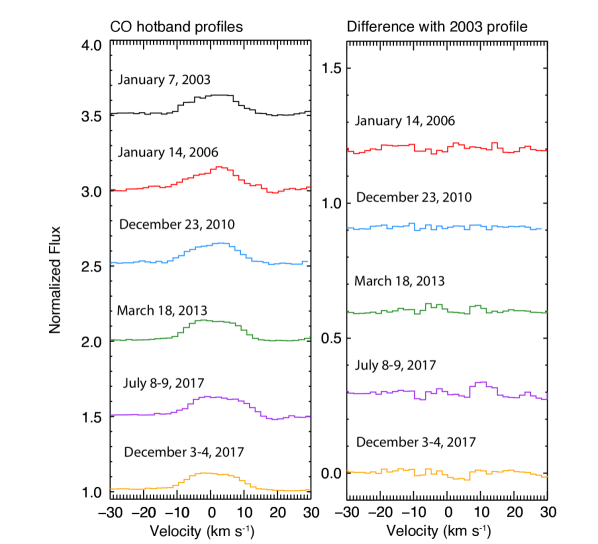
To check for variability of the CO emission (due to artifacts and/or intrinsic variation), we averaged together six hotband CO lines that were not blended or significantly impacted by telluric absorption (Table 2). As in previous analyses, the spectra were rescaled so that the equivalent widths of the hotband lines were the same from epoch to epoch (Brittain et al., 2013, 2014). We then differenced the averaged profile from each epoch with the averaged profile from 2003 (Fig. 4). No significant variability in the shape of the lines is detected relative to 2003 in any of the epochs.
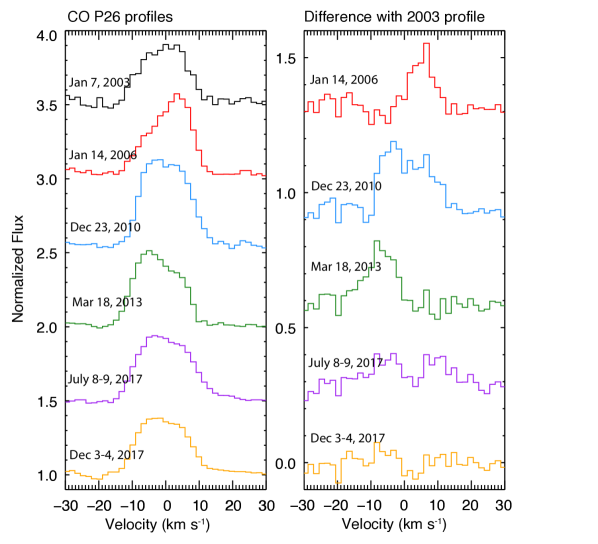
A similar analysis was performed for the v=1-0 P26 CO line. The equivalent widths of the P26 line from each epoch were scaled with the value used to scale the hotband lines from their respective epoch. As noted in previous papers (Brittain et al., 2009, 2014, 2015), the P26 line was substantially different both in flux and shape in 2006, 2010, and 2013 relative to 2003. We have two epochs in 2017. In neither epoch is the residual of the difference between the 2003 and 2017 epochs above the 1 level (Fig. 5). While the signal-to-noise of the spectroastrometric measurement is low due to the poor seeing at the time of the observation, the signal of the P26 lines is observed and consistent with gas orbiting in an axisymmetric disk (Fig. 3).
Over time, the v=1-0 P26 line has varied relative to the hotband lines. Because these lines are observed simultaneously in the same spectrum, we are confident that the variability of the v=1-0 line is intrinsic to the source of emission rather than an artifact such as misalignment of the slit with the PSF of the source (e.g., Hein Bertelsen et al. 2014).
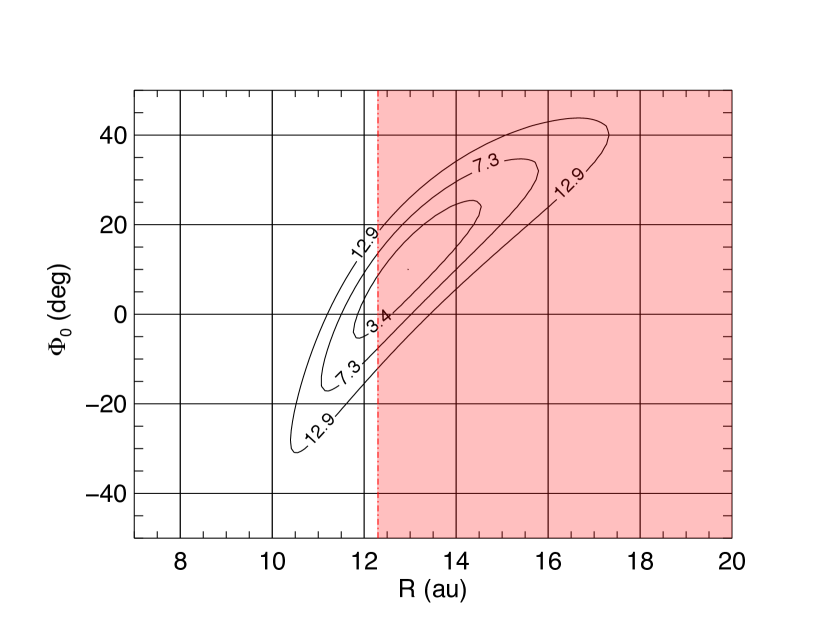
It is now evident that the excess CO emission was visible for fewer than 14.5 yrs, so the upper limit on the period of the orbit is 29yrs. This allows us to refine the orbital parameters of the source of emission. Assuming a stellar mass of 2.2M☉ (Pineda et al., 2019) the object must be orbiting within 12.3 au (Fig. 6). Adopting the disk inclination measured with mid-infrared interferometry (47°; Jamialahmadi et al. 2018), we also constrain the orbital phase to – +8.7 and the inner extent of the CO emission to 11.6 au. Thus the orbital radius of this source of emission is constrained to 11.6 au – 12.3 au. Recent ALMA measurements provide a slightly different measurement of the stellar mass (2.050.01 M☉) and disk inclination (40.1; Casassus & Perez 2019). These values shift the center of the contours to 11.5au and -2 so that the constraint on the orbital phase is – +15 and the orbital radius is constrained to 10.5 au – 12.3 au. This is interior to the inner edge of the outer disk inferred from mid-infrared interferometry (15.7 au Jamialahmadi et al., 2018) and NIR high contrast imagery (Follette et al., 2017). The separation we infer is independent of the distance to the source as it is inferred from the velocity and period of the orbit, so it should not be rescaled with the updated distance to HD 100546 available from GAIA (cf., Follette et al., 2017; Jamialahmadi et al., 2018).
4 Discussion
A decade and a half of high resolution CO spectroscopy of HD 100546 provides strong evidence for an orbiting source of CO emission that has the temperature and emitting area expected for a circumplanetary disk. Some recent publications (Follette et al. 2017; Pineda et al. 2019) have been dismissive of the CO spectroastrometric results, by making incorrect reference to Fedele et al. (2015), whose criticism was directed at the line profile of the ro-vibrational OH lines (see the appendix for further details). While it is true that an offset of the slit from the stellar position can produce an asymmetric spectroastrometric signal and line profile (see Brittain et al. 2015), this cannot explain the CO results for HD 100546. The simple reason is that the v=1-0 and hot-band lines were observed simultaneously, yet they show different spectroastrometric signals and profiles in data from 2006 to 2013.
Even if that were not the case, slit offsets cannot produce the large asymmetries observed, because the slit width in our observations was wider than the size of the inner rim in HD 100546. Modeling of the effects of slit misalignment on observations of axisymmetric disk emission (Brittain et al., 2015) shows that, in this situation, offsets even as large as the full slit width are unable to produce the large asymmetries observed in the CO v=1-0 spectroastrometric signal.
Orbiting sources of emission have also been detected in the inner region of other transition disks, albeit for smaller fractions of their orbits than in the case of HD 100546. As one exciting example, the three emission sources in the LkCa 15 system show consistent orbital motion at au from the star in data taken over more than 6 years (Sallum et al. 2016, 2019 in preparation).
Whether the orbiting source of excess CO emission in the HD 100546 system actually arises in a circumplanetary disk (or, alternatively, in an orbiting hot spot on the disk wall, or another component) is as yet unclear. Efforts to detect an associated source of continuum emission at 12 au have been inconclusive. The separation at maximum elongation is 100 mas which is very close to the inner working angle of high contrast imagers on 8 m class telescopes (e.g., Follette et al., 2017). Currie et al. (2015) reported the presence of a NIR point source interior to the inner rim in their image of the disk (HD 100546c) at a PA consistent with the inferred orbit of the CO excess emission source. Subsequent GPI imagery of the disk did not confirm this result (Follette et al., 2017); however, it is likely that the emission source fell behind the coronographic mask in this epoch (Currie et al., 2017). High contrast imagers that can more easily probe smaller orbital distances (e.g., instruments such as SCExAO on the Subaru Telescope and its successors) can potentially image the source of emission when it emerges from behind the inner rim of the disk in 2031.
If the source of CO excess emission is a circumplanetary disk, it may be detectable in the near-infrared or millimeter dust continuum, depending on its dust-to-gas ratio and other factors. A recent study of the observability of circumplanetary disks with ALMA found that a circumplanetary disk around a 3 MJ planet at 5 au would produce a flux of 1 mJy/beam and be detectable at 440 m in 5 hr of integration for a system 100 pc away (Szulágyi et al., 2018). In comparison, the ALMA upper limits reported by Pineda et al. (2019) at 870 m at the position of HD 100546c are 5 times smaller (198 Jy). The theoretical flux estimate assumes a dust-to-gas ratio of 0.01, although as the authors note, the dust-to-gas ratio could be much smaller: the circumplanetary disk is fed by vertical meridional flow from the outer disk, and only the small grains that are well coupled to the gas are entrained in the flow, with larger solids filtered out by the pressure bump of the outer disk. Perhaps the resulting low dust-to-gas ratio of the CPD reduces the submillimeter flux to a level consistent with the ALMA upper limit.
There are additional lines of evidence suggesting that the dust-to-gas ratio of the accreting material in HD 100546 is substantially lower than 0.01. Firstly, the stellar photospheric abundance of refractory material in HD 100546 is depleted relative to volatile elements, a result that led (Kama et al., 2015) to conclude that the dust-to-gas ratio of the accreting material is 0.001. Secondly, Dong et al. (2018) point out that the disk mass of HD 100546 (and other Herbig Ae/Be stars) inferred from its submillimeter continuum emission (i.e., the dust) and the assumption that the dust-to-gas ratio is 0.01 implies that the accretion onto the star can only be maintained for 105 yrs - a small fraction of the system age. Thus they conclude that the dust-to-gas ratio of disks around Herbig Ae/Be stars is substantially lower than 0.01 potentially making it difficult to detect the circumplanetary disk in the submillimeter.
Despite these considerations, Pérez et al. (2019) have reported the possible detection with ALMA of a circumplanetary disk in dust continuum emission and gas kinematics. The continuum emission source, located 51 mas from the star (or 5.6 au adopting a distance of 110.00.6 pc from Gaia Collaboration et al. 2018) and at a PA of 37 in September 2017, is closer to the star and at a different PA than the orbiting source of excess CO emission studied here.
How can we confirm the presence of an orbiting giant planetary companion to HD 100546 without waiting for it to emerge from behind the disk in 2031? Perhaps the most promising approach is through the reflex motion the companion induces in the central star. If a 5 MJ companion orbits 12 au from the star, the semi-major axis of the star’s orbit is 0.24 mas. Recent studies that have combined the Hipparcos and Gaia DR2 astrometric data on Pic have achieved a proper motion precision of 0.02–0.03 mas yr-1 (Snellen & Brown, 2018; Dupuy et al., 2019).
While this level of precision would be sufficient to measure the astrometric wobble of HD 100546, the year time interval between the Hipparcos and Gaia mean epochs is close to the inferred 27-29 year orbital period of the companion, making it difficult to detect a wobble with the current Gaia DR2 data. To detect orbital acceleration we would need to measure a difference in the instantaneous proper motion of the star at two epochs. For HD 100456, the difference between Gaia and the 24.5 year baseline is consistent with zero, (0.090.16, 0.020.14) mas/yr, as expected for the inferred orbit, although with large errors. A better estimate will be available from the 5-year Gaia data and can be used to test for the presence of a supra-Jovian mass companion (T. Dupuy, private communication).
To summarize, we have presented ro-vibrational CO emission that is likely from the circumplanetary material orbiting a supra-Jovian mass companion in HD 100546. If confirmed, this will be the first direct detection of emitting gas from circumplanetary material. With more sensitive and higher resolution near and mid-infrared spectrographs on 30m class telescopes, we will be able to study the dynamics of the circumplanetary gas in more detail and measure the size of disk, determine whether the gas is in a Keplerian orbit, and thus better characterize the circumstellar disk - planet connection and the birthplace of Jovian moons.
References
- Ayliffe & Bate (2009) Ayliffe, B. A., & Bate, M. R. 2009, MNRAS, 397, 657
- Brittain et al. (2018) Brittain, S. D., Carr, J. S., & Najita, J. R. 2018, PASP, 130, 074505
- Brittain et al. (2014) Brittain, S. D., Carr, J. S., Najita, J. R., Quanz, S. P., & Meyer, M. R. 2014, ApJ, 791, 136
- Brittain et al. (2009) Brittain, S. D., Najita, J. R., & Carr, J. S. 2009, ApJ, 702, 85
- Brittain et al. (2015) —. 2015, Ap&SS, 357, 54
- Brittain et al. (2013) Brittain, S. D., Najita, J. R., Carr, J. S., et al. 2013, ApJ, 767, 159
- Brittain et al. (2007) Brittain, S. D., Simon, T., Najita, J. R., & Rettig, T. W. 2007, ApJ, 659, 685
- Canup & Ward (2002) Canup, R. M., & Ward, W. R. 2002, AJ, 124, 3404
- Carmona et al. (2011) Carmona, A., van der Plas, G., van den Ancker, M. E., et al. 2011, A&A, 533, A39
- Casassus & Perez (2019) Casassus, S., & Perez, S. 2019, arXiv e-prints, arXiv:1906.06302
- Christiaens et al. (2019) Christiaens, V., Cantalloube, F., Casassus, S., et al. 2019, ApJ, 877, L33
- Close et al. (2014) Close, L. M., Follette, K. B., Males, J. R., et al. 2014, ApJ, 781, L30
- Currie et al. (2017) Currie, T., Brittain, S., Grady, C. A., Kenyon, S. J., & Muto, T. 2017, Research Notes of the American Astronomical Society, 1, 40
- Currie et al. (2015) Currie, T., Cloutier, R., Brittain, S., et al. 2015, ApJ, 814, L27
- Dong et al. (2018) Dong, R., Najita, J. R., & Brittain, S. 2018, ApJ, 862, 103
- Dupuy et al. (2019) Dupuy, T. J., Brandt, T. D., Kratter, K. M., & Bowler, B. P. 2019, ApJ, 871, L4
- Fedele et al. (2015) Fedele, D., Bruderer, S., van den Ancker, M. E., & Pascucci, I. 2015, ApJ, 800, 23
- Follette et al. (2017) Follette, K. B., Rameau, J., Dong, R., et al. 2017, AJ, 153, 264
- Gaia Collaboration et al. (2018) Gaia Collaboration, Brown, A. G. A., Vallenari, A., et al. 2018, A&A, 616, A1
- Gressel et al. (2013) Gressel, O., Nelson, R. P., Turner, N. J., & Ziegler, U. 2013, ApJ, 779, 59
- Habart et al. (2006) Habart, E., Natta, A., Testi, L., & Carbillet, M. 2006, A&A, 449, 1067
- Hein Bertelsen et al. (2014) Hein Bertelsen, R. P., Kamp, I., Goto, M., et al. 2014, A&A, 561, A102
- Hinkle et al. (1998) Hinkle, K. H., Cuberly, R. W., Gaughan, N. A., et al. 1998, in Proc. SPIE, Vol. 3354, Infrared Astronomical Instrumentation, ed. A. M. Fowler, 810–821
- Hinkle et al. (2000) Hinkle, K. H., Joyce, R. R., Sharp, N., & Valenti, J. A. 2000, in Proc. SPIE, Vol. 4008, Optical and IR Telescope Instrumentation and Detectors, ed. M. Iye & A. F. Moorwood, 720–728
- Hinkle et al. (2003) Hinkle, K. H., Blum, R. D., Joyce, R. R., et al. 2003, in Proc. SPIE, Vol. 4834, Discoveries and Research Prospects from 6- to 10-Meter-Class Telescopes II, ed. P. Guhathakurta, 353–363
- Jamialahmadi et al. (2018) Jamialahmadi, N., Ratzka, T., Panić, O., et al. 2018, ApJ, 865, 137
- Kama et al. (2015) Kama, M., Folsom, C. P., & Pinilla, P. 2015, A&A, 582, L10
- Keppler et al. (2018) Keppler, M., Benisty, M., Müller, A., et al. 2018, A&A, 617, A44
- Keppler et al. (2019) Keppler, M., Teague, R., Bae, J., et al. 2019, arXiv e-prints, arXiv:1902.07639
- Klahr & Kley (2006) Klahr, H., & Kley, W. 2006, A&A, 445, 747
- Kley & Dirksen (2006) Kley, W., & Dirksen, G. 2006, A&A, 447, 369
- Kraus & Ireland (2012) Kraus, A. L., & Ireland, M. J. 2012, ApJ, 745, 5
- Kunde & Maguire (1974) Kunde, V. R., & Maguire, W. C. 1974, J. Quant. Spec. Radiat. Transf., 14, 803
- Lewis et al. (2010) Lewis, J., Kronberg, M., & Brittain, S. 2010, Journal of the Southeastern Association for Research in Astronomy, 4, 20
- Liskowsky et al. (2012) Liskowsky, J. P., Brittain, S. D., Najita, J. R., et al. 2012, ApJ, 760, 153
- Machida et al. (2010) Machida, M. N., Kokubo, E., Inutsuka, S.-I., & Matsumoto, T. 2010, MNRAS, 405, 1227
- Panić et al. (2014) Panić, O., Ratzka, T., Mulders, G. D., et al. 2014, A&A, 562, A101
- Pérez et al. (2019) Pérez, S., Casassus, S., Hales, A., et al. 2019, arXiv e-prints, arXiv:1906.06305
- Pineda et al. (2019) Pineda, J. E., Szulágyi, J., Quanz, S. P., et al. 2019, ApJ, 871, 48
- Pontoppidan et al. (2011) Pontoppidan, K. M., Blake, G. A., & Smette, A. 2011, ApJ, 733, 84
- Pontoppidan et al. (2008) Pontoppidan, K. M., Blake, G. A., van Dishoeck, E. F., et al. 2008, ApJ, 684, 1323
- Quillen & Trilling (1998) Quillen, A. C., & Trilling, D. E. 1998, ApJ, 508, 707
- Rothman et al. (2003) Rothman, L. S., Barbe, A., Benner, D. C., et al. 2003, J. Quant. Spec. Radiat. Transf., 82, 5
- Sallum et al. (2015) Sallum, S., Follette, K. B., Eisner, J. A., et al. 2015, Nature, 527, 342
- Snellen & Brown (2018) Snellen, I. A. G., & Brown, A. G. A. 2018, Nature Astronomy, 2, 883
- Szulágyi (2017) Szulágyi, J. 2017, ApJ, 842, 103
- Szulágyi et al. (2014) Szulágyi, J., Morbidelli, A., Crida, A., & Masset, F. 2014, ApJ, 782, 65
- Szulágyi & Mordasini (2017) Szulágyi, J., & Mordasini, C. 2017, MNRAS, 465, L64
- Szulágyi et al. (2018) Szulágyi, J., Plas, G. v. d., Meyer, M. R., et al. 2018, MNRAS, 473, 3573
- Tanigawa et al. (2012) Tanigawa, T., Ohtsuki, K., & Machida, M. N. 2012, ApJ, 747, 47
- Tatulli et al. (2011) Tatulli, E., Benisty, M., Ménard, F., et al. 2011, A&A, 531, A1
- van der Plas et al. (2009) van der Plas, G., van den Ancker, M. E., Acke, B., et al. 2009, A&A, 500, 1137
- Wagner et al. (2018) Wagner, K., Follete, K. B., Close, L. M., et al. 2018, ApJ, 863, L8
- Ward & Canup (2010) Ward, W. R., & Canup, R. M. 2010, AJ, 140, 1168
- Waters & Waelkens (1998) Waters, L. B. F. M., & Waelkens, C. 1998, ARA&A, 36, 233
| Date | Star | Int Time | Seeing | SNR |
|---|---|---|---|---|
| July 09, 2017 | Cru | 8m | ||
| HD 100546 | 88m | 0.9 | 120 | |
| December 03, 2017 | HIP 60718 | 12m | ||
| HD 100546 | 40m | 1.0 | ||
| December 04, 2017 | HIP 60718 | 12m | ||
| HD 100546 | 64m | 0.8 | 130aaThe signal-to-noise ratio of the combined data from December 3 and December 4. |
| Isotopologue | v′′ | J′′ | v′ | J′ | E′′ | A | |
|---|---|---|---|---|---|---|---|
| cm-1 | cm-1 | s-1 | |||||
| 12CO | 1 | 21 | 2 | 20 | 4103.67 | 2029.66 | 30.28 |
| 12CO | 2 | 15 | 3 | 14 | 5794.30 | 2030.16 | 45.75 |
| 12CO | 1 | 10 | 2 | 9 | 3353.92 | 2032.87 | 30.55 |
| 12CO | 3 | 8 | 4 | 7 | 7566.63 | 2033.14 | 62.96 |
| 13CO | 0 | 16 | 1 | 15 | 1557.06 | 2033.42 | 15.03 |
| 12CO | 2 | 14 | 3 | 13 | 5737.76 | 2034.41 | 46.15 |
Note. — The hotband lines and the 13CO lines are excited by UV fluorescence (Brittain et al., 2009).