Novel method for the precise determination of the QCD running coupling from event shape distributions in electron-positron annihilation
Abstract
We present a novel method for precisely determining the running QCD coupling constant over a wide range of from event shapes for electron-positron annihilation measured at a single annihilation energy . The renormalization scale of the running coupling depends dynamically on the virtuality of the underlying quark and gluon subprocess and thus the specific kinematics of each event. The determination of the renormalization scale for event shape distributions is obtained by using the Principle of Maximum Conformality (PMC), a rigorous scale-setting method for gauge theories which satisfies all the requirements of Renormalization Group Invariance, including renormalization-scheme independence and consistency with Abelian theory in the limit. In this paper we apply the PMC to two classic event shapes measured in annihilation: the thrust () and C-parameter (). The PMC renormalization scale depends differentially on the values of and . The application of PMC scale-setting determines the running coupling to high precision over a wide range of from to from measurements of the event shape distributions at the peak. The extrapolation of the running coupling using pQCD evolution gives the value from the thrust, and from the C-parameter in the scheme. These determinations of are consistent with the world average and are more precise than the values obtained from analyses of event shapes currently used in the world average. The highly-consistent results for the and event-shape distributions provide an additional verification of the applicability of the PMC to pQCD.
I Introduction
The strong coupling constant, , is the fundamental coupling underlying Quantum Chromodynamics (QCD) and its predictions for hadron and nuclear physics. It is thus crucial to determine to the best possible precision. The dependence of on the renormalization scale obtained from many different physical processes show consistency with QCD predictions and asymptotic freedom. The Particle Data Group (PDG) currently gives the world average: Tanabashi:2018oca in the renormalization scheme.
An important test of the consistency of the QCD predictions can be obtained from the analysis of event shapes in electron-positron annihilation. A precise determination of can be obtained from a detailed comparison of the theoretical predictions with the experimental data, especially by using the large data sample available at the peak. In fact, the main obstacle for achieving a highly precise determination of the QCD coupling from event shapes is not the lack of precise experimental data, but the ambiguity of theoretical predictions.
Currently, theoretical calculations for event shapes are based on “conventional” scale setting; i.e., one simply sets the value of the renormalization scale equal to the center-of-mass energy ; the theory uncertainties for this guess are estimated by varying the renormalization scale over an arbitrary range; e.g., . By using conventional scale setting, only one value of at the scale can be extracted, and the main source of the uncertainty is the choice of the renormalization scale. For example, the value of Dissertori:2009ik , with a perturbative uncertainty of , is obtained by using next-to-next-to-leading order (NNLO)+next-to-leading-logarithmic approximation (NLLA) predictions. Recent determinations of based on the soft-collinear effective theory are Abbate:2010xh from the thrust, and Hoang:2015hka from the C-parameter. Theorists have introduced corrections, such as non-perturbative hadronization effects, in order to match the theoretical predictions to the experimental data. However, as pointed out in Ref.Tanabashi:2018oca , the systematics of the theoretical uncertainties for extracting using Monte Carlo generators to simulate the non-perturbative hadronization effects are not well understood.
Conventional scale setting introduces an inherent scheme-and-scale dependence for pQCD predictions, and it violates a fundamental principle of Renormalization Group Invariance (RGI): theoretical predictions cannot depend on arbitrary conventions such as the renormalization scheme. One often argues that the inclusion of higher-order terms will suppress the scale uncertainty; however, estimating unknown higher-order terms by simply varying the renormalization scale within an arbitrary range is unreliable since it is only sensitive to the terms. In fact, the resulting pQCD series diverges strongly as , the “renormalon” divergence Ellis:1995jv . Moreover, the conventional procedure of guessing the renormalization scale is inconsistent with the Gell-Mann-Low procedure GellMann:1954fq which determines the scale unambiguously in QED. pQCD predictions must analytically match Abelian theory in the limit Brodsky:1997jk .
The Principle of Maximum Conformality (PMC) Brodsky:2011ta ; Brodsky:2012rj ; Brodsky:2011ig ; Mojaza:2012mf ; Brodsky:2013vpa provides a systematic way to eliminate the renormalization scheme-and-scale ambiguities. The PMC scales are fixed by absorbing the terms that govern the behavior of the running coupling via the Renormalization Group Equation (RGE). Since the PMC predictions do not depend on the choice of the renormalization scheme, PMC scale setting satisfies the principles of RGI Brodsky:2012ms ; Wu:2014iba ; Wu:2019mky . Since the terms do not appear in the pQCD series after the PMC, there is no renormalon divergence. The PMC method extends the Brodsky-Lepage-Mackenzie (BLM) scale-setting method Brodsky:1982gc to all orders, and it reduces in the Abelian limit to the Gell-Mann-Low method GellMann:1954fq .
In this paper, we will apply the PMC to make comprehensive analyses for two classic event shapes: the thrust () Brandt:1964sa ; Farhi:1977sg and the C-parameter () Parisi:1978eg ; Donoghue:1979vi . The PMC renormalization scale depends dynamically on the virtuality of the underlying quark and gluon subprocess and thus the specific kinematics of each event. We then can determine over a large range of by comparing the PMC predictions with the experimental data.
II Numerical results and discussions for the thrust and C-parameter
The thrust and C-parameter are defined as
| (1) |
| (2) |
where denotes the three-momentum of particle . For the thrust, the unit vector is varied to define the thrust direction by maximizing the sum on the right-hand side. For the C-parameter, is the angle between and . The range of values is for the thrust, and for the C-parameter it is .
For our numerical computations, we use the EVENT2 program Catani:1996jh to precisely calculate the perturbative coefficients at the next-to-leading order (NLO). The perturbative coefficients at the next-to-next-to-leading order (NNLO) can be calculated using the EERAD3 program Ridder:2014wza , and are checked using the results of Ref.Weinzierl:2009ms . We use the RunDec program Chetyrkin:2000yt to evaluate the scheme running coupling from Tanabashi:2018oca .
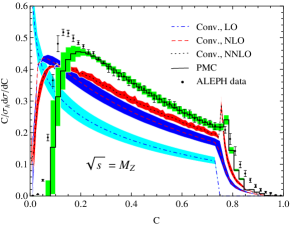
A detailed PMC analysis for the thrust has been given in Ref.Wang:2019ljl . We calculate the C-parameter following a similar procedure and present its differential distributions at in Fig.(1). Figure(1) shows that the conventional predictions – even up to NNLO pQCD corrections – substantially deviate from the precise experimental data. The conventional predictions are plagued by the scale uncertainty. Since the variation of the scale is only sensitive to the terms, the estimate of unknown higher-order terms by varying is unreliable: the NLO calculation does not overlap with the LO prediction, and the NNLO calculation does not overlap with NLO prediction. In addition, the perturbative series for the C-parameter distribution shows slow convergence because of the renormalon divergence. In contrast, Fig.(1) shows that PMC prediction for the C-parameter distribution is in excellent agreement with the experimental data. There is some deviation near the two-jet and multi-jet regions, which is expected since pQCD becomes unreliable due to the presence of large logarithms in those kinematic regions. The resummation of large logarithms is thus required, and this topic has been extensively studied in the literature.
It should be emphasized that the PMC eliminates the scale uncertainty; the conventional estimate of unknown higher-order terms obtained by varying is not applicable to the PMC predictions. An estimate of the unknown higher-order contributions can be characterized by the convergence of the perturbative series and the magnitude of the last-known higher-order term. We note that the relative magnitude of the corrections for the C-parameter distribution is GehrmannDeRidder:2007hr in the intermediate region using conventional scale setting. After using the PMC, the relative magnitude at NLO is improved to be . The error estimate of an th-order calculation can be characterized by the last known term; i.e., , where stands for LO, NLO, NNLO, . After applying the PMC, the unknown term can be estimated using if one assumes that the relative magnitude of the unknown th-order term is the same as that of the known th-order term; i.e., . The resulting PMC error bar for the C-parameter distribution is presented in Fig.(1). This estimate of the unknown higher-order terms is natural for a convergent perturbative series.

Unlike conventional scale-setting, where the scale is fixed at , the PMC scale is determined by absorbing the terms of the pQCD series into the coupling constant. The resulting PMC scale is not a single value, but it monotonously increases with the value of , reflecting the increasing virtuality of the QCD dynamics. Thus, simply fixing the scale at obviously violates the physical behavior of the C-parameter distribution. In addition, the number of active flavors changes with the value of according to the PMC scale. More explicitly, the PMC scale in the region is presented in Fig.(2). The LO contribution vanishes in the region; the NLO PMC scale is determined in this domain by using the NNLO contribution. Near the two-jet region, the quarks and gluons have soft virtuality, and the PMC renormalization scale becomes small. The pQCD theory thus becomes unreliable in this domain. The dynamics of the PMC scale thus signals the correct physical behavior in the two-jet region. After PMC scale-setting, the resulting pQCD series with gives the prediction for a “conformal collider” Hofman:2008ar . The correct physical behavior of the scale for event shapes was also obtained in Refs.Kramer:1990zt ; Gehrmann:2014uva . Soft-collinear effective theory also determines the C-parameter distribution at different energy scales Hoang:2014wka .
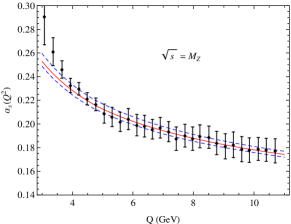
Since the renormalization scale is simply set as when using conventional scale setting, only one value of at scale can be extracted. In contrast, since the PMC scale varies with the value of the event shape , we can extract over a wide range of using the experimental data at a single energy of . By adopting a method similar to Becher:2008cf , we have determined bin-by-bin from the comparison of PMC predictions with measurements at ; see Fig.(3). The results for in the range GeV GeV are in excellent agreement with the world average evaluated from Tanabashi:2018oca . Since the PMC method eliminates the renormalization scale uncertainty, the extracted is not plagued by any uncertainty from the choice of . The results for obtained from the thrust observable using the PMC are consistent with the results using the C-parameter Wang:2019ljl . Thus, PMC scale-setting provides a remarkable way to verify the running of from event shapes measured at a single energy of .
III Mean values for the thrust and C-parameter
The differential distributions of event shapes are afflicted with large logarithms in the two-jet region. The comparison of QCD predictions with experimental data and then extracting are restricted to the region where leading-twist pQCD theory is able to describe the data well. Choosing different domains of the distributions leads to different values of . Note that the mean value of event shapes,
| (3) |
where is the kinematically allowed upper limit of the variable, involves an integration over the full phase space, it thus provides an important complement to the differential distributions and to determinate .
The PMC renormalization scales corresponding to the mean values for the thrust and C-parameter are
respectively. The PMC scales satisfy reflecting the virtuality of the underlying QCD subprocesses and the effective number of quark flavors . We note that the analysis of Ref.Heister:2003aj using conventional scale setting leads to an anomalously large value of , demonstrating again that the correct description for the mean values requires .
In the case of the center-of-mass energy at the peak, GeV, the PMC scales are GeV and GeV for the thrust and C-parameter, respectively. The PMC scales of the differential distributions for the thrust and C-parameter are also very small. The average of the PMC scales of the differential distributions for the thrust and C-parameter are close to the PMC scales and , respectively. This shows that PMC scale setting is self-consistent with the differential distributions for the event shapes and their mean values.
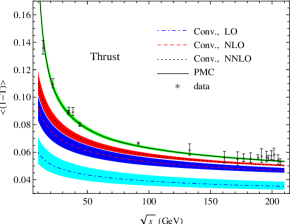
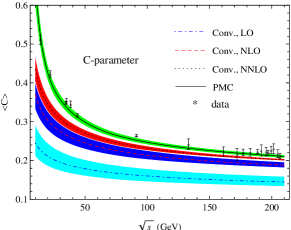
We present the mean values for the thrust and C-parameter versus the center-of-mass energy in Fig.(4). It shows that in the case of conventional scale setting, the predictions are plagued by the renormalization scale uncertainty and substantially deviate from measurements even up to NNLO GehrmannDeRidder:2009dp ; Weinzierl:2009yz . In contrast, after using PMC scale setting, the mean values for the thrust and C-parameter are increased, especially for small . The scale-independent PMC predictions are in excellent agreement with the experimental data over the wide range of center-of-mass energies . Thus, PMC scale setting provides a rigorous, comprehensive description of the measurements without artificial parameters.

Since a high degree of consistency between the PMC predictions and the measurements is obtained, we can extract with high precision; the results in the scheme are presented in Fig.(5). The values obtained for are mutually compatible and are in excellent agreement with the world average in the range GeV GeV. The results are not plagued by the renormalization scale uncertainty. In addition, unlike the extracted from the differential distributions, the extracted from the mean values are not afflicted with large logarithmic contributions nor non-perturbative effects.
We can also obtain a highly precise determination of the value of from a fit of the PMC predictions to the measurements. We adopt the method similar to Pahl:2008uc and the -fit is defined by , where is the value of the experimental data, is the corresponding experimental uncertainty, is the theoretical prediction. The value is minimized with respect to for the thrust and C-parameter separately. We obtain
| (4) | |||||
with d.o.f. for the thrust mean value, and
| (5) | |||||
with d.o.f. for the C-parameter mean value, where the first (Exp.) and second (Theo.) errors are the experimental and theoretical uncertainties, respectively. Both values are consistent with the world average of Tanabashi:2018oca . Since the dominant scale uncertainty is eliminated and the convergence of pQCD series is greatly improved after using the PMC, the precision of the extracted values is largely improved. In particular, since a strikingly much faster pQCD convergence is obtained for the thrust mean value Wang:2019ljl , the theoretical uncertainty is even smaller than the experimental uncertainty.
We can also apply the PMC analysis to QED event shapes, where the final-state particles in are restricted to leptons and photons. The PMC scales for QCD and QED event shapes are identical at LO after applying the relation between PMC scales: ; this factor converts the scale underlying predictions in the scheme used in QCD to the scale of the scheme conventionally used in QED Brodsky:1994eh . The running of the QED coupling can be determined from events at a single energy of Abbiendi:2005rx . Thus one can use the measured event shape distribution in to measure the QED coupling over a large range of .
IV Summary
In summary, the strong running coupling of QCD and its property of asymptotic freedom is fundamental to all QCD analyses; its determination from event-shape distributions is an essential input. The PMC predictions for pQCD are independent of the choice of the initial renormalization scale and the choice of renormalization scheme. Renormalon divergences are eliminated. The PMC procedure is identical in the Abelian limit to the standard Gell-Mann-Low method for QED. It is thus also essential for renormalization scale-setting for grand-unified theories. We have shown that a comprehensive and self-consistent analysis for both the differential distributions and the mean values for event shapes is obtained by using PMC scale setting. The highly consistent results for the and event-shape distributions verify the applicability of the PMC to pQCD. The PMC provides a rigorous method for unambiguously setting the renormalization scale as function of the event-shape kinematics, reflecting the virtuality of the underlying QCD subprocesses. Thus the PMC provides a remarkable way to verify the running of from the event shape differential measurement at a single energy of . These new results for are consistent with the world average and are more precise than the values conventionally obtained from the analysis of event shapes currently used in the world average.
Acknowledgements:
This work was supported in part by the Natural Science Foundation of China under Grants No.11625520, No.11705033, No.11847301 and No.11905056; by the Project of Guizhou Provincial Department under Grants No.KY[2016]028 and No.KY[2017]067; and by the Department of Energy Contract No. DE-AC02-76SF00515. SLAC-PUB-17458.
References
- (1) M. Tanabashi et al. [Particle Data Group], Phys. Rev. D 98, 030001 (2018).
- (2) G. Dissertori, A. Gehrmann-De Ridder, T. Gehrmann, E. W. N. Glover, G. Heinrich, G. Luisoni and H. Stenzel, JHEP 0908, 036 (2009).
- (3) R. Abbate, M. Fickinger, A. H. Hoang, V. Mateu and I. W. Stewart, Phys. Rev. D 83, 074021 (2011).
- (4) A. H. Hoang, D. W. Kolodrubetz, V. Mateu and I. W. Stewart, Phys. Rev. D 91, 094018 (2015).
- (5) J. R. Ellis, E. Gardi, M. Karliner and M. A. Samuel, Phys. Lett. B 366, 268 (1996).
- (6) M. Gell-Mann and F. E. Low, Phys. Rev. 95, 1300 (1954).
- (7) S. J. Brodsky and P. Huet, Phys. Lett. B 417, 145 (1998).
- (8) S. J. Brodsky and X. G. Wu, Phys. Rev. D 85, 034038 (2012).
- (9) S. J. Brodsky and X. G. Wu, Phys. Rev. Lett. 109, 042002 (2012).
- (10) S. J. Brodsky and L. Di Giustino, Phys. Rev. D 86, 085026 (2012).
- (11) M. Mojaza, S. J. Brodsky and X. G. Wu, Phys. Rev. Lett. 110, 192001 (2013).
- (12) S. J. Brodsky, M. Mojaza and X. G. Wu, Phys. Rev. D 89, 014027 (2014).
- (13) S. J. Brodsky and X. G. Wu, Phys. Rev. D 86, 054018 (2012).
- (14) X. G. Wu, Y. Ma, S. Q. Wang, H. B. Fu, H. H. Ma, S. J. Brodsky and M. Mojaza, Rept. Prog. Phys. 78, 126201 (2015).
- (15) X. G. Wu, J. M. Shen, B. L. Du, X. D. Huang, S. Q. Wang and S. J. Brodsky, arXiv:1903.12177 [hep-ph].
- (16) S. J. Brodsky, G. P. Lepage and P. B. Mackenzie, Phys. Rev. D 28, 228 (1983).
- (17) S. Brandt, C. Peyrou, R. Sosnowski and A. Wroblewski, Phys. Lett. 12, 57 (1964).
- (18) E. Farhi, Phys. Rev. Lett. 39, 1587 (1977).
- (19) G. Parisi, Phys. Lett. B 74, 65 (1978).
- (20) J. F. Donoghue, F. E. Low and S. Y. Pi, Phys. Rev. D 20, 2759 (1979).
- (21) S. Catani and M. H. Seymour, Phys. Lett. B 378, 287 (1996).
- (22) A. Gehrmann-De Ridder, T. Gehrmann, E. W. N. Glover and G. Heinrich, Comput. Phys. Commun. 185, 3331 (2014).
- (23) S. Weinzierl, JHEP 0906, 041 (2009).
- (24) K. G. Chetyrkin, J. H. Kuhn and M. Steinhauser, Comput. Phys. Commun. 133, 43 (2000).
- (25) S. Q. Wang, S. J. Brodsky, X. G. Wu and L. Di Giustino, Phys. Rev. D 99, 114020 (2019).
- (26) A. Heister et al. [ALEPH Collaboration], Eur. Phys. J. C 35, 457 (2004).
- (27) A. Gehrmann-De Ridder, T. Gehrmann, E. W. N. Glover and G. Heinrich, JHEP 0712, 094 (2007).
- (28) D. M. Hofman and J. Maldacena, JHEP 0805, 012 (2008).
- (29) G. Kramer and B. Lampe, Z. Phys. A 339, 189 (1991).
- (30) T. Gehrmann, N. Häfliger and P. F. Monni, Eur. Phys. J. C 74, 2896 (2014).
- (31) A. H. Hoang, D. W. Kolodrubetz, V. Mateu and I. W. Stewart, Phys. Rev. D 91, 094017 (2015).
- (32) T. Becher and M. D. Schwartz, JHEP 0807, 034 (2008).
- (33) A. Gehrmann-De Ridder, T. Gehrmann, E. W. N. Glover and G. Heinrich, JHEP 0905, 106 (2009).
- (34) S. Weinzierl, Phys. Rev. D 80, 094018 (2009).
- (35) C. J. Pahl, CERN-THESIS-2007-188; http://cds.cern.ch/record/2284229
- (36) G. Abbiendi et al. [OPAL Collaboration], Eur. Phys. J. C 40, 287 (2005).
- (37) C. Pahl et al. [JADE Collaboration], Eur. Phys. J. C 60, 181 (2009); Erratum: [Eur. Phys. J. C 62, 451 (2009)].
- (38) S. J. Brodsky and H. J. Lu, Phys. Rev. D 51, 3652 (1995).
- (39) G. Abbiendi et al. [OPAL Collaboration], Eur. Phys. J. C 45, 1 (2006).