Software-Enhanced Teaching and Visualization Capabilities of an Ultra-High-Resolution Video Wall
Abstract.
This paper presents a modular approach to enhance the capabilities and features of a visualization and teaching room using software. This approach was applied to a room with a large, high resolution (76804320 pixels), tiled screen of 13 7.5 feet as its main display, and with a variety of audio and video inputs, connected over a network. Many of the techniques described are possible because of a software-enhanced setup, utilizing existing hardware and a collection of mostly open-source tools, allowing to perform collaborative, high-resolution visualizations as well as broadcasting and recording workshops and lectures. The software approach is flexible and allows one to add functionality without changing the hardware.
1. Introduction
In the summer of 2016, the offices of the SciNet HPC Consortium at the University of Toronto in Canada were moved to a new location. Its previous location had a boardroom which also served as a video conferencing room, as well as the room for training and courses, which would usually be recorded and then posted, and sometimes also broadcast. But because of increasing demand for SciNet’s training workshops and courses, the room was almost never large enough. In addition, there never was a proper space for visualizations, as the screens in that room were neither particularly large nor of particularly high resolution.
As we were designing our new office space, we had the vision of a collaborative visualization space with a large, tiled, ultra-high-resolution display. The utilization of ultra high-definition video walls in different scientific fields offers several advantages in many different aspects (majumder2013large, ; 2014PASA…31…33M, ), ranging from higher resolution definition visualizations to sharpening wider fields of view. The same room would also be used as a teaching room, while a separate boardroom across the hall could mirror the session and thus serve as an overflow room. And because SciNet serves a geographically distributed user base, it should be possible for lectures, training sessions and meetings to be recorded and broadcast.
While it was clear from the onset that supporting software would be needed to get all envisioned functionality, the scope of the multi-server software setup turned out to be much larger and involved than anticipated.
The hardware components provide a 100 square feet, 8K capable tiled display in a new teaching/visualization room, which can switch between being driven from a Windows PC server and a dedicated visualization GPU server running Linux. Cameras were installed in the front and the back of the room, with zoom and pan capabilities through a control screen in a lecture console. The same console screen can mirror the large screen. The lecture console has microphones and there are wireless microphones for the room. Sharing of the screens and of sound is possible with the boardroom’s two 4K monitors. There are also inputs for laptops, Apple TV and Chrome-cast. In addition, there is a projector screen, and a possibility for later hook up of a standard university teaching station PC, which would allow this room to be used as a classroom by other groups within the University of Toronto.
Not all of the envisioned capabilities were realized out of the box. For instance, the maximum resolution of the PC server or external laptops that could make it through the various hardware layers and cables, is merely 1080 vertical lines. The visualization server, meanwhile, can run in full 8K mode because its output bypasses the hardware interface in charge of multiplexing (i.e., choosing between the projector or video wall and sharing), but that meant it could not be shown on the preview window in the lectern console. The solution contained no component that allowed online streaming of video and sound; this would require another dedicated hardware appliance.
We used a variety of software to enable most of the envisioned capabilities within the given hardware setup. This paper explains the software stack utilized for driving the video wall, and for recording and broadcasting. It ends by describing the several use cases of the current setup. In our experience, vendors of A/V equipment are not necessarily aware of the software possibilities, and the modular, multi-server setup presented here appears to be novel. We hope it can be of help to places that would like to set up a similar facility.
2. Hardware Components of the Visualization and Teaching Room
To understand how the software running on the server(s) of the teaching room facilitates the room’s functionalities, we will first describe the hardware setup.
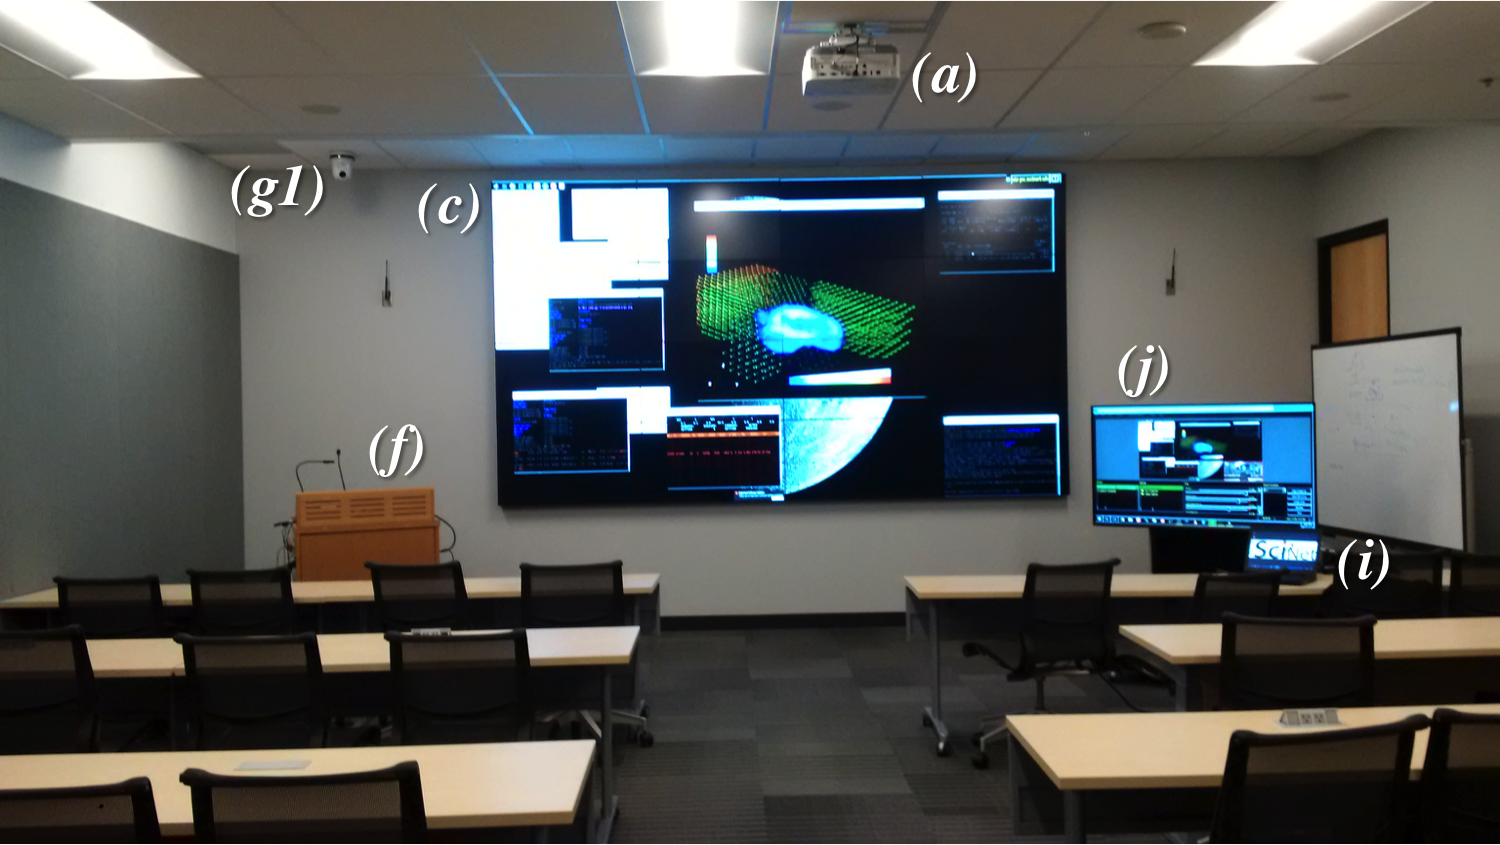
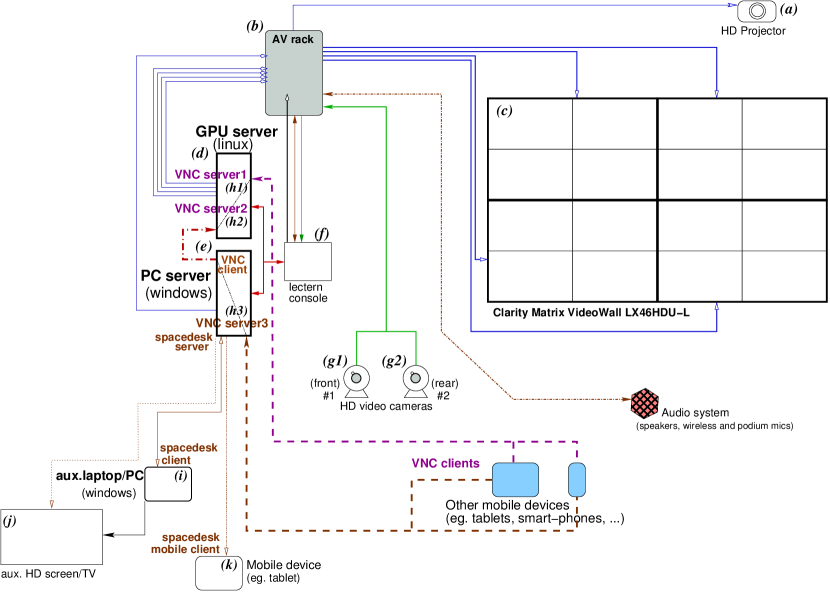
Figure 1 shows a picture of the teaching room. A schematic diagram of the hardware layout of the visualization system is shown in Figure 2.
The most visible part of the hardware setup is the video wall system (). This is a Clarity Matrix LCD Video Wall (ClarityMatrix1, ) by Planar (Planar, ) composed of a 4 by 4 grid of 46 inch displays with a small bezel (ClarityMatrix2, ).
The total resolution is 76804320 pixels (i.e., 8K or UHD resolution). To supply content to the 16 tiles, they are grouped in units of 22 tiles. Each unit acts as a single display; this is accomplished by four hardware splitters (). As a result, the video wall can be driven as if it were a 22 tiled display, and that allows the whole video wall to be driven from just one high-performance graphics card with 4 output ports, hosted by a single high-end visualization server, avoiding the need for a cluster to drive the display (in contrast to e.g. Ref. (Johnson2012DisplayClusterAI, )). 111The visualization server () contains two 14-core Intel Xeon CPUs (E5-2680v4) at 2.40GHz, has 256GB of RAM, and an NVIDIA Quadro M400 graphics card, which can handle up to four outputs. The operating system of the visualization server is openSUSE Leap 42.2.
In addition to the dedicated visualization server that directly drives the video wall at its full resolution, it can also be driven by a Crestron Matrix Switcher. Because the tiled display is also called a matrix, we will refer to the Crestron Matrix Switcher simply as the Switcher. The Switcher has multiple inputs and outputs, which can be controlled from the console.
From the point of the Switcher, the video wall is just one of the outputs. Other available output devices connected to the Switcher are a projector () in the teaching room, and the displays in the boardroom. The Switcher can work in a sharing mode as well, where the audio and video from the teaching room are also played in the boardroom, or vice versa.
The switcher system was designed to be HD capable in order to be compatible with many input and output devices, but this does mean it currently cannot redirect 8K or even 4K output to the video wall. This is the reason the visualization server is directly connected to the video wall instead of also being routed through the switcher, but that in turn means the output of the visualization server cannot be shared with the boardroom nor shown on the projector screen (devices which are presently not 8K capable at any rate).
Other possible inputs to the Switcher are the cameras (), laptops, Apple-TV and Google Chrome-cast, as well as a PC server () intended for presentations and applications that either requires Microsoft Windows or needs to be shown on the projector screen.222The PC server has two 4-core Intel Xeon CPUs (E5-2637v4) at 3.50GHz, with 128GB of RAM, and runs Microsoft Windows 10 as its operating system.
3. Required Functionality
The need for an additional software layer arises from the different kinds of usage that the system needs to support. Among the most common usages are:
-
(1)
High-resolution graphics: Using the visualization server to generate images or animations of data visualizations. This is mostly useful for research and outreach.
-
(2)
Lectures and seminars: The video wall shows presentation material. Optionally, the lecture can be shared with the boardroom, or a second display could show presentation controls. Lectures are still a frequently used educational vehicle.
-
(3)
Recording: like lecturing with added sound capture and optionally including the camera showing the lecturer. Requires post-processing to produce the video to be disseminated online. Such recordings are frequently requested by students, especially in lecture series, where they may have missed some lectures. Recordings can also form the basis of producing an online course or inverted classroom setup.
-
(4)
On-line lecturing (or broadcasting): Instead of recording, the presentation and the camera output need to be combined and made available as an online stream in some standard format. Broadcasting is particularly useful when the audience of a lecture or seminar is geographically dispersed.
-
(5)
Video conferencing: This requires a two-way communication of video and optional screen sharing. It is sometimes desirable to have multiple displays; one for the presentation material and one to see the presenter. Apart from video meetings, this capability is also useful in remote instruction.
-
(6)
Visualization collaborations or demonstrations: One or several people might want to inspect and interact with an 8K visualization on the video wall. In case of a demonstration, recording should also be possible. This can be useful for research, training, and outreach.
-
(7)
Handling multiple screen outputs: In addition to the large UHD video wall, in some cases it could be useful to count with additional screens to further increase the displaying real state.
In the next section, we will explain how our audio-visual setup that was designed for only some of these functions, could be extended to provide all desired functionality.
4. Modular Software Approach
In order to fully exploit the features and capabilities of the visualization and teaching room, we used a series of software packages to augment the hardware capabilities, which we will describe in this section.
The software solution relies heavily on a (wired) network. Through the network, video and control signals can be exchanged between various servers (e.g. GPU server, PC, laptops, and mobile devices), using software solutions such as VNC(vnc_IEEE_1998, ; x11vnc, ), OBS(OBS, ), and nginx-rtmp(nginxrtmp, ). Wireless capabilities are added through a dedicated router (so that connected devices live on the same network and are not blocked by firewall rules).
The first three ways of using the system described in the previous sections, i.e., high resolution graphics, lecturing and recording, require very few additional software tools, as long as lecturing and recording at 19201080 resolution is acceptable. The camera feed is accessible from the PC server, on which common presentation software as well as recording software can be run. For recording, we at first installed Camtasia (Camtasia, ) (which has useful post-processing features), but later also the free software ActivePresenter (ActivePresenter, ) and the open-source Open Broadcaster Software (OBS, ).
The Open Broadcaster Software also enables the fourth point, online lecturing, except for a final step: to broadcast to the internet, one needs the feed from the software to be pointed to a streaming server which can then stream it through a standard protocol. Some streaming servers are available online, but require at least an account. To have our setup be independent of an external site, we instead installed an nginx-based media streaming server, the nginx-rtmp module (nginx version 1.10, nginx-rtmp version 1.13) (nginxrtmp, ), inside a Ubuntu 16.04 virtual machine that runs on the PC server using VirtualBox (VirtualBox-website, ). This same module allows streaming and recording at the same time.333The default streaming protocol of this module is “rtmp”, which is associated with flash and not universally supported anymore, but it should be possible to switch to different protocols like “hls” and “dash.”
Video conferencing or remote participation, the fifth required functionality from the previous section, is possible with the PC server through a variety of proprietary applications, such as Skype, Vidyo and Zoom. This requires no further help from software, unless one wants to have a two-monitor setup, one with slides and one with the presenter, for instance (we will come back to this capability below).
The case of collaborative visualization or demonstrations turned out to be the most involved to get to work. In this case, a group of people might be interactively involved in the visualization, perhaps walking around and inspecting different parts of the displayed graphics, or one person is interacting with the visualization while explaining it to an audience. One might want to zoom in on particular aspects, or change parameters, while looking at the video wall. The challenge is to overcome the restriction that the visualization server can only be controlled from the console, so one could not walk around and manipulate the graphics. A further complication is that the console faces away from the video wall and doesn’t show a preview of the screen, because the console can only show output from the Switcher, which the visualization server bypasses.
To make the setup suitable for such interactive usage, we first start a Virtual Network Computing (VNC) server on the 8K visualization server (“VNC server1” in Figure 2). Because VNC (vnc_IEEE_1998, ) is a protocol to view and interact with a remote screen, where the VNC server captures the screen and sends this to VNC clients on other computers, one can have a tablet running the VNC client showing and controlling the same screen that is showing on the video wall.
The VNC server on the visualization server that we picked for this was x11vnc (x11vnc, ), which is capable of server-side scaling on Linux, thus bringing the transfer rate needed to mirror the 8K desktop image down to something that a laptop or tablet can handle over a typical wireless network.444The PC server can be driven remotely as well, using a VNC server for Microsoft Windows, such as UltraVNC (“VNC server3” in Figure 2). The laptop or tablet can then be used to control the video wall without being tethered to the lecture console. A second scaling VNC server (“VNC server2” in Figure 2) on the GPU servers sends a signal to a VNC client on the windows PC that matches the PC’s resolution. The Windows PC also captures the camera input, and runs the capturing software, enabling a recording of the event at the lower resolution of 19201080, while the video wall showed the full 8K visualization. In addition, the PC server’s screen was visible on the lecture console, so lecture-style demonstrations were still possible. See Figure 2 for a detailed illustration.
Finally, the addition of further displays or monitors can be of use in presentations and remote instruction. The hardware was not designed with this in mind, but it is possible to do this in software, such that the system could have a secondary monitor which is, e.g., a 55” screen or a smaller computer monitor (see in Figure 1). The first option (an additional monitor) can be useful in the case of having a remote participation or demonstration, where the video wall is used to display the main presentation or participation, whereas the additional screen can be used to show the presenter or other details related to the main visualization. The second setup (using an additional laptop) can be useful as an aid to the presenter, where information about the active presentation in the video wall is visualized privately on the laptop for the presenter, eg. slideshows in presenter mode, or confidential material not to be shared through the videowall.
In order to achieve this, a Windows laptop was added to the setup , which was connected to the additional display . We use a software named spacedesk(spacedesk, ). The spacedesk server portion runs on the Windows server , while the spacedesk client runs on the laptop . What spacedesk accomplishes is that the client’s display becomes visible as a second monitor on the Windows server. To be able to run spacedesk, there are restrictions on the server side: The spacedesk server requires Windows 10 as its operating system (which the Windows server has). However, the client (here, the additional laptop) can run an older version of Windows, an Apple device, or an android device. The second display could therefore even be a portal mobile device, such a tablet or a smartphone .
| server | software stack | accessible hardware |
|---|---|---|
| PC server (e) | VNC server | videowall (with 2K full-resolution) |
| OS: Windows | VNC client | HD cameras |
| VirtualBox: Linux server/streaming | audio system | |
| OBS | HD projector | |
| Skype/Vidyo | USB inputs (wireless mic, wireless keyboard and mouse, …) | |
| spaceDesk server | ||
| GPU server (d) | VNC server: x11vnc | videowall (with 8K full-resolution) |
| OS: Linux | Visualization packages: VisIt, ParaView, VMD, Gephi, … | audio system |
| Video manipulation packages: ffmpeg, mencoder, VLC, … | USB inputs | |
| NVIDIA drivers, openGL, … |
The result of combining, VNC, OBS, nginx-rtmp, and other
software, is that all six capabilities from the previous section are
realized in the teaching/visualization room.
Table 1 recaps each element in the software stack in correspondance with the servers and its accesible hardware functionalities.
There are other software approaches/systems to drive and utilize large video walls.
All of them present substantially different scopes, goals and higher
complexity to the solution presented here.
For instance,
SAGE2 –Scalable Amplified Group Environment– (marrinan2014sage2, )
from the Electronic Visualization Laboratory at the University of Illinois at Chicago (EVL/UIC),
is an interesting tool for sharing files and images through a web-browser interface.
Its utilization is quite simple from the user perspective, however
its main and default features are mostly limited to upload and manipulate certain
predefined file types (images, videos, documents) into the video wall.
It is also possible to write specific applications for taking advantage of SAGE2,
but complex software and complicated software interfaces/interactions,
such as the ones described in the following section would not be possible to achieve in this framework.
Display Cluster (Johnson2012DisplayClusterAI, ) from Texas Advanced Computing Center (TACC),
offers a more complex and elaborated approach to driving a tiled display, fulfilling these and other features.
However it requires a hardware setup much more sophisticated than the one presented here,
basically it is driven by a cluster-type server.
Moreover, we should emphasize that the type of hardware, ie. video wall we have,
has to be handled as just one input/output connection due to
a design requirement to be able to connect many
different input devices to the system.
5. Demonstrations
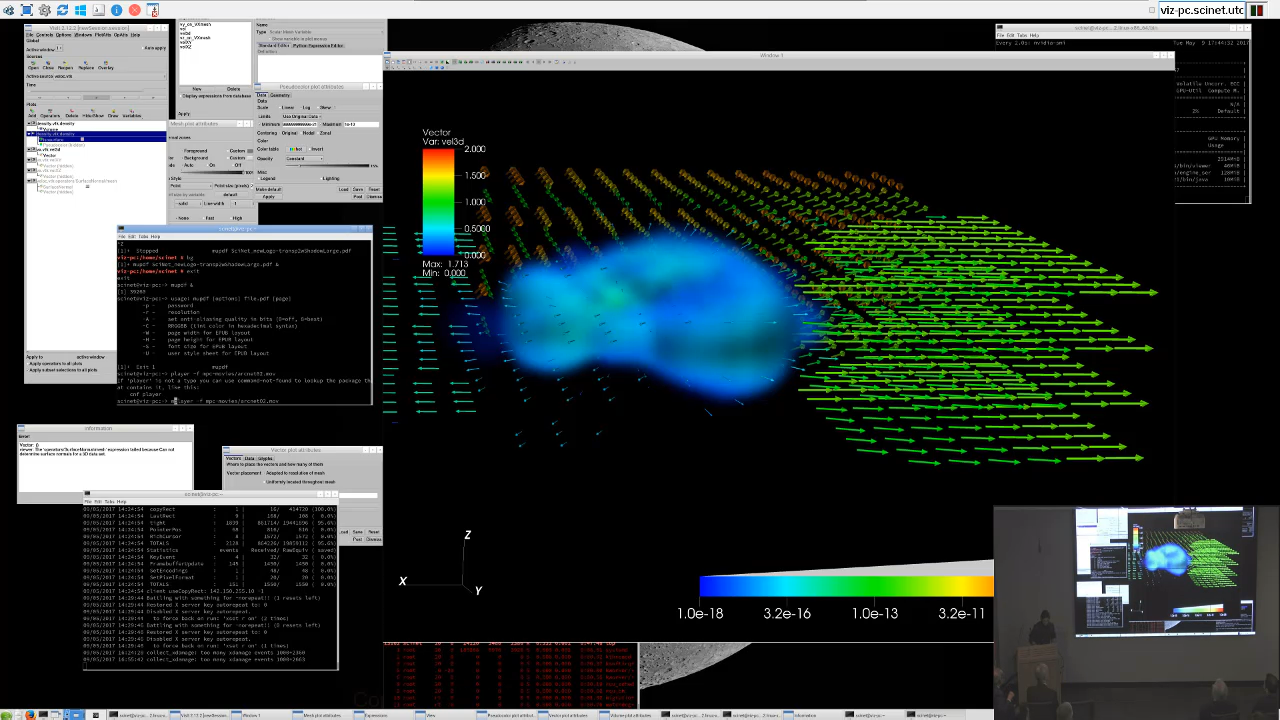
We will briefly describe a few cases to demonstrate the capabilities of the video wall utilizing the software solution described in section 4. A full recording of these demonstrations is available on our YouTube channel (SciNetYouTubeChannel, ). These were part of the grand opening of the new office space. Some snapshots of these demonstrations, taken utilizing the setup described in the previous section, are displayed in Figure 3 and Figure 4. Two demos showed how to get insights into complex data: in the first case, by visualizing the software installed on SciNet’s main cluster by using graph visualizations (Figure 3); in the second one, by presenting several simulations generated using computational astrophysics, e.g. interacting neutron stars, with data from numerical general relativity simulations.
A third demonstration of the room’s capabilities are in usage as a host site in a remote instruction event. We should also note that the teaching/visualization room is actively used in the education and training program of SciNet(SciNetWhitepaper, ). While most events in this program are face-to-face, lectures are broadcast, recorded and posted on-line as well on our education website (SciNetEdu, ).
5.1. Graph visualization for software dependencies
The video wall can be used to explore and probe large data sets that can be represented as graphs. As an example, we considered the full corpus of software tools available on SciNet’s General Purpose Cluster (GPC) (1742-6596-256-1-012026, ). The GPC has been operating for eight years with a large user base with diverging and conflicting software needs. These needs are met by providing a bare-bones Linux operating system supplemented by environment modules (modules1, ; modules2, ; modules3, ) that can be loaded on demand by users to provide the particular software they need. In the module system, conflicts can be defined between modules to ensure that incompatible software is not loaded at the same time, while requirements can be defined to make sure software dependencies are met. Several versions of software packages are often available. Old modules are not removed (for reproducibility), causing the module system to have grown into a sizable complex network.
In this demonstration, we scraped the whole set of software modules on the GPC and represented the data as a network where each node is a module and the lines of different colours represent either dependencies between different packages, conflicts among them, or likeness (e.g. versions of the same software).
The visualization is done using Gephi (ICWSM09154, ) (version 0.9.1), which allows to interact in real time with the network representation. This is one of the best cases and examples for utilizing this type of video wall as a display, as it allows the user to have a great ’big picture’ view of the data being displayed (see Figure 3) while also focusing on the details which are sharpened by the high resolution of the display (see inset in Figure 3). The visualization is dynamic: one can change the node-placement algorithm, one can select subsets of nodes based on attributes (e.g., to only show software modules available in a specific past year), hide and show labels, etc.
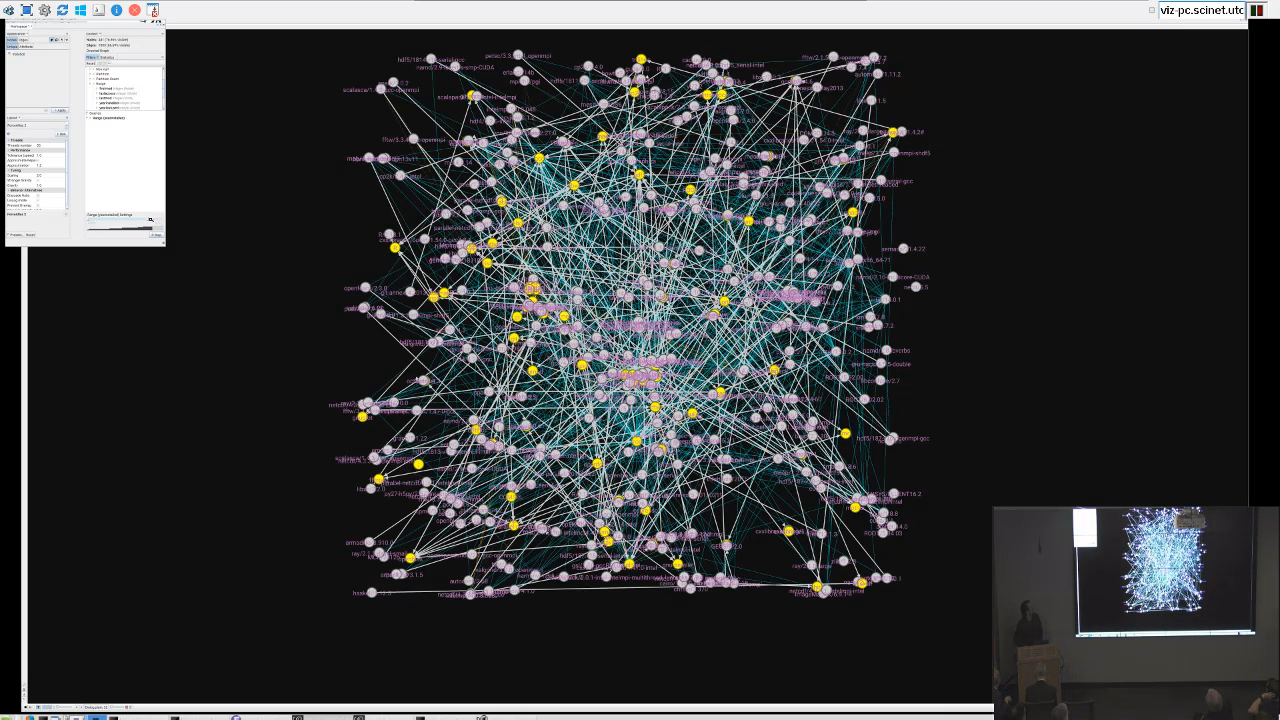
The node placement used here is ForceAtlas2(jacomy14, ), a force-based algorithm. Gephi uses OpenGL to render its graphics.
5.2. Visualization of different astrophysical simulations
The astrophysical visualizations demonstrations were generated as high-resolution videos presenting results from different study cases: gravitational recoil of black holes surrounded by accretion disks (Ponce:2011kv, ), interaction of magnetized neutron star binaries (Palenzuela:2013hu, ; Ponce:2014sza, ), and tidal disruption events of neutron stars by black holes (Roberts:2016igt, ). The videos were generated utilizing the following open source visualization tools: SPLASH (price_2007, ) for the Smoothed-Particle Hydrodynamics (SPH) simulations used for modelling the effects on the accretion disk and tidal disrupted events, and VisIt (HPV:VisIt, ) for the binary neutron star interactions visualizing the 3D magnetic field lines interactions, as well as, current sheets and star fluid density. Figure 4 shows the result of such a visualization from the data of a simulation of a neutron star disrupted by the interaction with a black hole, where several numerical relativity techniques were utilized (Roberts:2016igt, ). Moreover this particular visualization combined an interpolation of the SPH particles and velocity fields into a 3D Cartesian grid that were imported into VisIt, to generate representations of density profiles, streamlines, and velocity fields. The interpolated fields were saved using the VTK legacy format555http://www.vtk.org/wp-content/uploads/2015/04/file-formats.pdf, so that these can be imported into VisIt, where the respective physical quantities are represented via pseudo-color plots, iso-surfaces and iso-volume slices for the fluid density and glyphs and streamlines for the velocity field. As it is usually the case, the visualization of streamlines and vector field representations are in big part an art and strongly dependent on the geometry of the problem, as well as, the selection of the location for the seeds utilized for aiding the stream-or-field lines origins. The streamlines representations were generated integrating in both directions in the pathline, utilizing a Dormand-Prince (Runge-Kutta) integrator, where tolerances and maximum steps of integration were adjusted for each particular case. In the case of the SPH simulation, the situation is easier as the selection is guided by the interpolation into the Cartesian grid. However, the magnetic field lines are in general way more challenging, not only for the strong dynamical regime of the cases presented here, but also due to the intrinsic nature of the magnetic field lines.
As VisIt (as well as Gephi) has the capability of generating images of arbitrary resolution, generating images in full 8K resolution can be performed on any reasonably powerful visualization server, but the video wall allows to view it at a scale on which all details can be seen.
The final presentation for the astrophysical visualizations was generated combining the individual videos of the previous mentioned cases, sliding through them using Prezi (prezi.com, ) via their academic/educational license666A complete demo can be found in the following link: http://prezi.com/qv_ke57mkjri/?utm_campaign=share&utm_medium=copy.. An alternative open-source tool with similar functionalities to those of Prezi is impress.js777 impress.js is a presentation framework based on CSS3 (see https://github.com/impress/impress.js/) which can be coded using simple html-type commands, or, for instance, utilizing hovercraft via its python wrapper interface.
5.3. Collaborative workshop
The preceding demonstrations were the very first actual uses of our setup employing the software enhanced solution presented here. Since then, we have also utilized this setup for broadcasting and remotely hosting several workshops type of activities, e.g. (PetaScaleInstitute, ; BrainHack, ; VizHack, ). For this type of events, we used the multi-monitor setup described in section 4 and shown in Figure 1, in combination with Zoom(zoom, ). Without the advanced teaching/visualization room, these events could not have been offered.
6. Conclusion
In this paper, we have presented a versatile and modular setup to drive, manage and enhance the utilization of a video wall system in its native UHD resolution for visualization, lecturing, broadcasting, recording, video conferences, collaborations, and demonstrations. We further described a number of demonstrations employing this setup.
The novelty we would like to emphasize here is the relative simplicity, flexibility and cost efficient approach we proposed. One limitation with the current setup is related to the precise GPU model our server uses, which does not have the capability of rendering 8K videos in hardware. But given the modularity and flexibility of the current approach, such a restriction can easily be overcome by upgrading the GPU model that does have this capability. Flexibility of the setup is also important to be able to incorporate new features and modern technology-enhanced teaching techniques.
This software-enhanced solution will be applicable to other systems like this, if not in its entirety then at least in parts. The approach augmenting the existing capability of a video wall using software, is more efficient in terms of cost and flexibility than redesigning and upgrading the hardware system.
Acknowledgements.
We want to thank all our colleagues at SciNet, especially Daniel Gruner, Scott Northrup, Marco Saldarriaga and Jason Chong, whom helped dealing with the logistics and setting up the hardware and servers in our visualization-teaching room. We thank Leslie Groer and Erik Spence for careful reading of the manuscript.References
- [1] ActivePresenter, ver. 6.0.5. https://atomisystems.com/activepresenter. Accessed: 2017-06-09.
- [2] Environment Modules. http://modules.sourceforge.net/. Accessed: 2017-06-13.
- [3] Open Broadcaster Software, ver. 17.0.0. https://obsproject.com. Accessed: 2017-06-09.
- [4] Prezi. https://prezi.com/. Accessed: 2017-06-12.
- [5] SciNet Education Website. https://support.scinet.utoronto.ca/eduation. Accessed: 2018-06-09.
- [6] SciNet YouTube Channel. https://www.youtube.com/watch?v=q0XvNS0upJI. Accessed: 2018-06-09.
- [7] spaceDesk: Windows Network Display Monitor Software. http://spacedesk.ph/. Accessed: 2017-10-18.
- [8] Virtual Box, ver. 5.1.22. https://www.virtualbox.org. Accessed: 2017-06-13.
- [9] Zoom. https://zoom.us. Accessed: 2018-06-09.
- [10] Scaling to PetaScale Institute. https://bluewaters.ncsa.illinois.edu/petascale-summer-institute, 2017. Accessed: 2018-06-09.
- [11] Toronto BrainhackGlobal 2018. https://camh-scwg.github.io/to-brainhack-2018/, 2018. Accessed: 2018-06-09.
- [12] IDIES Visualization Hackathon. http://idies.jhu.edu/news-events/visualization-hackathon/, 2019. Accessed: 2019-01-19.
- [13] Roman Arutyunyan. Nginx-based media streaming server. https://github.com/arut/nginx-rtmp-module. Accessed: 2017-06-12.
- [14] Mathieu Bastian, Sebastien Heymann, and Mathieu Jacomy. Gephi: An open source software for exploring and manipulating networks. In Proceedings of the Third International Conference on Weblogs and Social Media, 2009.
- [15] Hank Childs, Eric Brugger, Brad Whitlock, Jeremy Meredith, Sean Ahern, David Pugmire, Kathleen Biagas, Mark Miller, Cyrus Harrison, Gunther H. Weber, Hari Krishnan, Thomas Fogal, Allen Sanderson, Christoph Garth, E. Wes Bethel, David Camp, Oliver Rübel, Marc Durant, Jean M. Favre, and Paul Navrátil. VisIt: An End-User Tool For Visualizing and Analyzing Very Large Data. In High Performance Visualization–Enabling Extreme-Scale Scientific Insight, pages 357–372. Chapman and Hall/CRC, Oct 2012.
- [16] John L. Furlani. Modules: Providing a Flexible User Environment. Proceedings of the Fifth Large Installation Systems Administration Conference, 1991.
- [17] John L. Furlani and Peter W. Osel. Abstract Yourself With Modules. Proceedings of the Tenth Large Installation Systems Administration Conference, 1996.
- [18] Mathieu Jacomy, Tommaso Venturini, Sebastien Heymann, and Mathieu Bastian. ForceAtlas2, a continuous graph layout algorithm for handy network visualization designed for the Gephi software. PloS one, 9(6):e98679, 2014.
- [19] Gregory P. Johnson, Greg Abram, Brandt M. Westing, Paul A. Navrátil, and Kelly P. Gaither. DisplayCluster: An Interactive Visualization Environment for Tiled Displays. 2012 IEEE International Conference on Cluster Computing, pages 239–247, 2012.
- [20] Chris Loken, Daniel Gruner, Leslie Groer, Richard Peltier, Neil Bunn, Michael Craig, Teresa Henriques, Jillian Dempsey, Ching-Hsing Yu, Joseph Chen, L Jonathan Dursi, Jason Chong, Scott Northrup, Jaime Pinto, Neil Knecht, and Ramses van Zon. SciNet: Lessons Learned from Building a Power-efficient Top-20 System and Data Centre. Journal of Physics: Conference Series, 256(1):012026, 2010.
- [21] Aditi Majumder and Behzad Sajadi. Large area displays: The changing face of visualization. Computer, 46(5):26–33, 2013.
- [22] Marcelo Ponce and Erik Spence and Daniel Gruner and Ramses van Zon. Scientific Computing, High-Performance Computing and Data Science in Higher Education. Journal of Computational Science Education, 10(1), 2019.
- [23] Thomas Marrinan, Jillian Aurisano, Arthur Nishimoto, Krishna Bharadwaj, Victor Mateevitsi, Luc Renambot, Lance Long, Andrew Johnson, and Jason Leigh. Sage2: A new approach for data intensive collaboration using scalable resolution shared displays. In Collaborative Computing: Networking, Applications and Worksharing (CollaborateCom), 2014 International Conference on, pages 177–186. IEEE, 2014.
- [24] B. F. Meade, C. J. Fluke, S. Manos, and R. O. Sinnott. Are Tiled Display Walls Needed for Astronomy? Publications of the Astronomical Society of Australia, 31:e033, August 2014.
- [25] Carlos Palenzuela, Luis Lehner, Marcelo Ponce, Steven L. Liebling, Matthew Anderson, David Neilsen, and Patrick Motl. Electromagnetic and Gravitational Outputs from Binary-Neutron-Star Coalescence. Phys. Rev. Lett., 111(6):061105, 2013.
- [26] Planar. Clarity Matrix LCD Video Wall System. http://www.planar.com/media/436303/clarity-matrix-lcd-video-wall-system-brochure-2-17.pdf. Accessed: 2017-06-09.
- [27] Planar. Digital displays and signage solutions (company website). http://www.planar.com. Accessed: 2017-06-09.
- [28] Planar. Clarity matrix LX46HDU LCD video wall system. Technical report, Planar, June 2017. Accessed: 2017-06-09.
- [29] Marcelo Ponce, Joshua A. Faber, and James C. Lombardi, Jr. Accretion disks around kicked black holes: Post-kick Dynamics. Astrophys. J., 745:71, 2012.
- [30] Marcelo Ponce, Carlos Palenzuela, Luis Lehner, and Steven L. Liebling. Interaction of misaligned magnetospheres in the coalescence of binary neutron stars. Phys. Rev., D90(4):044007, 2014.
- [31] Daniel J. Price. SPLASH: An Interactive Visualisation Tool for Smoothed Particle Hydrodynamics Simulations. Publications of the Astronomical Society of Australia, 24(3):159–173, 2007.
- [32] T. Richardson, Q. Stafford-Fraser, K.R. Wood, and A. Hopper. Virtual network computing. IEEE Internet Computing, 2(1):33–38, 1998.
- [33] Luke F. Roberts, Jonas Lippuner, Matthew D. Duez, Joshua A. Faber, Francois Foucart, James C. Lombardi, Sandra Ning, Christian D. Ott, and Marcelo Ponce. The influence of neutrinos on r-process nucleosynthesis in the ejecta of black hole-neutron star mergers. Mon. Not. Roy. Astron. Soc., 464(4):3907–3919, 2017.
- [34] Karl J. Runge. x11vnc: a VNC server for real X displays, ver. 0.9.13. http://www.karlrunge.com/x11vnc/. Accessed: 2017-06-12.
- [35] TechSmith. Camtasia Video Editing Software for Windows and Mac, ver. 9.0.1. https://www.techsmith.com/camtasia.html. Accessed: 2017-06-09.