Narrow absorption lines complex. III. Gradual transition from Type S to Type N Broad Absorption Line
Abstract
We study the relationship between the broad absorption lines (BALs) that can be decomposed into multiple narrow absorption lines and those that cannot (hereafter Type N and Type S BAL, respectively), based on the analysis of three BAL systems (systems A, B, and C) in two-epoch spectra of quasar SDSS J113009.40+495247.9 (hereafter J1130+4952). As the velocity decreases (from systems A to C), these three BAL systems show a gradual transition from Type S to Type N BAL, and their equivalent widths (EWs) and profile shapes vary in a regular way. We ascribe the absorption line variability in J1130+4952 to the ionization change as a response to the fluctuation of the ionizing continuum based on several factors: (1) coordinated EW strengthening over a wide range in systems A and B, (2) the system B shows an obvious change in Si IV but no significant change in C IV BAL, and (3) asynchronized variability between the continuum and absorption lines. Based on the analysis of the variation mechanism, location, ionization state, and structure of systems A, B, and C, we hold the view that the Type S and Type N BALs in J1130+4952 probe the same clumped outflow, with the Type S BALs originating from the inner part of the outflow with a relatively higher ionization state, smaller column density and more clumpy structures, while the Type N BALs originate from the outer part of the outflow with relatively lower ionization state, larger column density, and fewer clumpy structures.
=1 \collaborationNameFriends of AASTeX
1 Introduction
Blueshifted absorption lines in rest-frame ultraviolet (UV) spectra of quasars are powerful tools in probing outflows and the feedback process to the host galaxies (e.g., Di Matteo et al., 2005; Hopkins et al., 2008; Fabian, 2012). According to the width of absorption profiles, absorption lines can be divided into three categories: broad absorption lines (BALs, absorption widths of at least 2000 , e.g., Weymann et al., 1991), narrow absorption lines (NALs, full width at half maximum (FWHM) narrower than 500 , e.g., Misawa et al., 2007), and mini-broad absorption lines (mini-BALs, absorption widths between those of BALs and NALs, e.g., Hamann & Sabra, 2004). According to previous research, the outflow NALs in quasar spectra are more common than the other two absorption line types. Their detection rate in C IV ions in quasar spectra are roughly 45% for NAL, 5% for mini-BALs, and 20% for BALs (Hamann et al., 2012).
Studies of the physical relationship between these three observed line types can provide valuable information for understanding the quasar outflows. They could represent different stages of the quasar evolution (e.g., Farrah et al., 2007; Hamann et al., 2008), or different sight lines of the quasar inclination (e.g., Murray & Chiang, 1995; Elvis, 2000; Proga et al., 2000). In each case, research has increasingly suggested that these three types of absorption lines in quasar spectra may not belong to essentially separate classes, instead they may probe the same general outflow phenomenon. This conclusion is supported by at least the following research results. First, transitions of one type of outflow line into another type have been reported (Leighly et al., 2009; Hall et al., 2011; Filiz Ak et al., 2013; Rodríguez Hidalgo et al., 2013; Rogerson et al., 2016; Moravec et al., 2017). Second, different types of lines have been simultaneously detected in individual quasars (e.g., Moe et al., 2009; Misawa et al., 2014a, b; Moravec et al., 2017). Third, correlations between the variability of absorption lines and the continuum are proved in systematic studies on different types of lines (Lu et al., 2017; Chen et al., 2018a, b for NAL; Wang et al., 2015; He et al., 2017; Lu et al., 2018; Lu & Lin, 2018c; Vivek, 2019 for BAL). These correlations indicate that the ionization change (IC) is the dominant mechanism for UV absorption line variations, although they cannot completely rule out other variation mechanisms such as transverse motion (TM) of absorbing gas across sight lines.
Moreover, it has recently been reported that some BALs (Type N BALs) can be easily decomposed into multiple NALs (Lu & Lin, 2018a, b, c; Stathopoulos et al., 2019), indicating some of the BALs and intrinsic NALs are essentially the same. However, there are also some BALs (Type S BALs) that have a relatively smooth trough that cannot be decomposed into separated NALs. This raises a new question: what is the physical relationship between Type N BAL and Type S BAL?
In this paper, we report the study of a quasar, J113009.40+495247.9 (; Pâris et al., 2017, hereafter J1130+4952), from the Sloan Digital Sky Survey (SDSS), which shows both Type N and Type S BALs in its two-epoch spectra. This interesting discovery may offer clues to understanding the physical connection between these two BAL types. The structure of the paper is as follows. Section 2 describes the spectral analysis. Section 3 provides the discussions on the variation mechanism, location, ionization state, and structure of the absorption systems. Section 4 includes a summary. Throughout the paper, a CDM cosmology with parameters , , and is adopted.
| Species | Velocity | MJD:52642 | MJD:56412 | Fractional | Note | |||
| EW | FWHM | EW | FWHM | EW | ||||
| () | (Å) | () | (Å) | () | Variation | |||
| Si IV1393 | 2.0061 | 7770 | 370 | 370 | Si1 | |||
| Si IV1402 | 2.0062 | 7757 | 368 | 351 | … | |||
| Si IV1393 | 2.0147 | 6907 | 369 | 369 | Si2 | |||
| Si IV1402 | 2.0149 | 6885 | 417 | 372 | … | |||
| Si IV1393 | 2.0221 | 6173 | 419 | 419 | Si3 | |||
| Si IV1402 | 2.0219 | 6193 | 405 | 333 | … | |||
| Si IV1393 | 2.0331 | 5088 | 340 | 285 | Si4 | |||
| Si IV1402 | 2.0329 | 5108 | 248 | 198 | … | |||
| Si IV1393 | 2.0404 | 4367 | 246 | 266 | Si5 | |||
| Si IV1402 | 2.0402 | 4387 | 248 | 248 | … | |||
| Si IV1393 | 2.0437 | 4039 | 249 | 249 | Si6 | |||
| Si IV1402 | 2.0439 | 4019 | 198 | 198 | … | |||
| C IV BAL | … | 4129b | 4129b | system A | ||||
| Si IVBAL | … | 3934b | 3934b | … | ||||
| C IVBAL | … | 6268b | 6268b | system B | ||||
| Si IVBAL | … | 6965b | 6965b | … | ||||
| C IVBAL | … | 6325b | 6325b | system C | ||||
| Si IVBAL | … | 7588b | 7588b | … | ||||
-
•
aVelocity range of the BAL troughs with respect to the emission rest frame.
-
•
bTotal width calculated from edge-to-edge of the BAL trough.
2 SPECTROSCOPIC ANALYSIS and results
J1130+4952 has been observed twice by the SDSS and SDSS-III’s Baryon Oscillation Spectroscopic Survey (SDSS-BOSS; York et al., 2000; Dawson et al., 2013), on MJD 52,642 and 56,412, with a wavelength region of 3800–9200, and 3600–10000 Å, respectively. We downloaded the two-epoch spectra of J1130+4952 from SDSS data release 14 (DR14; Abolfathi et al., 2018) where the flux calibration has been improved. These two spectra from DR14 have resolutions of 1500 at 3800 Å and 2500 at 9000 Å. Their median signal-to-noise ratio (S/N) are 10.42 (for MJD 52,642 spectrum) and 17.78 (for MJD 56,412 spectrum) per pixel, respectively.
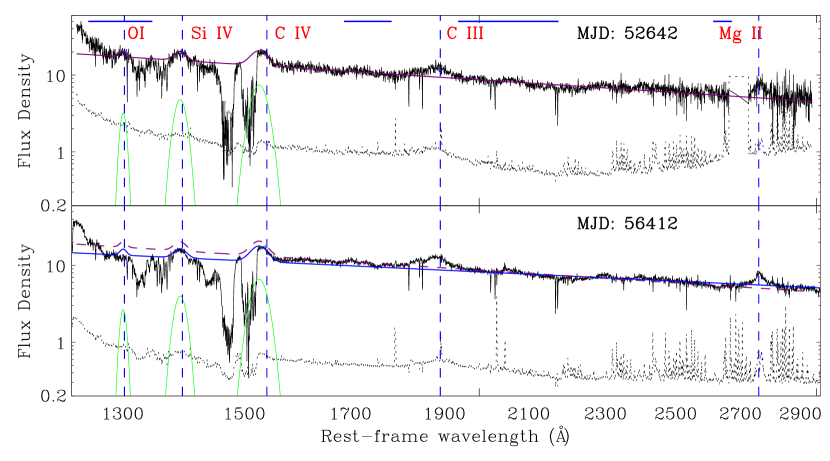
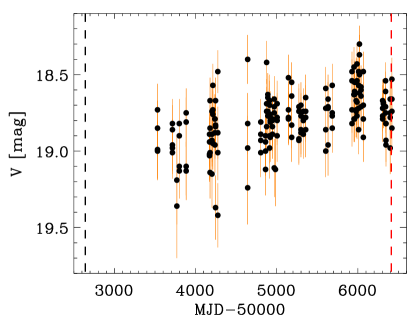
The procedure of spectroscopic analysis in this paper is similar with our previous works (Lu & Lin, 2018a, b, c). In short, the power-law continua were fitted iteratively based on a few wavelength regions (1250–1350, 1700–1800, 1950–2200, and 2650–2710 Å in the rest frame; which is defined by Gibson et al., 2009). Several Gaussian profiles are applied to fit the emission lines. The final pseudo-continuum is a combination of the power-law continuum fit and the fits to the emission lines (Figure 1). In order to further confirm the variation of the quasar continuum, we utilized the -band photometric observations of J1130+4952 from the Catalina Real-Time Transient Survey (CRTS; Drake et al., 2009). CRTS is a large time-domain optical survey with a coverage area of and a baseline of 8 yr, with each target exposing approximately 250 times per year. The survey was performed using unfiltered light and then calibrated to a -band zeropoint. The light curve of J1130+4952 from CRTS is shown in Figure 2.
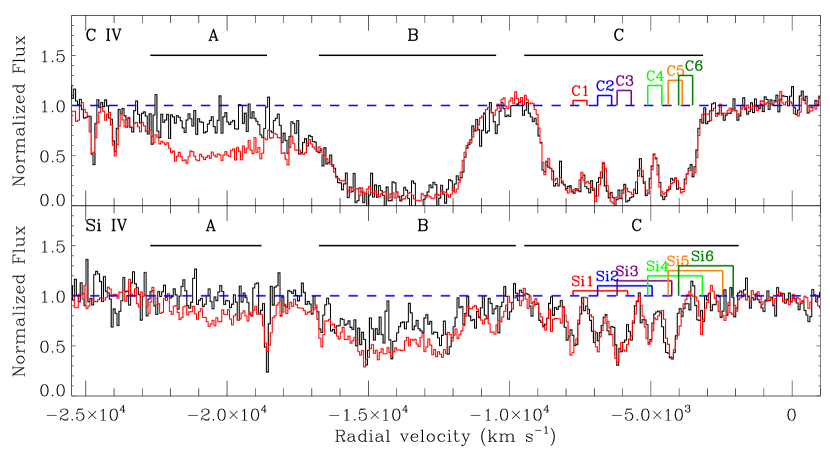
Then we identified absorption lines in the spectra that normalized using the pseudo-continua. As shown in Figure 3, we have detected three BAL systems in J1130+4952 (see also Table 1). Moreover, as the velocity decreases (from systems A to C), we found a gradual transition between these three systems in both their equivalent widths (EWs) and profile shapes. In EWs, both C IV and Si IV BALs of system A show large variation, while both C IV and Si IV BALs of system C show no significant variation111In fact, some Si IV NALs in system C (for example, systems Si3 and Si6) may show time variation, although they have large errors due to the low S/N of the spectra.. System B is in a state of transition between systems A and C, whose Si IV BAL shows obvious variation but no significant change in C IV (hereafter Phenomenon I). In profile shapes, both C IV and Si IV BALs of system A are almost undetectable in the first-epoch SDSS spectrum, but the C IV BAL in the second-epoch spectrum has a relatively smooth semicircular profile that cannot be decomposed into NALs, making it a Type S BAL; the Si IV BAL of system C can be directly resolved into several NALs, and the corresponding NALs of the same system in its C IV BAL are severely blended, but the obvious outline of multiple NAL troughs still be shown in bottom, making it a Type N BAL; system B is in a state of transition between Type N and Type S BALs, whose C IV BAL has a square-bottomed profile with a smooth tail on both sides of the trough, while its Si IV BAL are also cannot be decomposed into NALs but a few NAL troughs on the bottom can still be distinguished.
Note that, in the velocity range from to in the top panel of Figure 3, the continuum flux of the BOSS spectrum is absorbed more than 10%. According to the definition of BAL (Weymann et al., 1991), the C IV in systems A and B could be contained in a single BAL trough. However, as mentioned above, the C IV in systems A and B show obvious differences in both their EWs and profile shapes, we thus separately analyzed them in this paper.
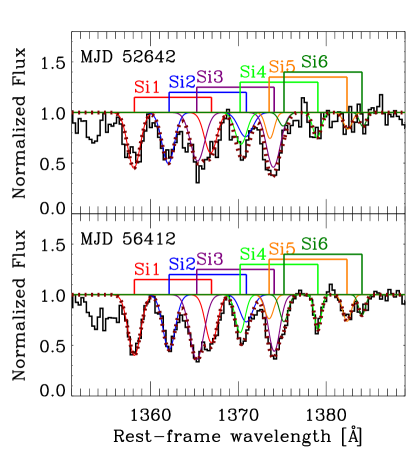
We adopted six pairs of Gaussian functions to fit the NALs within the Si IV BAL trough in system C (Figure 4). Note that the numbers of the absorption systems we have identified are only the lower limit because of the low resolution of the spectra, as well as the blending of the NALs. For example, there is absorption in the blue side of the Si IV BAL in system C, which means that six Gaussian profiles cannot completely match the whole Si IV BAL. Then we measured the velocity, EW, FWHM, and fractional EW variation of the NALs based on these Gaussian fits. The methods of calculating the EWs and the corresponding errors of the BALs are the same as those in Lu & Lin (2018a; see their Equations (2) and (3)), and the equations for the fractional-EW-variation and the corresponding error calculations are the same as those in Lu et al. (2018; see their Equations (2) and (3)). Measured values of the NALs and BALs are listed in Table 1.
3 DISCUSSION
Results in Section 2 provide clues to understanding the physical relationship between systems A, B, and C. One of the most vital points is the gradual transition between these three systems. The simultaneous detection of systems A, B, and C, as well as their gradual transition in EW and profile shape described above indicate a close physical relationship between these three systems. Below, we will discuss the physical relationships between systems A, B, and C from the following aspects: variation mechanism, location, ionization state, and structure.
3.1 Variation mechanism
Variability of a BAL may be caused by a TM and/or IC scenario of an outflow. We hold the opinion that the latter mechanism is responsible for the BAL variability in J1130+4952. Our reasons are as follows.
First, between the two-epoch observations, EW strengthening over the whole BAL trough is detected in the C IV and Si IV BALs in system A and the Si IV BAL in system B. Synchronous changes between multiple NAL/BAL systems (e.g., Hamann et al., 2011; Chen & Qin, 2015; Wang et al., 2015; McGraw et al., 2017) or over a large continuous range of velocity interval in a BAL trough (e.g., Grier et al., 2015; McGraw et al., 2017, 2018) could serve as strong evidence that supports the IC scenario to explain variation in absorption lines. It is difficult to explain the phenomenon of coordinated absorption line change through the TM scenario because it requires coordinated motions of numerous distinct outflow structures (Misawa et al., 2005; Hamann et al., 2011).
Second, Phenomenon I, shown in system B, disfavours the TM scenario, because the TM scenario would likely change the trough profile of a C IV BAL that is highly optically thick (e.g., Misawa et al., 2014a; Capellupo et al., 2014; Wang et al., 2015; McGraw et al., 2018; Lu & Lin, 2018c). In Lu & Lin, 2018c, a moderate anticorrelation between the fractional changes of Si IV BALs and the UV continuum was confirmed in 74 quasars that show Phenomenon I, revealing the ubiquitous effect of the UV continuum variability on Phenomenon I. Phenomenon I also indicates a physical process, strengthening in recombination-driven column density with no significant EW variation, in the saturated C IV BAL (Lu & Lin, 2018c).
Third, asynchronized variability has been identified between the continuum and absorption lines. Anticorrelations between the changes of the ionizing continuum and BALs have been proven (Lu et al., 2018; Lu & Lin, 2018c; Vivek, 2019), which supports the IC scenario as the primary driver of the variability of broad absorption troughs. Therefore, the continuum variation can account for the variability in BAL to some extent. In J1130+4952, when the BALs show coordinated strengthening (see Figure 3) between the two-epoch observations, the power-law continuum appears to have a fractional weakening222We choose the observed wavelength range of Å to obtain the flux of the power-law continuum and the corresponding error is calculated by the error propagation method. of (see Figure 1). This phenomenon is consistent with the anticorrelation in the existing studies.
Based on the above analysis, we attribute the absorption line variability in J1130+4952 to the IC scenario, which is actually the response to the ionizing continuum variability. According to the photoionization simulations, with an increasing ionization parameter (), an EW of C IV or Si IV would rise first, then arrive at a peak, and decrease at the end (e.g., figure 2a of Hamann, 1997). In J1130+4952, asynchronized variability between the continuum and systems A and B indicates that these BALs are at a relatively high ionization state. Besides, we attribute the lack of variation in C IV BAL of system B, as well as in both C IV and Si IV BALs of system C, to saturation, which can be inferred from several aspects: (1) the Phenomenon I shown in system B, (2) the square-bottomed profiles in C IV BALs of systems B and C, and (3)1:1 doublet ratios in some of the resolved Si IV NALs of system C. However, these saturated lines do not reach zero intensity, which indicates partial coverage of these outflow clouds to the background light source. Considering the variation of continuum as the mechanism driving the absorption line variability in J1130+4952, we speculate that the recombination-driven column density strengthening may occur in these saturated BALs, although no significant EW variation is detected. Finally, based on the gradual transition of both EW variation and the saturation between systems A, B, and C, we obtained the column densities .
3.2 Locations
Under the assumption that faster outflow is closer to the central engine and considering the observational evidence that the velocities between systems A, B, and C show a gradual transition, we can make an initial inference that the relationship between the radial distances of the absorbers responsible for systems A, B, and C are .
We can make further estimations of their distances from the central engine in two different ways. On the one hand, as shown in Figure 1, system C is positioned near the center of the broad emission lines (BELs), and the absorption depths of both its Si IV and C IV BALs are deeper than the corresponding BELs, while the system A is positioned at higher velocity with no strong emission lines at its wavelengths, which suggests that the absorbers producing system C cover both the continuum source and broad emission-line region (BELR), while the absorbers producing system A cover only the continuum source. Thus, their distances () from the flux source should be that beyond BELR for absorbers producing system C.
On the other hand, if we simply assume that (1) the ions we measure are the dominant ionization stages and (2) the gas is in an ionization equilibrium state, then we can limit the electron density and the distance of the absorber from the ionizing photon source via using the variability timescale as the upper limit of the recombination time (e.g., Narayanan et al., 2004; Grier et al., 2015). In the case of J1130+4952, the C IV varies between two-epoch observations over a timescale of days (i.e., an rest-frame timescale of days), so we can estimate a lower limit value for the electron density of the absorption gas as , as well as an upper limit on its distance with respect to the center source as . By visually checking Figure 2, we find that the weakening of the V band magnitude was actually happened after MJD56,000. If we take the MJD of 56,000 as the start time of the recombination process, then the timescale for this process is days (i.e., days), which corresponding to a minimum electron density of , and a maximum distance from the center source of .
3.3 Ionization state
The distance of absorption gas to the center can, to some extent, reveal the ionization parameter , which is defined as
| (1) |
where is the emission rate of hydrogen ionization photons. Since they are illuminated by the same background source, systems A, B, and C have the same parameter . According to Equation (1), a closer distance from the center indicates a higher ionization parameter . Thus, in J1130+4952, we got .
Under the situation in which the IC scenario is the mechanism responsible for the BAL variation in J1130+4952, the relationship of the ionization state between systems A, B, and C can, to some extent, be inferred from the gradual EW variation of systems A, B, and C through the photoionization equilibrium analysis (Osterbrock & Ferland, 2006; Wang et al., 2015). As described in Section 2, although illuminated by the same background source, BALs with larger velocity show larger fractional variation. In other words, systems A, B, and C show different response in EW to the same continuum variation. Assuming that the shape of the ionization continuum remains the same and the ionization is controlled by C4+, then the number ratio of C3+ to C4+ can be approximated with (see the detailed calculation process in section 5.4 of Wang et al., 2015)
| (2) |
where the and represent the numbers of ions of C3+ and C4+ respectively. If C5+ is the dominant species, then ; if C6+ is the dominant one, then . A similar analysis can be performed for Si3+. From these calculations we can find that gases with higher ionization states are more sensitive to the ionizing continuum variation. Thus, in J1130+4952, we determine , which is consistent with the deduction from the discussion above.
3.4 Outflow structure and profile shape
We think that the phenomenon of BAL consisting of NALs, as shown in system C, reveals the clumpy structure of BAL outflow. On the contrary, system A have relatively smooth trough that cannot be decomposed into distinct NALs. Does this mean that system A has a different outflow from system C, such as a smooth and homogeneous flow? This conjecture can be overturned when considering both their partial covering characteristics (Section 3.1) and their distances relative to the BELR (Section 3.2). The situation that there are no strong emission lines at the absorption line wavelength of system A indicates that its partial covering pertains to the quasar continuum but not the BELR. This situation of partial covering requires small outflow absorbing structures, owning to the spatial scale of the UV continuum source is expected to be pc across (Hamann et al., 2011). In other words, the outflow clouds responsible for system A also have clumpy structures instead of a smooth flow. Such outflow structures might resemble the schematic of inhomogeneous partial coverage (Hamann et al., 2001; de Kool et al., 2002; Hamann & Sabra, 2004; Arav et al., 2005; Sabra & Hamann, 2005).
Because there is a common origin of clumped flow for systems A and C, then what is/are the physical reason(s) that led to the different profile shape between them? The origin of clumpy outflow structures for system A indicates that they are also consist of a superposition of NAL features, yet it cannot be resolved into distinct NALs; it even has no outline of the NAL features at its bottom (see Figure 3). We think the most likely explanation for this is that the NAL features within system A are more severely blended than system C, which would require a large number of NALs considering their large velocity width (Table 1). Based on the above inferences and the gradual transition of the profile shapes between systems A, B, and C, we can make a further inference that the relationship between the density of clumpy structures responsible for systems A, B, and C are .
Note that a larger density of clumpy structures does not necessarily equate to a higher column density of specific absorption transition(s). Instead, system A in J1030+4952 has a lower column density (less saturation) than system C in transitions of both C IV and Si IV (Section 3.1). This is reasonable when considering that the clumpy structures producing system A have closer distances to the background light source as well as higher degrees of ionization (Section 3.3) than system C, which is located beyond the BELR but has an upper limit of (Section 3.2).
There is other observational evidence that could be used to back up the above assertion. Although the C IV troughs of both systems B and C suffer from saturation, system B has tailing transition regions on both sides of the trough, while the two sides of the C IV trough of system C are straight up and observed to steepen. We think this is because the edges of system C only consist of single (or a few) NAL(s) with relatively lower ionization state(s) and larger EW(s), while the tail of system B is blended with a large number of NALs with higher ionization state(s) and smaller EW(s), which is also consistent with the above assertion.
3.5 Implication
Considering the common origin of a single outflow, we point out that it may be an evolutionary connection between systems A, B, and C in J1130+4952. In other words, the kinematic shift of system A that gradually varies to that of C may be expected in the follow-up observations. The deceleration of quasar winds seems to be expected in galactic feedback models (e.g., Silk & Rees, 1998; Di Matteo et al., 2005; Fabian, 2012), in which the interaction between outflows/winds and environmental material in the host galaxies is a crucial element. If it is indeed an evolutionary connection between systems A, B, and C, then their evolution time should be longer than a few years (rest-frame time), because no significant BAL deceleration is detected between the two-epoch spectra of J1130+4952 during rest-frame timescales of 3.35 yr. Moreover, general BAL acceleration or deceleration have been proven to be rare based on a large sample of multiobserved SDSS quasars (Grier et al., 2016; rest-frame timescales of their sample range from 2.71 to 5.49 yr).
4 Conclusion
Based on the above results and discussions about the systems A, B, and C in J1130+4952, we can pry into the physical relationship between Type S and Type N BALs. The gradual transition of the spectra signatures and physical properties from system A to system C actually represents a gradual transition from Type S BAL to Type N BAL. From J1130+4952, we can find that the outflow clouds responsible for Type S and Type N BALs have both similarities and specialities. On the one hand, both of them originate from the same general clumped outflow, and their gradual transition also indicates that there is no clear boundary between them. On the other hand, the Type S BAL may originate from the inner part of the outflow with relatively higher ionization state, smaller column density, and more clumpy structures, while the Type N BALs originate from outer part of the outflow with a relatively lower ionization state, larger column density, and fewer clumpy structures.
References
- Abolfathi et al. (2018) Abolfathi, B., Aguado, D. S., Aguilar, G., et al. 2018, ApJS, 235, 42
- Arav et al. (2005) Arav, N., Kaastra, J., Kriss, G. A., et al. 2005, ApJ, 620, 665
- Capellupo et al. (2014) Capellupo, D. M., Hamann, F., & Barlow, T. A. 2014, MNRAS, 444, 1893
- Chen et al. (2018a) Chen, Z.-F., Pang, T.-T., He, B., & Huang, Y. 2018a, ApJS, 236, 39
- Chen & Qin (2015) Chen, Z.-F., & Qin, Y.-P. 2015, ApJ, 799, 63
- Chen et al. (2018b) Chen, Z.-F., Yao, M., Pang, T.-T., et al. 2018b, ApJS, 239, 23
- Dawson et al. (2013) Dawson, K. S., Schlegel, D. J., Ahn, C. P., et al. 2013, AJ, 145, 10
- de Kool et al. (2002) de Kool, M., Korista, K. T., & Arav, N. 2002, ApJ, 580, 54
- Di Matteo et al. (2005) Di Matteo, T., Springel, V., & Hernquist, L. 2005, Nature, 433, 604
- Drake et al. (2009) Drake, A. J., Djorgovski, S. G., Mahabal, A., et al. 2009, ApJ, 696, 870
- Elvis (2000) Elvis, M. 2000, ApJ, 545, 63
- Fabian (2012) Fabian, A. C. 2012, ARA&A, 50, 455
- Farrah et al. (2007) Farrah, D., Lacy, M., Priddey, R., Borys, C., & Afonso, J. 2007, ApJ, 662, L59
- Filiz Ak et al. (2013) Filiz Ak, N., Brandt, W. N., Hall, P. B., et al. 2013, ApJ, 777, 168
- Gibson et al. (2009) Gibson, R. R., Jiang, L., Brandt, W. N., et al. 2009, ApJ, 692, 758
- Grier et al. (2015) Grier, C. J., Hall, P. B., Brandt, W. N., et al. 2015, ApJ, 806, 111
- Grier et al. (2016) Grier, C. J., Brandt, W. N., Hall, P. B., et al. 2016, ApJ, 824, 130
- Hall et al. (2011) Hall, P. B., Anosov, K., White, R. L., et al. 2011, MNRAS, 411, 2653
- Hamann (1997) Hamann, F. 1997, ApJS, 109, 279
- Hamann et al. (2011) Hamann, F., Kanekar, N., Prochaska, J. X., et al. 2011, MNRAS, 410, 1957
- Hamann et al. (2008) Hamann, F., Kaplan, K. F., Rodríguez Hidalgo, P., Prochaska, J. X., & Herbert-Fort, S. 2008, MNRAS, 391, L39
- Hamann & Sabra (2004) Hamann, F., & Sabra, B. 2004, in Astronomical Society of the Pacific Conference Series, Vol. 311, AGN Physics with the Sloan Digital Sky Survey, ed. G. T. Richards & P. B. Hall, 203
- Hamann et al. (2012) Hamann, F., Simon, L., Rodriguez Hidalgo, P., & Capellupo, D. 2012, in Astronomical Society of the Pacific Conference Series, Vol. 460, AGN Winds in Charleston, ed. G. Chartas, F. Hamann, & K. M. Leighly, 47
- Hamann et al. (2001) Hamann, F. W., Barlow, T. A., Chaffee, F. C., Foltz, C. B., & Weymann, R. J. 2001, ApJ, 550, 142
- He et al. (2017) He, Z., Wang, T., Zhou, H., et al. 2017, ApJS, 229, 22
- Hopkins et al. (2008) Hopkins, P. F., Hernquist, L., Cox, T. J., & Kereš, D. 2008, ApJS, 175, 356
- Leighly et al. (2009) Leighly, K. M., Hamann, F., Casebeer, D. A., & Grupe, D. 2009, ApJ, 701, 176
- Lu & Lin (2018a) Lu, W.-J., & Lin, Y.-R. 2018a, MNRAS, 474, 3397
- Lu & Lin (2018b) —. 2018b, ApJ, 863, 186
- Lu & Lin (2018c) —. 2018c, ApJ, 862, 46
- Lu et al. (2018) Lu, W.-J., Lin, Y.-R., & Qin, Y.-P. 2018, MNRAS, 473, L106
- Lu et al. (2017) Lu, W.-J., Lin, Y.-R., Qin, Y.-P., et al. 2017, MNRAS, 468, L6
- McGraw et al. (2018) McGraw, S. M., Shields, J. C., Hamann, F. W., Capellupo, D. M., & Herbst, H. 2018, MNRAS, 475, 585
- McGraw et al. (2017) McGraw, S. M., Brandt, W. N., Grier, C. J., et al. 2017, MNRAS, 469, 3163
- Misawa et al. (2014a) Misawa, T., Charlton, J. C., & Eracleous, M. 2014a, ApJ, 792, 77
- Misawa et al. (2007) Misawa, T., Eracleous, M., Charlton, J. C., et al. 2007, in Astronomical Society of the Pacific Conference Series, Vol. 373, The Central Engine of Active Galactic Nuclei, ed. L. C. Ho & J.-W. Wang, 291
- Misawa et al. (2005) Misawa, T., Eracleous, M., Charlton, J. C., & Tajitsu, A. 2005, ApJ, 629, 115
- Misawa et al. (2014b) Misawa, T., Inada, N., Oguri, M., et al. 2014b, ApJ, 794, L20
- Moe et al. (2009) Moe, M., Arav, N., Bautista, M. A., & Korista, K. T. 2009, ApJ, 706, 525
- Moravec et al. (2017) Moravec, E. A., Hamann, F., Capellupo, D. M., et al. 2017, MNRAS, 468, 4539
- Murray & Chiang (1995) Murray, N., & Chiang, J. 1995, ApJ, 454, L105
- Narayanan et al. (2004) Narayanan, D., Hamann, F., Barlow, T., et al. 2004, ApJ, 601, 715
- Osterbrock & Ferland (2006) Osterbrock, D. E., & Ferland, G. J. 2006, Astrophysics of gaseous nebulae and active galactic nuclei
- Pâris et al. (2017) Pâris, I., Petitjean, P., Ross, N. P., et al. 2017, A&A, 597, A79
- Proga et al. (2000) Proga, D., Stone, J. M., & Kallman, T. R. 2000, ApJ, 543, 686
- Rodríguez Hidalgo et al. (2013) Rodríguez Hidalgo, P., Eracleous, M., Charlton, J., et al. 2013, ApJ, 775, 14
- Rogerson et al. (2016) Rogerson, J. A., Hall, P. B., Rodríguez Hidalgo, P., et al. 2016, MNRAS, 457, 405
- Sabra & Hamann (2005) Sabra, B. M., & Hamann, F. 2005, ArXiv Astrophysics e-prints, astro-ph/0509421
- Silk & Rees (1998) Silk, J., & Rees, M. J. 1998, A&A, 331, L1
- Stathopoulos et al. (2019) Stathopoulos, D., Danezis, E., Lyratzi, E., Antoniou, A., & Tzimeas, D. 2019, MNRAS, 486, 894
- Vivek (2019) Vivek, M. 2019, MNRAS, 486, 2379
- Wang et al. (2015) Wang, T., Yang, C., Wang, H., & Ferland, G. 2015, ApJ, 814, 150
- Weymann et al. (1991) Weymann, R. J., Morris, S. L., Foltz, C. B., & Hewett, P. C. 1991, ApJ, 373, 23
- York et al. (2000) York, D. G., Adelman, J., Anderson, Jr., J. E., et al. 2000, AJ, 120, 1579