Constraining cold accretion onto supermassive black holes: molecular gas in the cores of eight brightest cluster galaxies revealed by joint CO and CN absorption
Abstract
To advance our understanding of the fuelling and feedback processes which power the Universe’s most massive black holes, we require a significant increase in our knowledge of the molecular gas which exists in their immediate surroundings. However, the behaviour of this gas is poorly understood due to the difficulties associated with observing it directly. We report on a survey of 18 brightest cluster galaxies lying in cool cores, from which we detect molecular gas in the core regions of eight via carbon monoxide (CO), cyanide (CN) and silicon monoxide (SiO) absorption lines. These absorption lines are produced by cold molecular gas clouds which lie along the line of sight to the bright continuum sources at the galaxy centres. As such, they can be used to determine many properties of the molecular gas which may go on to fuel supermassive black hole accretion and AGN feedback mechanisms. The absorption regions detected have velocities ranging from -45 to 283 km s-1 relative to the systemic velocity of the galaxy, and have a bias for motion towards the host supermassive black hole. We find that the CN N = 0 - 1 absorption lines are typically 10 times stronger than those of CO J = 0 - 1. This is due to the higher electric dipole moment of the CN molecule, which enhances its absorption strength. In terms of molecular number density CO remains the more prevalent molecule with a ratio of CO/CN , similar to that of nearby galaxies. Comparison of CO, CN and H I observations for these systems shows many different combinations of these absorption lines being detected.
keywords:
galaxies: active – galaxies: ISM – galaxies: clusters: general – radio continuum: galaxies – radio lines: ISM1 Introduction
Our understanding of how the molecular gas of cool-core brightest cluster galaxies behaves is largely derived from a mixture of theory (e.g. O’Dea et al., 1994; Nulsen et al., 2005; Pizzolato & Soker, 2005; McNamara & Nulsen, 2012; McNamara et al., 2016), simulations (e.g. Gaspari et al., 2011) and emission line studies (e.g. Crawford et al., 1999; Edge et al., 2002; Jaffe et al., 2005; Donahue et al., 2011; Olivares et al., 2019). Although many theoretical works hypothesise about the behaviour of this molecular gas across a wide range of spatial scales, observational studies typically focus on emission, which probes gas within relatively large collections of molecular clouds and struggles to reveal how it behaves in more compact regions. This includes areas of particular interest, such as the surroundings of the most massive supermassive black holes. As a result of this observational shortfall, there exists a significant gap in our knowledge concerning the behaviour and properties of the molecular gas surrounding active galactic nuclei (AGN). While observations have been absent at this level, simulations such as chaotic cold accretion have predicted that the large reservoirs of molecular gas we see observationally (e.g. Edge, 2001), exist at least in part, as a population of relatively small clouds in the few hundred parsecs around the cores of massive brightest cluster galaxies (e.g. Pizzolato & Soker, 2005; Gaspari et al., 2015, 2018). The ensemble of molecular gas clouds which make up this reservoir are expected to undergo inelastic collisions, causing them to lose angular momentum and be funneled into the few hundred parsecs surrounding the supermassive black hole, eventually providing it with fuel. One important but currently missing observational constraint on this proposed class of AGN feedback scenarios is to determine the properties of the cooled gas such as the mass, temperature, dynamics and its origins, as well as what fraction of it ultimately becomes fuel for future outbursts from the central supermassive black hole.
A small number of recent studies of the molecular gas in the central regions of massive galaxies have begun to focus on molecular absorption, rather than emission. Such absorption line studies have two principal benefits. First, observing absorption against a bright and unresolved backlight makes it possible to study the behaviour and properties of molecular gas on much smaller scales than is achievable from emission. Second, in absorption line studies using a galaxy’s bright radio core as a backlight, redshifted absorption unambiguously indicates inflow while blueshifted lines indicate outflow. In the case of emission lines, there is ambiguity as to whether the gas being traced lies in front of or behind the core of the galaxy. Despite these advantages, molecular absorption studies remain rare, with only a handful of absorbing systems having been found in this way. In terms of brightest cluster galaxies, five associated absorbers have been detected, where the absorption is observed in the spectrum of the bright radio source spatially coincident with the galaxy’s supermassive black hole (David et al., 2014; Tremblay et al., 2016; Ruffa et al., 2019; Rose et al., 2019; Nagai et al., 2019). A small selection of intervening absorbers have also been detected in gravitational lens systems, where absorption is observed in a galaxy separate from, but along the same line of sight as a distant and bright radio continuum source such as a quasi-stellar object (Combes, 2008; Wiklind et al., 2018; Combes et al., 2019).
Two of the associated absorbers detected so far have provided some indication of cold, molecular gas clouds falling towards their host galaxy’s core and thus potentially going on to fuel the supermassive black hole. These observations of NGC 5044 by David et al. (2014) and of Abell 2597 by Tremblay et al. (2016) both show regions of cold molecular gas moving towards the galaxy centre at km s-1. Additionally, Ruffa et al. (2019) and Rose et al. (2019) both show molecular gas which appears to be in stable, slightly elliptical orbits where they most likely drift in a turbulent velocity field, rather than undergoing any significant inflow or outflow.
The molecular gas detected in these systems provides some evidence in line with theories and simulations which predict a gradual drifting of molecular clouds towards a galaxy’s central supermassive black hole. However, with such a small number of detections having been made so far, it is difficult to draw concrete conclusions about the typical behaviour and properties of the molecular gas in the central regions of massive galaxies and how it interacts with the central supermassive black hole. Here we present the results of an Atacama Large Millimeter/submillimeter Array (ALMA) survey of 18 brightest cluster galaxies, all of which are extremely bright and core dominated in the radio. We find evidence of cold gas in the core regions of eight of this sample through the detection of molecular absorption lines. As well as detecting CO absorption, the sample also reveals several absorption lines of CN, a tracer of dense gas in the presence of ultraviolet radiation. There is also a detection of one SiO absorption line. Across the eight systems in which we find molecular absorption, there are 15 new individual CO, CN or SiO absorption lines detected.
This paper is laid out as follows. In §2 we give details of the observations and introduce the sample, while §3 we discuss the data reduction we have carried out. In §4 we present the eight systems with detections of CO, CN and SiO absorption lines. In §5 we show the sources which have CO and CN emission, but lack absorption features and in §6 we briefly discuss the sources which have no absorption or emission features. In §7 we derive the CO and CN column densities from the observed absorption features. In §8 we discuss the significance and implications of our results and in §9 we present our main conclusions. Throughout, we assume a flat CDM Universe with km s-1 Mpc-1, =0.3 and =0.7.
| Source | CO(1-0) | CN-A | CN-B | SiO(3-2) | Archival CO(2-1) | Archival H I |
|---|---|---|---|---|---|---|
| Hydra-A | ✓✓ | ✓✗ | ✓✗ | - | ✓✓ | ✓✗ |
| S555 | ✓✓ | ✓✗ | ✓✗ | - | - | ✗✗ |
| Abell 2390 | ✓✗ | ✓✗ | ✓✗ | ✓✗ | - | ✓✗ |
| RXCJ0439.0+0520 | ✓✗ | ✗✗ | ✗✗ | ✗✗ | - | ✗✗ |
| Abell 1644 | ✗✓ | ✓✗ | ✓✗ | - | - | ✓✗ |
| NGC 5044 | ✗✗ | ✓✗ | ✓✗ | - | ✓✗ | ✗✗ |
| NGC 6868 | ✓✓ | ✓✗ | ✓✗ | - | - | ✓✗ |
| Abell 2597 | ✗✓ | ✓✗ | ✓✗ | - | ✓✓ | ✓✗ |
| RXCJ1350.3+0940 | ✗✓ | ✗✓ | ✗✓ | - | - | ✓✗ |
| MACSJ1931.8-2634 | ✗✓ | - | - | - | - | - |
| RXCJ1603.6+1553 | ✗✓ | ✗✗ | ✗✗ | - | - | ✓✗ |
| RXCJ0132.6-0804 | ✗✗* | ✗✗ | ✗✗ | ✗✗ | - | - |
| MACSJ0242-2132 | ✗✗ | - | ✗✗ | ✗✗ | - | - |
| Abell 3112 | ✗✗ | ✗✗ | ✗✗ | - | - | ✗✗ |
| Abell 496 | ✗✗ | ✗✗ | ✗✗ | - | - | ✗✗ |
| Abell 2415 | ✗✗ | ✗✗ | ✗✗ | - | - | ✓✗ |
| Abell 3581 | ✗✗ | ✗✗ | ✗✗ | - | - | - |
| RXCJ1356-3421 | ✗✗ | ✗✗ | ✗✗ | ✗✗ | - | ✓✗ |
| - Not observed | ||||||
| ✗✗ Not detected in emission or absorption | ||||||
| ✓✗ Absorption detected, emission undetected | ||||||
| ✗✓ Absorption undetected, emission detected | ||||||
| ✓✓ Absorption and emission detected | ||||||
*Detected in emission on scales significantly larger than the beam size.
| Hydra-A | S555 | Abell 2390 | RXCJ0439.0+0520 | Abell 1644 | NGC 5044 | |
| Observation date | 2018 Jul 18 | 2018 Jan 23 | 2018 Jan 07 | 2018 Jan 11 | 2018 Aug 21 | 2018 Sep 20 |
| Integration time (s) | 2700 | 2800 | 8000 | 1300 | 2800 | 2400 |
| CO(1-0) vel. resolution (km s-1) | 2.7 | 2.6 | 3.1 | 3.0 | 2.6 | 2.5 |
| CN vel. resolution (km s-1) | 46 | 45 | 63 | 60 | 45 | 42 |
| SiO(3-2) vel. resolution (km s-1) | - | - | 54 | - | - | - |
| Angular resolution (arcsec) | 1.63 | 0.81 | 0.37 | 0.43 | 1.97 | 0.56 |
| Spatial Resolution (kpc) | 1.72 | 0.70 | 1.36 | 1.46 | 1.83 | 0.11 |
| PWV (mm) | 2.85 | 2.23 | 2.12 | 2.58 | 1.39 | 0.49 |
| FoV (arcsec) | 61.6 | 71.0 | 63.8 | 62.7 | 61.1 | 58.8 |
| ALMA configuration | C43-1 | C43-5 | C43-6 | C43-5 | C43-3 | C43-5 |
| Maximum spacing (m) | 161 | 1400 | 2500 | 1400 | 500 | 1400 |
| CO(1-0) noise/channel (mJy/beam) | 1.00 | 0.45 | 0.25 | 0.76 | 0.65 | 0.59 |
| CN noise/channel (mJy/beam) | 0.16 | 0.064 | 0.030 | 0.11 | 0.10 | 0.073 |
| SiO noise/channel (mJy/beam) | - | - | 0.064 | - | - | - |
| 115 GHz cont. flux density (mJy) | 81.5 | 12.8 | 7.7 | 72.0 | 41.8 | 14.6 |
| CO(2-1) channel width (km s-1) | - | - | - | - | - | 1.3 |
| CO(2-1) noise per channel (mJy) | - | - | - | - | - | 0.95 |
| NGC 6868 | Abell 2597 | RXCJ1350.3+0940 | MACSJ1931.8-2634 | RXCJ1603.6+1553 | |
| Observation date | 2018 Jan 25 | 2018 Jan 02 | 2018 Sep 16 | 2018 Jan 02 | 2018 Sep 16 |
| Integration time (s) | 5100 | 7300 | 5600 | 5300 | 1500 |
| CO(1-0) vel. resolution (km s-1) | 2.5 | 2.7 | 2.9 | 3.4 | 2.8 |
| CN vel. resolution (km s-1) | 42 | 48 | 53 | - | 51 |
| Angular resolution (arcsec) | 0.81 | 0.35 | 0.66 | 0.47 | 0.68 |
| Spatial Resolution (kpc) | 0.15 | 0.54 | 1.55 | 2.33 | 1.36 |
| PWV (mm) | 6.52 | 1.87 | 0.66 | 3.19 | 0.82 |
| FoV (arcsec) | 58.8 | 63.3 | 66.5 | 68.3 | 65.0 |
| ALMA configuration | C43-5 | C43-6 | C43-4 | C43-6 | C43-4 |
| Maximum spacing (m) | 1400 | 2500 | 784 | 2500 | 784 |
| CO(1-0) noise/channel (mJy/beam) | 0.53 | 0.34 | 0.31 | 0.24 | 0.62 |
| CN noise/channel (mJy/beam) | 0.064 | 0.054 | 0.047 | - | 0.12 |
| 115 GHz cont. flux density (mJy) | 14.3 | 7.8 | 10.6 | 3.1 | 54.3 |
| CO(2-1) channel width (km s-1) | - | 4.3 | - | - | - |
| CO(2-1) noise per channel (mJy) | - | 0.23 | - | - | - |
2 Target sample and observed lines
The observations presented in this paper are from an ALMA Cycle 5 survey of core dominated brightest cluster galaxies with extremely high flux densities (project 2017.1.00629.S). In total, time was awarded for observations of 23 targets but three observations were not attempted and two were not sufficiently well calibrated to extract a reliable spectrum. All 23 targets have unresolved emission at 85 - 110 GHz of >10 mJy, so they are both bright and compact enough to probe the behaviour of cold molecular gas along very narrow, uncontaminated lines of sight. In all but one case our ALMA observations of each galaxy’s radio core are unresolved. The exception to this is Abell 3112, though we see no molecular absorption in this system. For the interested reader, all of the observations presented in this paper, including all continuum images, are publicly available via the ALMA Science Archive as of September 20 2019.
The sample of 23 brightest cluster galaxies was drawn from over 750 X-ray selected clusters with complete, multi-frequency radio coverage (Hogan et al., 2015b) that extends to the sub-mm for the brightest sources (Hogan et al., 2015a). Each source has either a detection at 2 mm above 7 mJy (Hogan et al., 2015a), an AT20G 20 GHz (Murphy et al., 2010) detection and/or is included in the OVRO 40m 15 GHz monitoring sample (Richards et al., 2011). There are at most two sources below our declination limit () not included in the original Cycle 5 request (Abell 2055 and Abell 2627) which meet these high frequency selection criteria but are both potentially BL Lac dominated and so are excluded to avoid issues of source orientation (Green et al., 2017). Therefore, we are confident that the sample studied is representative and an essentially complete selection of the brightest mm-bright cores in cluster centres. All of the objects observed, 11 of which appear in the optical emission line sample of Hamer et al. (2016), would most likely be classified as low-ionization nuclear emission-line regions (LINERs) in terms of the line widths of their optical spectra. We are not aware of any observations which would suggest any of the sample could be classified as Seyferts.
Observations were taken between 2018 January 02 and 2018 September 20. The survey focused on detecting emission and absorption due to transitions between the and rotational states of CO. Throughout the paper we write this with the notation of ‘CO(1-0)’ when making general reference the line and when discussing its emission. We also use ‘CO(0-1)’ specifically in reference to its absorption. This line acts as a tracer for molecular hydrogen at temperatures of up to a few tens of Kelvin; H2 is significantly more abundant, but not directly observable at these low temperatures111Assuming a carbon abundance equal to that of the Milky Way gas phase, and that all gas phase carbon exists in CO molecules, the ratio of carbon monoxide to molecular hydrogen is CO/H (Sofia et al., 2004).. As well as the spectral window in which CO lines were anticipated, the brightest cluster galaxies were observed in neighbouring spectral windows in order to estimate the flux densities of their continuum sources. These observations, which are done at a much lower spectral resolution, also provide serendipitous detections of CN lines from the N = 0 - 1 transition. CN molecules are primarily produced by photodiscociation reactions of HCN, and its presence is therefore indicative of dense, molecular gas in the presence of a strong ultraviolet radiation field (for a detailed overview of the origins of CN, see Boger & Sternberg, 2005). Additionally, models have shown that CN production at high column densities can be induced by strong X-ray radiation near active galactic nuclei (Meijerink et al., 2007).
As well as CO and CN lines, in one case SiO absorption is also detected. This dense gas tracer is often indicative of shocks due to outflows and jet-cloud interactions, and its abundance is highest around galactic centres (Rodriguez-Fernandez et al., 2006; Rodríguez-Fernández et al., 2010).
In Table 1, we summarise the observations and detections of CO, CN and H I lines which have been made both in this survey and archival observations. The top section of the table gives details for sources in which we see some form of molecular absorption, discussed fully in §4. The middle section shows sources later discussed in §5 in which we see emission, but no absorption. The lower section gives details for sources in which we see no molecular absorption or emission, discussed in §6. This table provides a useful reference for the reader throughout the paper and helps to place our detections within a wider context. Details of the observations for all sources in which we find evidence of molecular gas from emission and/or absorption lines are given in Table 2.
Below we provide a short description of the previous observations of each galaxy in our survey. We also highlight any previous detections of H I absorption, a tracer of warm atomic gas. In ambiguous cases where a source’s name is often used to describe both the individual brightest cluster galaxy and the wider cluster, we use the name in reference to the former.
-
•
Hydra-A is a giant elliptical galaxy with a close to edge-on disk of dust and molecular gas lying at the centre of an X-ray luminous cluster (Hamer et al., 2014). Hydra-A is an archetype of a brightest cluster galaxy lying in a cooling flow, with powerful radio jets and lobes projected outwards from its centre (Taylor et al., 1990). These are surrounded by cavities in the X-ray emitting gas of the intracluster medium created by repeated AGN outbursts (McNamara et al., 2000; Wise et al., 2007). Previous observations of Hydra-A show extremely strong CO(1-2) absorption against the bright radio core () due to molecular gas moving away from the galaxy centre at a few tens of km s-1(Rose et al., 2019). H I absorption has been detected against the core of the galaxy with a peak optical depth of = 0.0015 (Taylor, 1996).
-
•
S555 is a relatively anonymous low X-ray luminosity cluster selected by the REFLEX survey (Böhringer et al., 2004) which has a strong compact radio source (Hogan et al., 2015b), is known to be core dominated and has a significant radio and gamma-ray flux density (Dutson et al., 2013). Against the core of the galaxy, H I absorption has been searched for, providing an upper limit of (Hogan, 2014).
-
•
Abell 2390 lies at the centre of a highly X-ray luminous cluster (L, Ebeling et al., 1996) with a significant cooling flow of 300 M⊙ yr-1 (Allen et al., 2001). The galaxy has extended optical emission lines (Le Borgne et al., 1991) and contains a significant mass of dust showing up as strong absorption in optical and submillimetre continuum emission (Edge et al., 1999). Against the core of the galaxy, H I absorption has been detected with (Hogan, 2014).
-
•
RXCJ0439.0+0520 has been found to be highly variable in the radio, with significant changes occurring in its 15 GHz spectrum over year long timescales (Hogan et al., 2015b). Optical emission line studies also show a significant H luminosity of erg s-1 (Hamer et al., 2016). Against the core of the galaxy, H I absorption has been searched for, providing an upper limit of (Hogan, 2014).
-
•
Abell 1644 is a poorly studied source lying at the centre of the brighter of two X-ray peaks in its host cluster, which itself has evidence of gas sloshing (Johnson et al., 2010). H I absorption has been detected, though is yet to be published.
-
•
NGC 5044 is a highly perturbed brightest cluster galaxy which contains a significant mass of multiphase gas. It is surrounded by numerous cavities and X-ray filaments which have been inflated by the AGN (Buote et al., 2004; David et al., 2011; Gastaldello et al., 2013). CO(2-1) observations show significant emission and give an inferred molecular gas mass of 6.1 (Temi et al., 2018). CO(1-2) absorption has also been observed due to a series of molecular gas clouds lying along the line of sight to the continuum source, with velocities of approximately km s-1 (David et al., 2014).
-
•
NGC 6868 is poorly studied, though it has been found to have a flat spectrum with a core flux density of 105 mJy at 5 GHz (Hogan et al., 2015a). H I absorption has been observed against the galaxy’s core at a velocity of v km s-1 and FWHM km s-1 (Tom Oosterloo, private communications)
-
•
Abell 2597 is a giant elliptical brightest cluster galaxy surrounded by a dense halo of hot, X-ray bright plasma of megaparsec scales. Observations by Tremblay et al. (2016, 2018) show CO(2-1) emission at the systemic velocity of the galaxy. There are also three distinct regions of CO(1-2) absorbing molecular gas along the line of sight to the galaxy’s radio core, with optical depths of and velocities of km s-1.
-
•
RXCJ1350.3+0940 lies in an extremely strong cool-core cluster which, while selected as part of the ROSAT Bright Source catalogue (RBS1322, Schwope et al., 2000), was misidentified as a BL-LAC (Massaro et al., 2009; Richards et al., 2011; Green et al., 2017) because it is dominated by a 300 mJy, flat-spectrum radio core. Despite having radio, optical, MIR and sub-mm properties which are similar to many of the best known cool-core clusters (e.g. Abell 1068, Abell 1835 and Zw3146), overall the galaxy remains poorly studied (Hogan et al., 2015a; Green et al., 2016). However, around the core of the galaxy, H I absorption has been searched for, giving an upper limit of (Hogan, 2014).
-
•
MACSJ1931.8-2634 lies within an extremely X-ray luminous cool-core containing large cavities and an equivalent mass cooling rate of in the central 50 kpc (Allen et al., 2004, 2008). Clear structure exists within the cluster core and the brightest cluster galaxy itself is strongly elongated in the North-South direction (Ehlert et al., 2011). ALMA data at higher frequencies have recently been published by (Fogarty et al., 2019) but no attempt to determine the extent of any absorption against the core was made in that paper.
-
•
RXCJ1603.6+1553 is another relatively poorly studied cluster, likely due to its brightest cluster galaxy being dominated by a flat-spectrum radio core. Like RXCJ1350.3+0940, the source was selected in the ROSAT Bright Source catalogue (RBS1552) but the bright radio core led to the X-ray source being classified as a BL Lac. HI absorption has been detected close to the galaxy’s systemic recession velocity with a peak optical depth of and FWHM 400 km s-1(Geréb et al., 2015).
-
•
MACSJ0242.5-2132 contains one of the most radio powerful core sources in the sample presented in Hogan et al. (2015a). The redshift of this source at means that the H I absorption is strongly affected by RFI, so no sensitive observations of this source have yet been attempted.
-
•
Abell 3112 has a strong source at its core in our ALMA continuum image consistent with the position of the published Long Baseline Array observation. However, a second unresolved source is visible to the North-West of the core consistent with a compact, off nuclear source seen in archival HST imaging. The galaxy has an upper limit for H I absorption of , made with the Australia Telescope Compact Array (ATCA) and shown in Hogan (2014).
-
•
Abell 496 is poorly studied, though has an upper limit for H I absorption from the Very Large Array (VLA) presented by Hogan (2014).
- •
-
•
Abell 2415 is poorly studied, though has an as yet unpublished H I absorption detection from the Jansky VLA from 2015 (PI: Edge) with an estimated peak optical depth of .
-
•
Abell 3581 hosts one of the best studied, low redshift and radio loud brightest cluster galaxies, PKS 1404-267 (Johnstone et al., 1998, 2005). The cluster shows evidence of multiple AGN outbursts (Canning et al., 2013) and ALMA observations detect strong CO(2-1) emitting gas filaments (Olivares et al., 2019). Johnstone et al. (1998) present a VLA spectrum showing no significant H I absorption.
-
•
RXCJ1356.0-3421 has X-ray properties consistent with a strong cooling flow. It should therefore have been included in the REFLEX cluster sample that is one of the two primary X-ray samples that make up the parent sample for this study, but was assumed to be AGN dominated (Somboonpanyakul et al., 2018). H I absorption with and a full-width-zero-intensity of 500 km s-1 has been published by (Véron-Cetty et al., 2000), implying that a significant column density of atomic gas is present in this system.
3 Data processing and the origin of the CN-A and CN-B absorption lines
| Line | Rest frequency (GHz) | |
|---|---|---|
| CO(1-0) | 115.271208 | |
| CO(2-1) | 230.538000 | |
| CN-A | 113.49485 | |
| CN-B | 113.16883 | |
| SiO(3-2) | 130.268610 | |
| CN transition | Rest frequency | Relative |
| (GHz) | intensity | |
| 1,3/2,3/2 0,1/2,1/2 | 113.48812 | 0.125 |
| 1,3/2,5/2 0,1/2,3/2 | 113.49097 | 0.333 |
| 1,3/2,1/2 0,1/2,1/2 | 113.49964 | 0.099 |
| 1,3/2,3/2 0,1/2,3/2 | 113.50890 | 0.096 |
| 1,3/2,1/2 0,1/2,3/2 | 113.52043 | 0.012 |
| 1,1/2,1/2 0,1/2,1/2 | 113.12337 | 0.012 |
| 1,1/2,1/2 0,1/2,3/2 | 113.14415 | 0.098 |
| 1,1/2,3/2 0,1/2,1/2 | 113.17049 | 0.096 |
| 1,1/2,3/2 0,1/2,3/2 | 113.19127 | 0.125 |
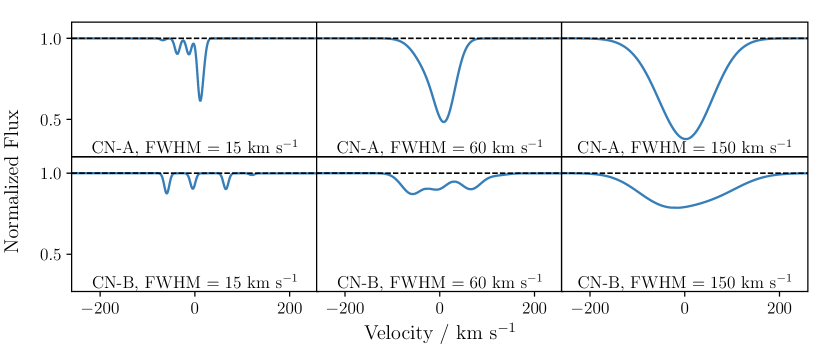
The data presented in this paper were handled using CASA version 5.1.1, a software package which is produced and maintained by the National Radio Astronomy Observatory (NRAO) (McMullin et al., 2007). The calibrated data were produced by the ALMA observatory and following their delivery, where needed we made channel maps at maximal spectral resolution. The self-calibration and continuum subtraction of the images were done as part of the pipeline calibration. When converting the frequencies of the observed CO(1-0) spectra to velocities, we use a rest frequency of GHz. The CN absorption is more complex than that of CO due to its hyperfine structure and the lower spectral resolution with which it was observed. Two lines are seen in CN for each absorption region detected, with relative peak line strengths of approximately 2:1. These two poorly resolved absorption features are themselves composed of a mixture of hyperfine structure lines, details of which are given in Table 3 and Fig. 1. The CN lines covered by our observations are of the N = 0 - 1 transition, which consists of nine hyperfine structure lines split into two distinct groups. The stronger group being J = 3/2 - 1/2 transitions and the weaker group J = 1/2 - 1/2 transitions. Throughout the paper, the label CN-A is used to denote the stronger absorption line, and CN-B to denote the weaker line. We use the intensity weighted mean of the component hyperfine structure lines to calculate the rest frequencies, resulting in GHz and GHz. For the single detection of SiO(2-3), we use a rest frequency of GHz.
We use a range of sources to determine the velocity of the emission and absorption features in each galaxy relative to its recession velocity. The velocities we use for each galaxy and their sources are listed in Table 4.
| Source | Redshift | Recession velocity (km s-1) | Redshift source |
|---|---|---|---|
| Hydra-A | 0.05440.0001 | 1629430 | MUSE |
| S555 | 0.04460.0001 | 1336430 | MUSE |
| Abell 2390 | 0.23040.0001 | 6907430 | VIMOS |
| RXCJ0439.0+0520 | 0.20760.0001 | 6223730 | VIMOS |
| Abell 1644 | 0.04730.0001 | 1419130 | MUSE |
| NGC 5044 | 0.00920.0001 | 276130 | MUSE |
| NGC 6868 | 0.00950.0001 | 283030 | FORS |
| Abell 2597 | 0.08210.0001 | 2461330 | MUSE |
| RXCJ1350.3+0940 | 0.132550.00003 | 3973710 | SDSS |
| MACS1931.8-2634 | 0.352480.00004 | 10567010 | MUSE |
| RXCJ1603.6+1553 | 0.109760.00001 | 329053 | SDSS |
4 Molecular absorption in the cores of eight brightest cluster galaxies
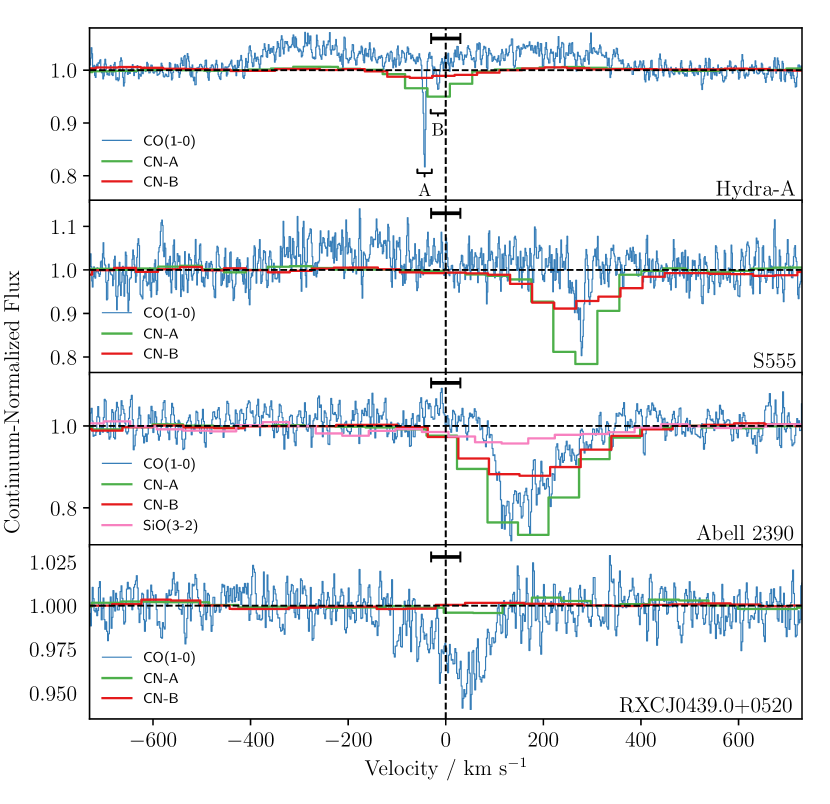
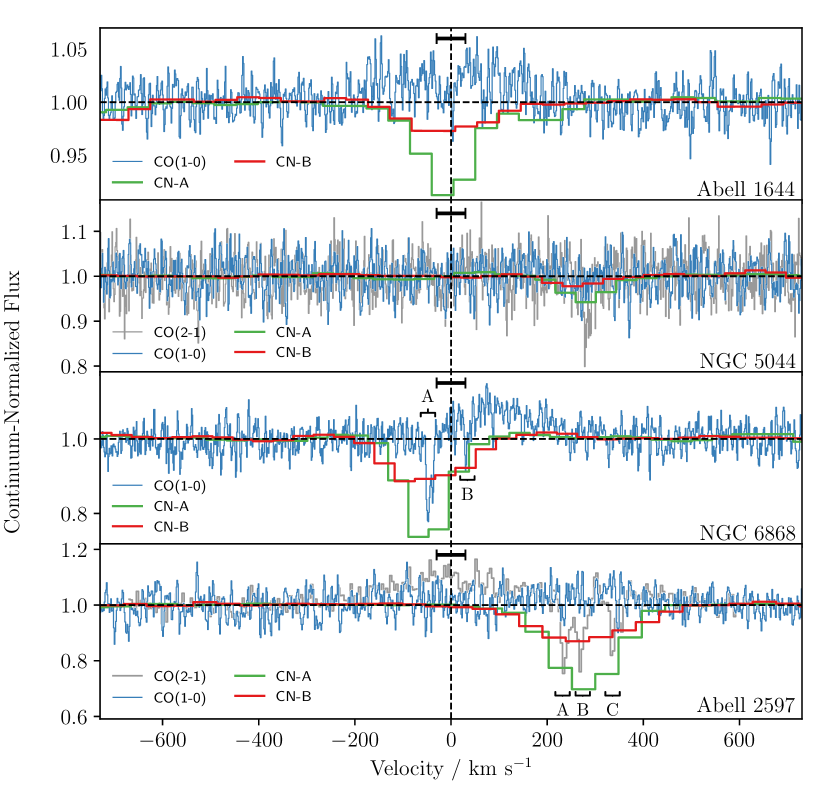
From the sample of 18 brightest cluster galaxies observed, we find evidence of molecular absorption in eight. Their absorption spectra, each extracted from a region centred on the continuum source with a size equal to the synthesized beam’s FHWM, are shown in Fig. 2 and 3. The continuum emission against which we see this absorption is unresolved in all of these sources, and therefore the absorption itself is not spatially resolved.
In Table 5, we show the central velocity, FWHM, amplitude, peak optical depth and velocity integrated optical depth of the emission and absorption features. The values and errors are calculated by performing Monte Carlo simulations which re-simulate the noise seen in each spectrum, along the same lines as described in Rose et al. (2019). To summarise, for each observed spectrum the noise level is estimated from the root mean square (rms) of the continuum source’s emission. This is calculated after excluding the region where the emission is clearly visible. Following this, 10 000 simulated spectra are produced. To make each simulated spectrum, a Gaussian distribution is created for each velocity channel. This distribution is centred at the intensity in the observed spectrum for that particular velocity channel, with a variance equal to the rms noise squared. A value for the intensity is drawn at random from the Gaussian distribution. When this has been done for all velocity channels, a simulated spectrum is produced. For each of the 10 000 simulated spectra, Gaussian lines are fitted to the absorption and emission line features. The values which delimit the 15.865 per cent highest and lowest results for each of the fits give the upper and lower errors, meaning that 68.27 per cent of the fitted parameters will lie within the range.
Below we describe the emission and absorption features seen in each source.
-
•
Hydra-A shows double peaked CO(1-0) emission due to the edge-on orientation of its disk and the large beam size of the observations. Close to the zero velocity point, two CO(0-1) absorption features can be seen, one of which is strong and extremely narrow (, FWHM km s-1). These are also matched by CN-A/CN-B absorption lines. This feature appears stronger still in previous CO(1-2) absorption, where the optical depth peaks at . In order to show the CO(0-1) and CN-A/CN-B absorption more clearly, we do not show the CO(1-2) absorption line of Hydra-A due to its significantly larger optical depth. It can however be found in Rose et al. (2019).
-
•
S555 shows a CO(1-0) emission line, as well as CO(0-1) and CN-A/CN-B absorption lines at large redshifted velocities of km s-1. These high velocities imply significant line of sight motion towards the mm-continuum source. The combined integrated optical depth of the CN-A/CN-B absorption lines is around 20 times larger than that of CO(0-1), implying a low molecular ratio of CO/CN.
-
•
Abell 2390 has no visible CO(1-0) emission, but does show CO(0-1), CN-A/CN-B and SiO(2-3) absorption lines. All of these lines are wide, slightly skewed Gaussians centred at a velocity of km s-1. Despite its large FWHM, the absorption feature has a sharp onset in the high spectral resolution CO(1-0) spectrum.
-
•
J0439+05 has no CO(1-0) emission, though a wide CO(0-1) absorption feature (FWHM km s-1) is present close to the zero velocity point, which is unique among the sample in that there are no corresponding CN-A/CN-B lines.
-
•
Abell 1644 has a broad CO(1-0) emission region, but no statistically significant CO(0-1) absorption. However, strong CN-A/CN-B absorption is present at the centre of the CO(1-0) emission.
-
•
NGC 5044, which was previously found to have redshifted CO(1-2) absorption at km s-1 (David et al., 2014), has corresponding CN-A/CN-B lines with a total of around four times the velocity integrated optical depth. However, perhaps due to the realtively high noise level, there is no statistically significant CO(0-1) absorption feature. Likewise, there is no clear CO(1-0) emission.
-
•
NGC 6868 has the narrowest CO(1-0) emission feature of the sample (FWHM = 207 km s-1), though it is consistent with the range of line widths found in single dish studies (Edge, 2001; Salomé & Combes, 2003). At the blueshifted edge of this emission there are two narrow CO(0-1) absorption features. CN absorption centred on the stronger, more blueshifted of the two CO(0-1) absorption features is also present. As with the other sources, its CN-A/CN-B absorption has a much larger velocity integrated optical depth than that of the CO(0-1). By this measure, the two CN absorption lines are around 10 times stronger than those of CO(0-1).
-
•
Abell 2597 has previously been shown to have CO(2-1) emission whose central velocity matches that of the galaxy’s stellar recession velocity. There are also three narrow absorption features at velocities of between 240 and 335 km s-1 (Tremblay et al., 2016). These absorption features are also detected at low resolution in CN-A/CN-B, but not in CO(0-1). A weak CO(1-0) emission line is present in the spectrum. However, this is centred at approximately the same velocity as the CO(1-2) and CN-A/CN-B absorption features, rather than close to the systemic velocity where the CO(2-1) emission is seen. This velocity difference between the weak but broad CO(1-0) emission and stronger CO(2-1) emission indicates that the warmer gas, which likely lies closer to the core, traces gas with different dynamics compared with the colder gas traced by the CO(1-0).
In many cases, it should be noted that our calculations of the optical depths are simply lower limits. This is due to the difficulty of establishing to what extent emission is compensating for absorption in some spectra. For example, in Abell 2390 there are hints of emission either side of the absorption region, which could reduce the level of absorption we infer. Where the emission is clearer, such as in NGC 6868 and Abell 1644222In the case of Abell 1644, the tentative absorption feature at km s-1 is of less than 3 significance., we can compensate for it. This is done by fitting and subtracting a Gaussian line to the CO(1-0) emission after excluding the velocity channels in which the absorption regions lie. For the CN-A/CN-B lines, this effect is unlikely to have an impact because it is only expected to be present very weakly in emission (Wilson, 2018).
5 Sources with emission which lack absorption lines
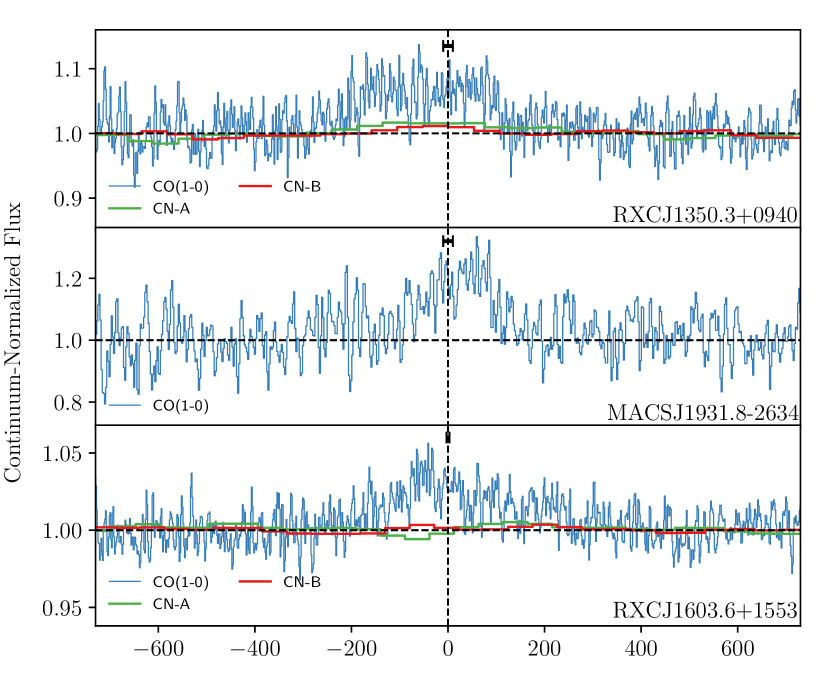
As well as the eight brightest cluster galaxies which have evidence of CO(0-1) and/or CN-A/CN-B absorption lines there are three systems which have clear emission, but no absorption features. The spectra of these sources are shown in Fig. 4 and the best fit parameters for the absorption features are given in the lower section of Table 5. These spectra are once again extracted from a region which is centered on each object’s continuum source and with a size equal to the synthesized beam’s FHWM. This is the smallest region from which the spectra can feasibly be extracted and it therefore maximises the strength of any tentative absorption features which may be present.
The three sources which show CO(1-0) emission but lack any absorption features are:
-
•
RXCJ1350.3+0940, which also shows clear emission from the CN-A and CN-B lines.
-
•
MACSJ1931.8-2634, which is also known to show extended CO(3-2) and CO(4-3) emission (Fogarty et al., 2019).
-
•
RXCJ1603.6+1553, in which H I absorption has been detected close to the systemic recession velocity of the galaxy with a peak optical depth of and FWHM = km s-1.
6 Sources without emission and absorption lines
As well as the detections shown in Fig. 2, 3 and 4, a large number of the sources observed in our ALMA survey show no clear evidence of emission, or of absorption along the line of sight to their continuum source. The details of their observations are given in Table 7 of Appendix A. We do not show the spectra of these sources, though their observations, including all continuum images, are publicly available via the ALMA Science Archive from September 20 2019.
In total there are seven sources observed for which we see no evidence of molecular gas along the line of sight to their bright radio cores from emission or absorption, all of which are listed below.
-
•
MACSJ0242.5-2132
-
•
Abell 3112
-
•
Abell 496
-
•
RXCJ0132.6-0804
-
•
Abell 2415
-
•
Abell 3581
-
•
RXCJ1356.0-3421
Additionally, none of the galaxies listed above have CO(1-0) emission which is visible on larger galaxy-wide scales, with the exception of RXCJ0132.6-0804. The extended CO(1-0) emission seen in this system follows the morphology previously found with optical emission lines (Hamer et al., 2016).
In systems such as those observed in our ALMA survey, the line of sight covering fraction of molecular gas is expected to be less than its maximum physical value of 1. In other words, molecular gas is not expected to exist along all lines of sight to the galaxies’ bright radio cores. Therefore, the lack of absorption lines in the systems listed above does not necessarily mean that significant masses of cold molecular gas are absent. Overall, the eight absorbing systems we find from the sample of 18 observed implies a line of sight covering fraction in line with expectations and is similar to that predicted by accretion simulations, such as those by Gaspari et al. (2018).
However, sources which have both CO(1-0) and CO(2-1) observations (Hydra-A, NGC 5044 and Abell 2597) all show the higher energy CO(2-1) line to be significantly stronger in both emission and absorption. It is therefore likely that our 8/18 detection rate is only indicating the covering fraction of particularly cool molecular gas at a up to few tens of Kelvin. Above K, the fraction of CO molecules occupying the ground state energy level is negligible, and so CO(0-1) absorption from this line is no longer seen. Large proportions of the molecular gas in the cores of these galaxies is likely to exist at higher temperatures not traced well by CO(0-1), as shown by Hydra-A, NGC 5044 and Abell 2597. Therefore, the total covering fraction of molecular gas is likely to be higher than indicated by the CO(1-0) and CN-A/CN-B333Although our CN observations appear 10 times stronger than those of CO(0-1), they are likely to lack sufficient spectral resolution to reveal all but the widest and strongest absorption lines. observations alone.
| Source | Region | (km s-1) | FWHM (km s-1) | Amplitude (mJy) | (km s-1) | |
| Hydra-A | CO(1-0) emission | 235 | 3.6 | - | - | |
| CO(1-0) emission | 158 | 346 | 2.98 | - | - | |
| CO(0-1) absorption ‘A’ | ||||||
| CO(0-1) absorption ‘B’ | -16 | 9 | -4.2 | 0.5 | ||
| CN-A absorption | -22 | 102 | -4.2 | 0.052 | 5.6 | |
| CN-B absorption | -32 | 157 | -1.2 | 0.015 | 2.5 | |
| S555 | CO(1-0) emission | -186 | 260 | 0.65 | - | - |
| CO(0-1) absorption | 276 | 17 | -1.8 | 0.16 | ||
| CN-A absorption | 270 | 113 | -2.9 | 0.26 | 29.6 | |
| CN-B absorption | 265 | 210 | -1.09 | 0.089 | 19.6 | |
| Abell 2390 | CO(0-1) absorption | 164 | 122 | -1.55 | 0.22 | 28.2 |
| CN-A absorption | 167 | 200 | -2.09 | 0.31 | 63.5 | |
| CN-B absorption | 171 | 251 | -1.00 | 0.137 | 36.0 | |
| SiO(2-3) absorption | 120 | 400 | -0.28 | 0.037 | 15 | |
| RXCJ0439.0+0520 | CO(0-1) absorption | 35 | 126 | -2.9 | 0.041 | 5.4 |
| Abell 1644 | CO(1-0) emission | 0 | 308 | 0.85 | - | - |
| CN-A absorption | -6 | 120 | -3.6 | 0.089 | 11.2 | |
| CN-B absorption | -11 | 170 | -1.09 | 0.026 | 4.7 | |
| NGC 5044 | CO(1-2) absorption | 283 | 14 | -2.6 | 0.14 | 2.2 |
| CN-A absorption | 280 | 101 | -0.85 | 0.06 | 6.4 | |
| CN-B absorption | 258 | 103 | -0.34 | 0.024 | 2.6 | |
| NGC 6868 | CO(1-0) emission | 93 | 207 | 1.09 | - | - |
| CO(0-1) absorption ‘A’ | -45 | 15 | -3.0 | 0.24 | 3.8 | |
| CO(0-1) absorption ‘B’ | 32 | 10 | -1.6 | 0.12 | 1.2 | |
| CN-A absorption | -50 | 101 | -4.09 | 0.3 | 34.4 | |
| CN-B absorption | -52 | 168 | -1.73 | 0.12 | 22.7 | |
| Abell 2597 | CO(1-0) emission | 233 | 400 | 0.24 | - | - |
| CO(2-1) emission | -5 | 330 | 0.89 | - | - | |
| CO(1-2) absorption ‘A’ | 237 | 17 | -2.4 | 0.29 | 4.9 | |
| CO(1-2) absorption ‘B’ | 269 | 21 | -1.9 | 0.23 | 4.8 | |
| CO(1-2) absorption ‘C’ | 336 | 8 | -2.1 | 0.24 | 2.2 | |
| CN-A absorption | 279 | 156 | -2.40 | 0.36 | 57 | |
| CN-B absorption | 273 | 234 | -1.03 | 0.141 | 34 | |
| RXCJ1350.3+0940 | CO(1-0) emission | -50 | 318 | 0.77 | - | - |
| CN-A emission | -14 | 310 | 0.19 | - | - | |
| CN-B emission | -30 | 160 | 0.14 | - | - | |
| MACSJ1931.8-2634 | CO(1-0) emission | 24 | 176 | 0.66 | - | - |
| RXCJ1603.6+1553 | CO(1-0) emission | -50 | 318 | 1.49 | - | - |
7 Column Density Estimates
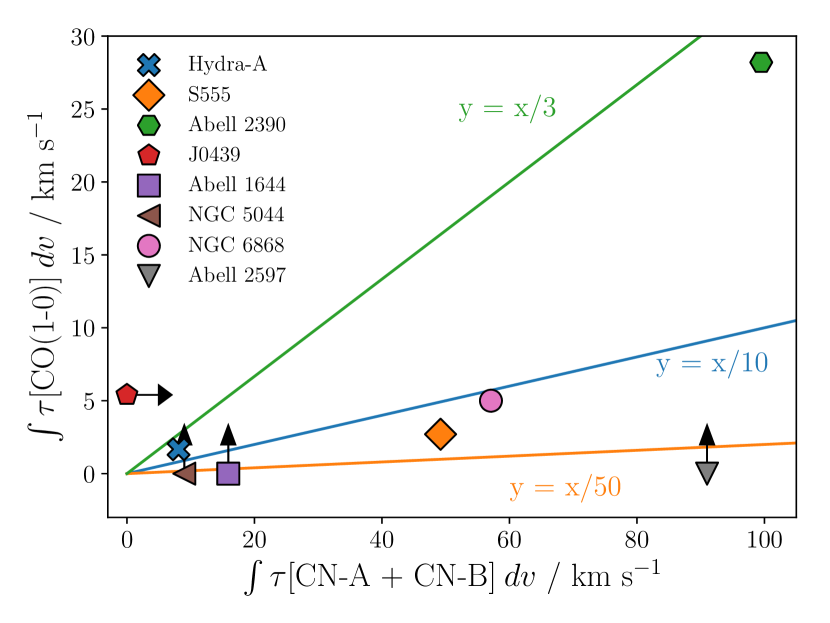
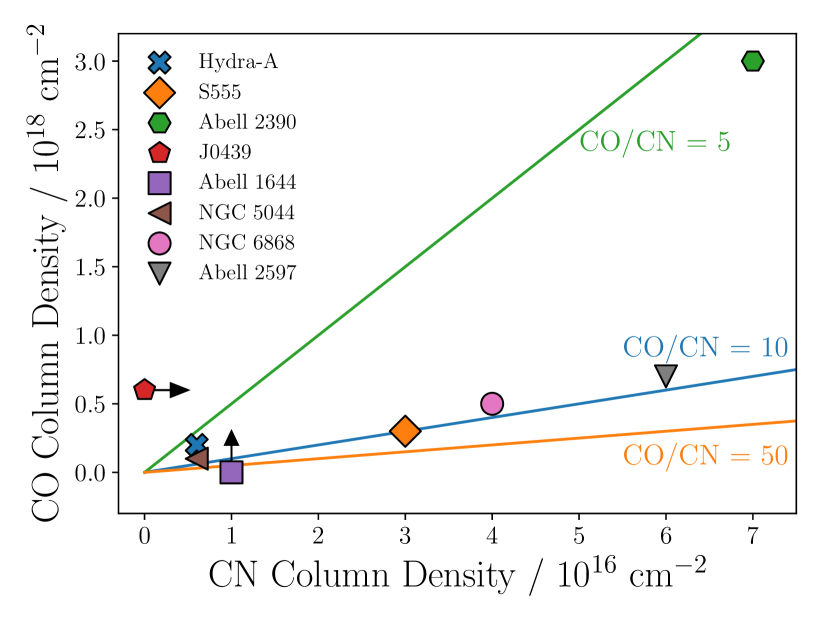
Fig. 5 shows the relationship between the velocity integrated optical depths of the CO(0-1) and CN-A/CN-B lines for the eight sources in which they are detected. In the majority of cases the sum of the CN-A and CN-B absorption, i.e. the combination of all CN N = 0 - 1 hyperfine structure lines, is 10 times as strong as that of CO(0-1). Using an estimated excitation temperature and treating the absorption as optically thin, it is possible to calculate the total column density, , of the absorption regions, and therefore estimate the CO/CN ratio of the absorbing gas. In general,
| (1) |
where () is the partition function, is the speed of light, is the Einstein coefficient of the observed transition and the level degeneracy, with the subscripts and representing the upper and lower levels (Godard et al., 2010; Mangum & Shirley, 2015).
The values from this calculation are given in Table 6 and shown in Fig. 6. The CO/CN ratio we find for sources with both CO and CN absorption ranges from 9 to 44. This is similar to the values found by Wilson (2018) for nearby galaxies from ALMA observations of CO and CN emission, meaning that the gas we are seeing through absorption has typical ratios of CO/CN.
| Source | Temperature (K) | CO column density (cm-2) | CN column density (cm-2) | CO/CN ratio |
|---|---|---|---|---|
| Hydra-A | 20 | 5 | 2 | 32 |
| 40 | 2 | 6 | 32 | |
| 80 | 7 | 2 | 32 | |
| S555 | 20 | 8 | 9 | 9 |
| 40 | 3 | 3 | 9 | |
| 80 | 1 | 1 | 9 | |
| Abell 2390 | 20 | 8 | 2 | 44 |
| 40 | 3 | 7 | 44 | |
| 80 | 1 | 3 | 44 | |
| J0439+05 | 20 | 2 | - | - |
| 40 | 6 | - | - | |
| 80 | 2 | - | - | |
| Abell 1644 | 20 | - | 3 | - |
| 40 | - | 1 | - | |
| 80 | - | 4 | - | |
| NGC 5044* | 20 | 4 | 2 | 22 |
| 40 | 1 | 6 | 20 | |
| 80 | 5 | 2 | 20 | |
| NGC 6868 | 20 | 1 | 1 | 14 |
| 40 | 5 | 4 | 14 | |
| 80 | 2 | 1 | 14 | |
| Abell 2597* | 20 | 2 | 2 | 12 |
| 40 | 7 | 6 | 11 | |
| 80 | 2 | 2 | 10 |
*For NGC 5044 and Abell 2597, where the are no detections of CO(0-1) absorption, we use the archival CO(1-2) absorption to estimate the CO column density.
Repeat observations of CN at high spectral resolution would be required to fully understand the relationship between CN and CO. Additionally, in the three cases where there are both CO(1-0) and CO(2-1) observations, the latter show stronger and clearer absorption lines. A survey of CO(2-1) is therefore vital in order to show the CO gas in more detail.
8 Discussion
Following the works of David et al. (2014); Tremblay et al. (2016); Ruffa et al. (2019); Rose et al. (2019), the eight detections of molecular absorption we present significantly increases the number of brightest cluster galaxies in which cold, molecular gas has been observed in absorption against the host galaxy’s bright radio core. These detections are made through CO absorption and emission lines, as well as previously undetected CN lines. In seven out of eight cases where there is a CO(0-1) detection there is also CN-A/CN-B, with the exception being RXCJ0439.0+0520. Conversely, one source, NGC 5044 shows clear CN-A/CN-B absorption, but no CO(0-1) absorption despite having been previously detected in CO(1-2) by David et al. (2014). A weak CN line has previously been observed in the intervening absorber G0248+430 (Combes et al., 2019) and was one of many lines detected in the nearby galaxy Centarus-A (Eckart et al., 1990; McCoy et al., 2017). However, these detections are notable due to their rarity, with CN absorption lines being much less commonly observed than those of CO. Further, the line has never previously been detected in absorption against a brightest cluster galaxy’s bright continuum source, making our seven detections especially noteworthy.
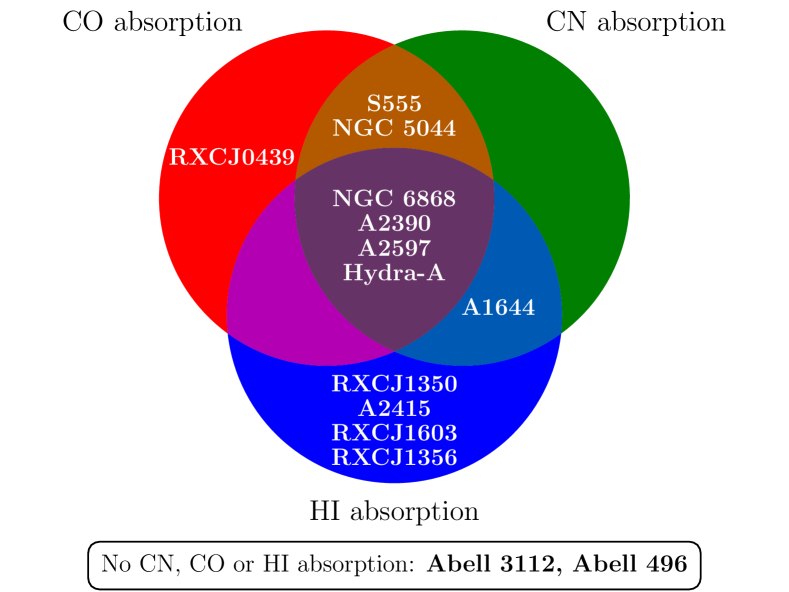
Fig. 7 shows a Venn diagram highlighting the detections of CO, CN and H I which have been made for sources with a complete set of observations for these lines. This emphasises the wide range in the absorption properties of these systems and implies that surveys searching for many different molecular absorption lines are justifiable, even in cases which have previous non-detections of H I and CO absorption.
8.1 Potential fuelling of supermassive black holes
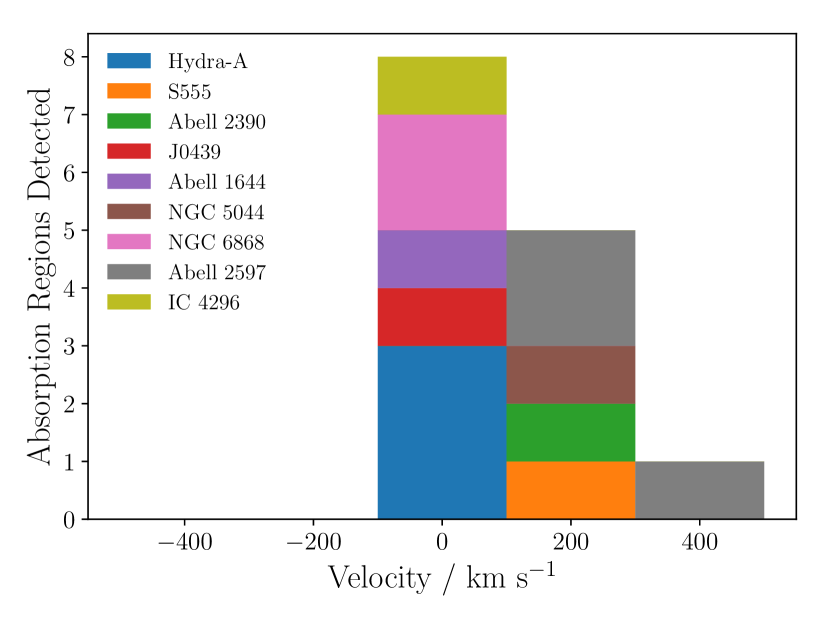
In many cases, there is clear evidence of cold molecular gas moving towards its host galaxy’s mm-continuum source at significant velocities. S555, NGC 5044 and Abell 2597 all have absorption regions with velocities towards the core of km s-1. Abell 2390 also has redshifted absorbing gas, albeit moving lower velocities. However, in this case the large width of the absorption implies that there is likely to be a systemic motion towards the core. Hydra-A, J0439+05, Abell 1644 and NGC 6868 all have molecular gas moving at lower blue and redshifted velocities, implying that the clouds are drifting in non-circular orbits and not experiencing any significant inflow or outflow. Overall our eight detections, combined with those of NGC 5044 (David et al., 2014), Abell 2597 (Tremblay et al., 2016), Hydra-A (Rose et al., 2019) and IC 4296 (Ruffa et al., 2019) do not present any evidence of significantly blueshifted absorption. Though there are some moderately blueshifted regions of molecular gas, overall there is a bias for motion towards the galaxies’ supermassive black holes, as shown by Fig. 8. In the chaotic cold accretion scenario, most clouds are expected to drift in the large-scale turbulent field (with low ), while only a few outliers are found to reach velocities of several 100 km s-1 (see Gaspari et al., 2018), which is consistent with our findings here. Nevertheless, the number of detections these conclusions are based upon remains small.
8.2 Constraining the location of the absorbing clouds
It is physically plausible that the absorbing clouds detected in these systems lie anywhere from a few tens of parsecs from the central supermassive black hole, to several kilo parsecs away. Indeed, many of the galaxies in our sample have molecular gas seen in emission out to several kpc, most notably Hydra-A where we see an edge-on gas disc with a diameter of 5 kpc. However, the covering fraction of molecular gas as a function of radius significantly constrains the distance at which the gas is likely to be, as predicted by simulations such as chaotic cold accretion (Gaspari et al., 2017). These simulations of clumpy molecular gas condensation show that the volume filling factor and internal density of molecular clouds are both inversely proportional to radius. This means that the vast majority of dense clouds which contribute to the line of sight absorption are expected to reside in the inner region, within radii of up to pc (for a broader comparison of our results to chaotic cold accretion simulations, see §8.3). Conversely, two properties of the absorbing clouds imply that they lie outside the approximate Bondi capture radius in each system of a few tens of parsecs. First, the fact that the clouds are detectable by CO(0-1) absorption implies that they are all relatively cool and not being significantly heated by the high radiative power of the central AGN. Given that dust grains are found with ubiquity in interstellar gas, the approximate level of heating a molecular gas cloud will experience can be demonstrated by providing an estimate for the equilibrium dust temperature. For a dust grain radiating with a black-body spectrum, the balance between radiation and emission can be written as
| (2) |
where is the flux of the radiation field, is the Planck average emissivity, is the Stefan-Boltzmann constant and is the equilibrium temperature. Alternatively,
| (3) |
where the radiation field is assumed to be from a point source of luminosity at a distance . The AGN of brightest cluster galaxies such as those in our survey have typical luminosities of , though at the higher end these are dominated by radiatively powerful AGN (see Russell et al., 2013). For a dust grain at a distance of 10 pc from a point source, the equilibrium temperature is therefore 100 K, assuming a Q value of 0.1 (an approximate value from Draine & Lee, 1984). The existence of cold molecular gas clouds inside these distances, such as those detected in our survey, is therefore unlikely.
A second property of the absorbing clouds which implies that they lie outside the Bondi capture radius of pc is their velocities. Within these distances they would be expected to obtain highly redshifted velocities, perhaps of thousands of km s-1, due to the gravitational influence of the central supermassive black hole. For example, in Abell 2390 which has a supermassive black hole (Tremblay et al., 2012), a circular orbit at 10 pc requires a velocity of 400 km s-1, something difficult to maintain in such a turbulent environment.
8.3 Comparison with Chaotic Cold Accretion Simulations
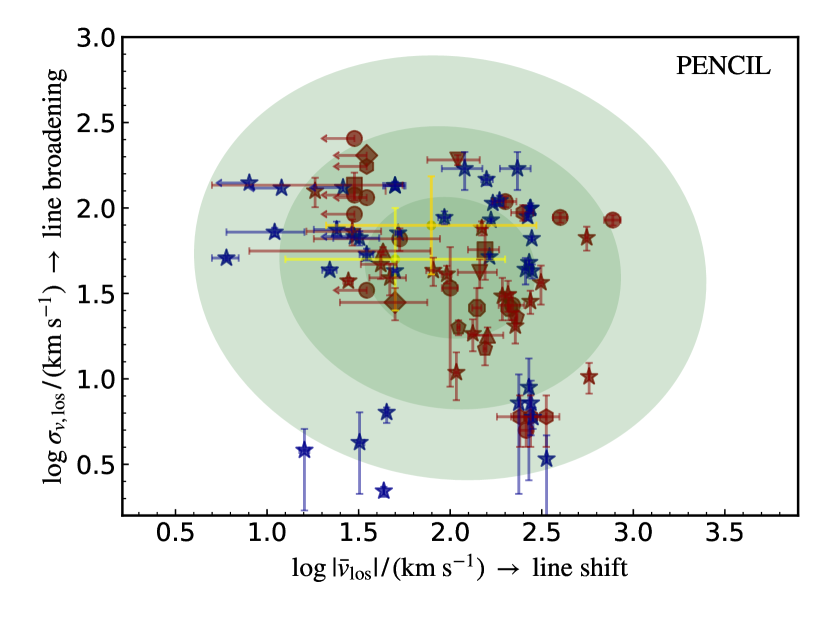
More quantitatively, we have followed the same procedure as described in §4 of Gaspari et al. (2018) to compute the pencil-beam points in the main diagnostic plot of versus along the line of sight to the galaxy centre. As shown in Fig. 9, the distribution of blue points (our ALMA detections in Table 5) is consistent with that of CO and HI clouds in other galaxies (red and yellow; see Gaspari et al., 2018), as well as with the simulated 1-3 contours predicted by chaotic cold accretion simulations. Regarding bulk motions, the log mean and dispersion for our points is , which is comparable to that of the points observed in Gaspari et al. (2018) simulations with . In terms of the turbulence, the log mean and dispersion for our points is , which is analogous to that of the points observed in Gaspari et al. (2018) simulations. It is important to note the two different classes of clouds the pencil-beam line of sight can intersect: the high-velocity single cloud (bottom) and the associations of multiple clouds that drift in the macro turbulent atmosphere (top). Interestingly, we are increasingly populating the bottom quadrants, owing to the high angular resolution of ALMA. In future work we aim to enlarge the sample of detections to further constrain this key relationship between line broadening and velocity shift.
8.4 Differences between the CO(1-0), CO(2-1) and CN-A/CN-B observations
The significant differences which are seen between the strengths of the CO(1-2) absorption line detections and the lower energy CO(0-1) and CN-A/CN-B lines of NGC 5044 and Abell 2597 have a number of possible explanations. First, the CO(1-2) absorption is enhanced by a factor of three due to its statistical weight. Second, due to the time difference between the observations of CO(2-1) and CO(1-0)/CN-A/CN-B, the clouds may have moved across the line of sight to the bright radio core. The time difference between the observations is approximately 5 years in the case of NGC 5044 and 6 years for Abell 2597, whereas individual clouds are expected to take at least hundreds of years to cross the line of sight; a relatively small molecular cloud with a diameter of 0.1 pc and a large transverse velocity of 500 km s-1 will take 200 years to fully cross the line of sight, assuming a point-like continuum source. A third explanation is that due to the energy difference of the lines, molecular gas regions of different temperatures are being revealed by the different lines. The CO(1-2) absorption line will trace higher temperature gas than the CO(0-1) and CN-A/CN-B lines due to its higher excitation energy. Therefore, if there are multiple regions of molecular gas of significantly different temperatures along the line of sight, the lower and higher energy lines may reveal different absorption features. However, in the case of NGC 5044, absorption is detected in the low energy CN-A/CN-B lines, but not the similarly low energy CO(0-1) line. The same absorption region is nevertheless detected in the higher energy CO(1-2) line, suggesting that whether or not absorption is present is dependent on more than just the gas temperature alone. A further factor which is likely to play a large role in affecting the strength of the absorbing regions across different lines is the molecular number ratio of CO/CN. In the case of NGC 5044, the absorption may be due to relatively warm gas with a low CO/CN ratio, resulting in modest CO(1-2) and CN-A/CN-B absorption, but no clear CO(0-1) line.
8.5 Future observations
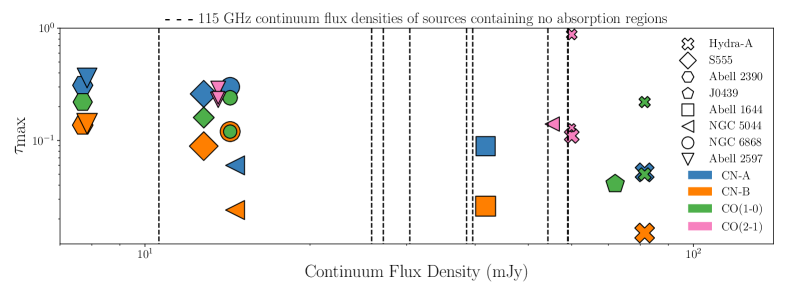
In Fig. 10 we show the relation between the continuum flux density of the sources observed in this survey and the peak optical depth of the absorption regions detected. This shows no obvious correlation between the continuum flux density of the sources and the number or strength of the absorption regions detected. There is also no clear cut-off as a result of potential detection limits for absorption regions in sources with low continuum flux densities. One possible exception to this is that the narrowest lines (which have the smallest markers in Fig. 10) are only seen in higher flux density systems, though only a small number of these are detected. Additionally, the systems in which we find no absorption regions, as indicated by the dashed vertical lines) have no tendency for having low flux density continuum sources. We are therefore unlikely to have met a low brightness detection limit, implying that searches for molecular absorption in lower flux density sources are justified.
ALMA Cycle 6 observations of Hydra-A, which include high spectral resolution CN N = 2 - 1 observations, show that the molecular ratio of CO/CN is a factor which can vary significantly between different absorption regions of the same system. Absorption regions ‘A’ and ‘B’ (see Fig. 3) are of a similar strength in CN N = 2 - 1, despite the large difference seen in both the CO(0-1) observations and previous CO(1-2) observations (Rose et al., 2019). This implies that there is a large disparity between the CO/CN ratio across these two absorption regions and that the composite gas clouds have very different histories e.g. the CO/CN molecular number ratio can be changed if the molecular gas is present in starburst regions. These observations of Hydra-A will be presented in Rose et al. (in preparation). Detections of several other molecular species in absorption which will also be shown in Rose et al. (in preparation) also indicate that molecular line survey strategies such as those used to observe Arp 220 by Martín et al. (2011) may reap significant rewards. This includes a significant increase in our understanding of the chemical and physical properties of the molecular gas in the cores of brightest cluster galaxies as well as its origins.
9 Conclusions
We have presented an ALMA survey of 18 brightest cluster galaxies which lie in cool cores and have extremely bright mm-continuum sources at their centres. We find molecular absorption in eight of this sample via the detections of seven CO(0-1) absorption lines, seven CN N = 1 - 0 lines and one SiO(2-3) line, shown in Fig. 2 and 3.
Our survey doubles the number of systems in which molecular absorption has been observed against a brightest cluster galaxy’s bright continuum source from five to ten and provides new molecular absorption lines for two of those systems previously discovered.
The absorption regions we detect have velocities of between -45 to 283 km s-1 relative to the systemic recession velocity of the galaxies and overall there is a bias for motion towards the supermassive black holes, though this is found from what is still a relatively small number of sources. Our results appear to be consistent with the chaotic cold accretion scenario of Gaspari et al. (2018). This includes the detection of drifting and infalling clouds with a covering fraction of < 1 and the statistical line broadening/shift properties of the pencil-beam diagram (Fig. 9).
Given that we find eight absorbing systems from the observed sample of 18, it is highly unlikely that a detection rate this high could be produced by absorption at large distances. Instead, we have most likely found cases of absorption due to molecular gas at distances within which they could feasibly be accreted onto the supermassive black hole under the right conditions. At these distances of up to a few hundred parsecs, slightly elliptical orbits would be expected to produce offsets of just a few tens of km s-1, rather than the hundreds of km s-1 we see in some of our observations i.e. these large velocities relative to the galaxies’ recession velocities are not due to orientation effects.
We find that CN is a significantly stronger tracer of molecular absorption than CO due to the molecule’s higher electric dipole moment. From the eight sources which have detections of both lines, the velocity integrated optical depths are 10 times higher for CN. This implies a typical molecular number ratio of CO/CN 10.
The CO(1-2) line also appears to be a more efficient tracer of molecular absorption than the lower energy CO(0-1) line. Observations of both lines now exist for three sources: Hydra-A, Abell 2597 and NGC 5044. In all cases, the absorption features appear significantly deeper and clearer in the higher energy line.
With the additions of our survey, a complete set of CO, CN and H I observations now exists for 14 sources (Fig. 7). From these, many different combinations of absorption lines are detected. For four sources, all three lines are detected while for a further four only H I absorption is seen. Two show both CO and CN absorption but not that of H I . One source shows only CO absorption while another shows both CN and H I absorption but not that of CO. For two sources, none of the three absorption lines are seen. In relation to future surveys, these results imply that non-detections of a particular absorption line do not rule out subsequent detections of other lines.
Acknowledgements
The authors gratefully acknowledge the anonymous referee for their comments, which helped us to improve the paper.
We thank Tom Oosterloo for generously providing the H I detection of NGC 6868.
T.R. is supported by the Science and Technology Facilities Council (STFC) through grant ST/R504725/1.
A.C.E. acknowledges support from STFC grant ST/P00541/1.
M.G. is supported by the Lyman Spitzer Jr. Fellowship (Princeton University) and by NASA Chandra grants GO7-18121X and GO8-19104X.
S.B. and C.O. are grateful for support from the Natural Sciences and Engineering Research Council of Canada.
G.R.T. acknowledges support from the National Aeronautics and Space Administration (NASA) through Chandra Award Number GO7-8128X8, issued by the Chandra X-ray Center, which is operated by the Smithsonian Astrophysical Observatory for and on behalf of NASA under contract NAS8-03060.
This paper makes use of the following ALMA data: ADS/JAO.ALMA#2017.1.00629.S. ALMA is a partnership of ESO (representing its member states), NSF (USA) and NINS (Japan), together with NRC (Canada), NSC and ASIAA (Taiwan), and KASI (Republic of Korea), in cooperation with the Republic of Chile. The Joint ALMA Observatory is operated by ESO, AUI/NRAO and NAOJ. We aslo use archival data: ADS/JAO.ALMA#2016.1.00533.S of NGC 5044 and of Abell 2597.
References
- Abolfathi et al. (2018) Abolfathi B., et al., 2018, ApJS, 235, 42
- Allen et al. (2001) Allen S., Ettori S., Fabian A., 2001, MNRAS, 324, 877
- Allen et al. (2004) Allen S. W., Schmidt R. W., Ebeling H., Fabian A. C., van Speybroeck L., 2004, MNRAS, 353, 457
- Allen et al. (2008) Allen S. W., Rapetti D. A., Schmidt R. W., Ebeling H., Morris R. G., Fabian A. C., 2008, MNRAS, 383, 879
- Boger & Sternberg (2005) Boger G. I., Sternberg A., 2005, ApJ, 632, 302
- Bohringer et al. (2002) Bohringer H., et al., 2002, ApJ, 566, 93
- Böhringer et al. (2004) Böhringer H., et al., 2004, A&A, 425, 367
- Buote et al. (2004) Buote D. A., Brighenti F., Mathews W. G., 2004, ApJ, 607, L91
- Canning et al. (2013) Canning R. E. A., et al., 2013, MNRAS, 435, 1108
- Combes (2008) Combes F., 2008, Astrophys. Space Sci., 313, 321
- Combes et al. (2019) Combes Gupta, N. Jozsa, G. I. G. Momjian, E. 2019, A&A, 623, A133
- Crawford et al. (1999) Crawford C. S., Allen S. W., Ebeling H., Edge A. C., Fabian A. C., 1999, MNRAS, 306, 857
- David et al. (2011) David L. P., et al., 2011, ApJ, 728, 162
- David et al. (2014) David L. P., et al., 2014, ApJ, 792, 94
- Donahue et al. (2011) Donahue M., de Messières G. E., O’Connell R. W., Voit G. M., Hoffer A., McNamara B. R., Nulsen P. E. J., 2011, ApJ, 732, 40
- Draine & Lee (1984) Draine B. T., Lee H. M., 1984, ApJ, 285, 89
- Dutson et al. (2013) Dutson K. L., White R. J., Edge A. C., Hinton J. A., Hogan M. T., 2013, MNRAS, 429, 2069
- Ebeling et al. (1996) Ebeling H., Voges W., Bohringer H., Edge A. C., Huchra J. P., Briel U. G., 1996, MNRAS, 281, 799
- Eckart et al. (1990) Eckart A., Cameron M., Genzel R., Jackson J. M., Rothermel H., Stutzki J., Rydbeck G., Wiklind T., 1990, ApJ, 365, 522
- Edge (2001) Edge A. C., 2001, MNRAS, 328, 762
- Edge et al. (1999) Edge A. C., Ivison R. J., Smail I., Blain A. W., Kneib J.-P., 1999, MNRAS, 306, 599
- Edge et al. (2002) Edge A. C., Wilman R. J., Johnstone R. M., Crawford C. S., Fabian A. C., Allen S. W., 2002, MNRAS, 337, 49
- Ehlert et al. (2011) Ehlert S., et al., 2011, MNRAS, 411, 1641
- Fogarty et al. (2019) Fogarty K., et al., 2019, arXiv e-prints, p. arXiv:1905.01377
- Gaspari et al. (2011) Gaspari M., Melioli C., Brighenti F., D’Ercole A., 2011, MNRAS, 411, 349
- Gaspari et al. (2015) Gaspari M., Brighenti F., Temi P., 2015, A&A, 579, A62
- Gaspari et al. (2017) Gaspari M., Temi P., Brighenti F., 2017, MNRAS, 466, 677
- Gaspari et al. (2018) Gaspari M., et al., 2018, ApJ, 854, 167
- Gastaldello et al. (2013) Gastaldello F., et al., 2013, ApJ, 770, 56
- Geréb et al. (2015) Geréb K., Maccagni, F. M. Morganti, R. Oosterloo, T. A. 2015, A&A, 575, A44
- Godard et al. (2010) Godard B., Falgarone E., Gerin M., Hily-Blant P., de Luca M., 2010, A&A, 520, A20
- Green et al. (2016) Green T. S., et al., 2016, MNRAS, 461, 560
- Green et al. (2017) Green T. S., et al., 2017, MNRAS, 465, 4872
- Hamer (2012) Hamer S. L., 2012, http://etheses.dur.ac.uk/5888/
- Hamer et al. (2014) Hamer S. L., et al., 2014, MNRAS, 437, 862
- Hamer et al. (2016) Hamer S. L., et al., 2016, MNRAS, 460, 1758
- Hogan (2014) Hogan M., 2014, http://etheses.dur.ac.uk/11008/1/hogan_thesis.pdf?DDD25+
- Hogan et al. (2015a) Hogan M. T., et al., 2015a, MNRAS, 453, 1201
- Hogan et al. (2015b) Hogan M. T., et al., 2015b, MNRAS, 453, 1223
- Jaffe et al. (2005) Jaffe W., Bremer M. N., Baker K., 2005, MNRAS, 360, 748
- Johnson et al. (2010) Johnson R. E., Markevitch M., Wegner G. A., Jones C., Forman W. R., 2010, ApJ, 710, 1776
- Johnstone et al. (1998) Johnstone R. M., Fabian A. C., Taylor G. B., 1998, MNRAS, 298, 854
- Johnstone et al. (2005) Johnstone R. M., Fabian A. C., Morris R. G., Taylor G. B., 2005, MNRAS, 356, 237
- Le Borgne et al. (1991) Le Borgne J.-F., Mathez G., Mellier Y., Pello R., Sanahuja B., Soucail G., 1991, A&AS, 88, 133
- Mangum & Shirley (2015) Mangum J. G., Shirley Y. L., 2015, PASP, 127, 266
- Martín et al. (2011) Martín et al., 2011, A&A, 527, A36
- Massaro et al. (2009) Massaro E., Giommi P., Leto C., Marchegiani P., Maselli A., Perri M., Piranomonte S., Sclavi S., 2009, A&A, 495, 691
- McCoy et al. (2017) McCoy M., et al., 2017, ApJ, 851, 76
- McMullin et al. (2007) McMullin J. P., Waters B., Schiebel D., Young W., Golap K., 2007, in Shaw R. A., Hill F., Bell D. J., eds, Astronomical Society of the Pacific Conference Series Vol. 376, Astronomical Data Analysis Software and Systems XVI. p. 127
- McNamara & Nulsen (2012) McNamara B. R., Nulsen P. E. J., 2012, New J. Phys., 14, 055023
- McNamara et al. (2000) McNamara B. R., et al., 2000, ApJ, 534, L135
- McNamara et al. (2016) McNamara B. R., Russell H. R., Nulsen P. E. J., Hogan M. T., Fabian A. C., Pulido F., Edge A. C., 2016, ApJ, 830, 79
- Meijerink et al. (2007) Meijerink Spaans, M. Israel, F. P. 2007, A&A, 461, 793
- Muller et al. (2005) Muller H. S. P., Schloder F., Stutzki J., Winnewisserr G., 2005, Journal of Molecular Structure, 742, 215
- Murphy et al. (2010) Murphy T., et al., 2010, MNRAS, 402, 2403
- Nagai et al. (2019) Nagai H., et al., 2019, arXiv e-prints, p. arXiv:1905.06017
- Nulsen et al. (2005) Nulsen P. E. J., McNamara B. R., Wise M. W., David L. P., 2005, ApJ, 628, 629
- O’Dea et al. (1994) O’Dea C. P., Baum S. A., Maloney P. R., Tacconi L. J., Sparks W. B., 1994, ApJ, 422, 467
- Olivares et al. (2019) Olivares V., et al., 2019, arXiv e-prints,
- Pizzolato & Soker (2005) Pizzolato F., Soker N., 2005, ApJ, 632, 821
- Richards et al. (2011) Richards J. L., et al., 2011, ApJS, 194, 29
- Rodriguez-Fernandez et al. (2006) Rodriguez-Fernandez Combes, F. Martin-Pintado, J. Wilson, T. L. Apponi, A. 2006, A&A, 455, 963
- Rodríguez-Fernández et al. (2010) Rodríguez-Fernández N. J., Tafalla M., Gueth F., Bachiller R., 2010, A&A, 516, A98
- Rose et al. (2019) Rose T., et al., 2019, MNRAS, 485, 229
- Ruffa et al. (2019) Ruffa I., et al., 2019, MNRAS, 484, 4239
- Russell et al. (2013) Russell H. R., McNamara B. R., Edge A. C., Hogan M. T., Main R. A., Vantyghem A. N., 2013, MNRAS, 432, 530
- Salomé & Combes (2003) Salomé P., Combes F., 2003, A&A, 412, 657
- Schwope et al. (2000) Schwope A., et al., 2000, Astronomische Nachrichten, 321, 1
- Sofia et al. (2004) Sofia U. J., Lauroesch J. T., Meyer D. M., Cartledge S. I. B., 2004, ApJ, 605, 272
- Somboonpanyakul et al. (2018) Somboonpanyakul T., McDonald M., Lin H. W., Stalder B., Stark A., 2018, ApJ, 863, 122
- Taylor (1996) Taylor G. B., 1996, ApJ, 470, 394
- Taylor et al. (1990) Taylor G. B., Perley R. A., Inoue M., Kato T., Tabara H., Aizu K., 1990, ApJ, 360, 41
- Temi et al. (2018) Temi P., Amblard A., Gitti M., Brighenti F., Gaspari M., Mathews W. G., David L., 2018, ApJ, 858, 17
- Tremblay et al. (2012) Tremblay G. R., et al., 2012, MNRAS, 424, 1042
- Tremblay et al. (2016) Tremblay G. R., et al., 2016, Nature, 534, 218
- Tremblay et al. (2018) Tremblay G. R., et al., 2018, ApJ, 865, 13
- Véron-Cetty et al. (2000) Véron-Cetty M.-P., Woltjer L., Staveley-Smith L., Ekers R. D., 2000, A&A, 362, 426
- Wiklind et al. (2018) Wiklind T., Combes F., Kanekar N., 2018, ApJ, 864, 73
- Wilson (2018) Wilson C. D., 2018, MNRAS, 477, 2926
- Wise et al. (2007) Wise M. W., McNamara B. R., Nulsen P. E. J., Houck J. C., David L. P., 2007, ApJ, 659, 1153
List of institutions
1Centre for Extragalactic Astronomy, Durham University, DH1 3LE, UK
2LERMA, Observatoire de Paris, PSL Research Univ., College de France, CNRS, Sorbonne Univ., Paris, France
3Department of Astrophysical Sciences, 4 Ivy Lane, Princeton University, Princeton, NJ 08544-1001, USA
4 Department of Physics, University of Bath, North Rd, Bath, BA2 7AY
5Institut d’Astrophysique Spatiale, Centre Universitaire d’Orsay, 91405 Orsay, France
6Gemini Observatory, Northern Operation Center, 67-0 N. A’Ohoku Place, Hilo, HI, USA
7Department of Astronomy, University of Virginia, 530 McCormick Road, Charlottesville, VA 22904-4325, USA
8Harvard-Smithsonian Center for Astrophysics, 60 Garden St., Cambridge, MA 02138, USA
9Department of Physics & Astronomy, University of Manitoba, Winnipeg, MB R3T 2N2, Canada
10Chester F. Carlson Center for Imaging Science, Rochester Institute of Technology, 84 Lomb Memorial Dr., NY 14623, USA
11HH Wills Physics Laboratory, Tyndall Avenue, Bristol, BS8 1TL, UK
12Department of Physics and Astronomy, University of Waterloo, Waterloo, ON N2L 3G1, Canada
13School of Physics and Astronomy, Rochester Institute of Technology, 85 Lomb Memorial Drive, USA
14SURFsara, P.O. Box 94613, 1090 GP Amsterdam, The Netherlands
15ASTRON, Netherlands Institute for Radio Astronomy, 7990AA Dwingeloo, The Netherlands
16Leiden Observatory, Leiden University, Niels Borhweg 2, NL-2333 CA Leiden, The Netherlands
17Institute of Astronomy, Cambridge University, Madingly Rd., Cambridge, CB3 0HA, UK
18Physics & Astronomy Department, Michigan State University, East Lansing, MI 48824-2320, USA
19Department of Physics and Astronomy, University of Kentucky, Lexington, Kentucky 40506-0055, USA
20RIT College of Science, 85 Lomb Memorial Drive, Rochester, NY 14623, USA
Appendix A Observation details for sources lacking emission and absorption lines
Table 7 shows details of the observations for which no detections of emission or absorption were made with either the CO(1-0), CN-A or CN-B lines.
| MACSJ0242.5-2132 | Abell 3112 | Abell 496 | RXCJ0132.6-0804 | |
| Observation date | 2018 Jan 12 | 2018 Jan 11 | 2018 Jan 13 | 2018 Jan 16 |
| Integration time (s) | 1300 | 1300 | 6800 | 2500 |
| CO(1-0) vel. resolution (km s-1) | 3.3 | 2.7 | 2.6 | 2.9 |
| Frequency resolution (kHz) | 977 | 977 | 977 | 977 |
| Angular resolution (arcsec) | 0.48 | 0.54 | 0.48 | 0.62 |
| PWV (mm) | 6.5 | 6.6 | 2.2 | 4.3 |
| FoV (arcsec) | 67.9 | 62.9 | 60.2 | 67.5 |
| ALMA configuration | C43-5 | C43-5 | C43-5 | C43-5 |
| Maximum spacing (m) | 1400 | 1400 | 1400 | 1400 |
| CO(1-0) noise per channel (mJy) | 1.87 | 1.10 | 0.55 | 1.80 |
| 115 GHz cont. flux density (mJy) | 39.6 | 30.4* | 59.0 | 38.6 |
| Abell 2415 | Abell 3581 | RXCJ1356.0-3421 | |
| Observation date | 2018 Jan 23 | 2018 Sep 11 | 2018 Sep 11 |
| Integration time (s) | 5400 | 1700 | 1200 |
| CO(1-0) vel. resolution (km s-1) | 2.7 | 2.6 | 3.1 |
| Frequency resolution (kHz) | 977 | 977 | 977 |
| Angular resolution (arcsec) | 0.57 | 0.92 | 0.91 |
| PWV (mm) | 1.76 | 0.72 | 0.7 |
| FoV (arcsec) | 61.9 | 59.5 | 63.4 |
| ALMA configuration | C43-5 | C43-4 | C43-4 |
| Maximum spacing (m) | 1400 | 784 | 784 |
| CO(1-0) noise per channel (mJy) | 0.35 | 0.85 | 1.32 |
| 115 GHz cont. flux density (mJy) | 27.2 | 59.1 | 25.9 |
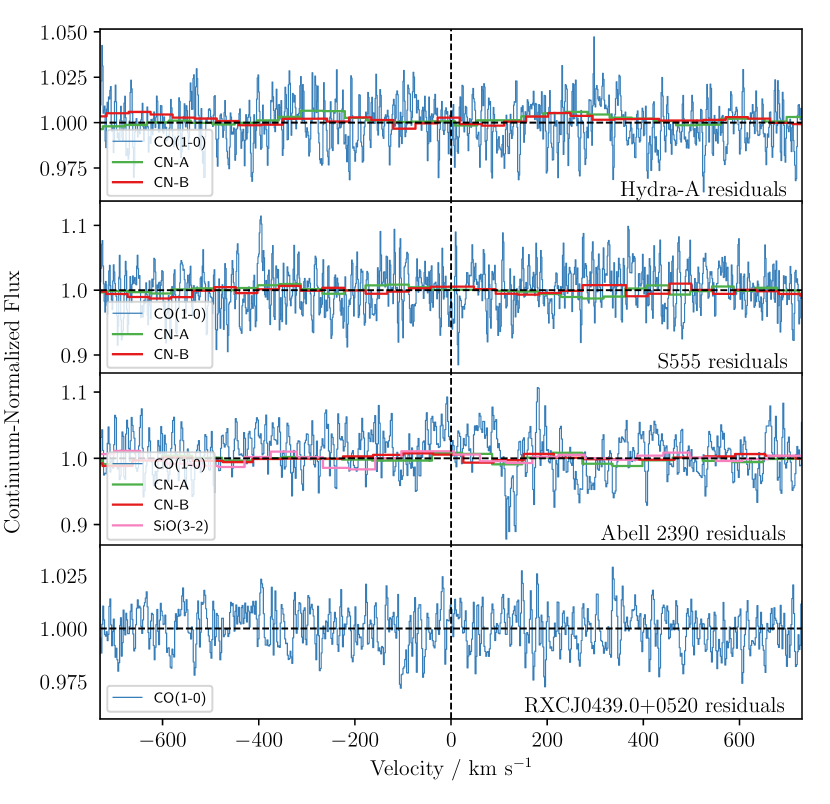
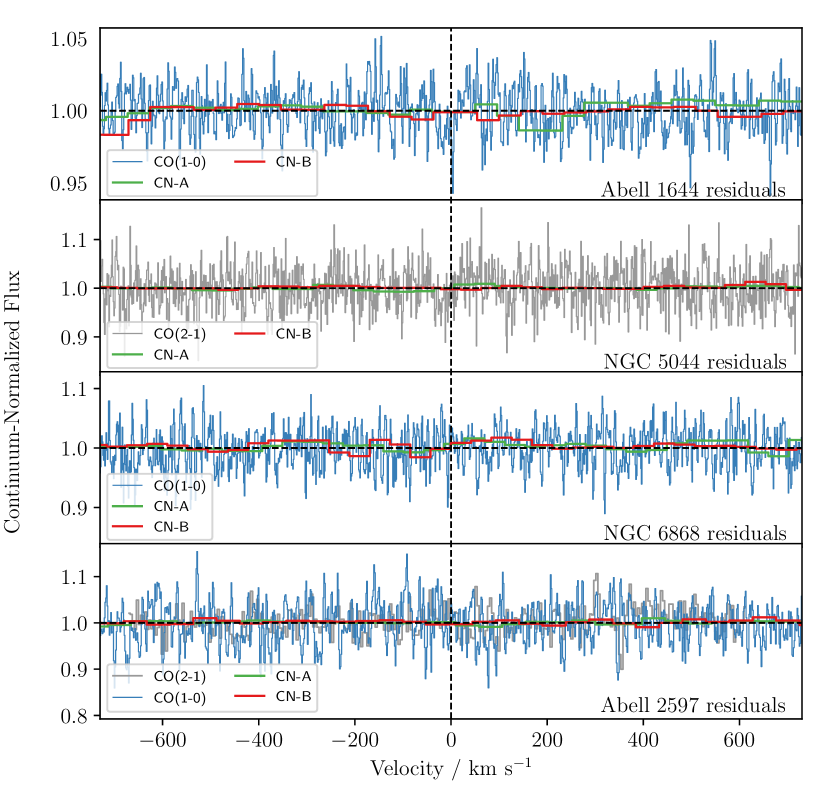
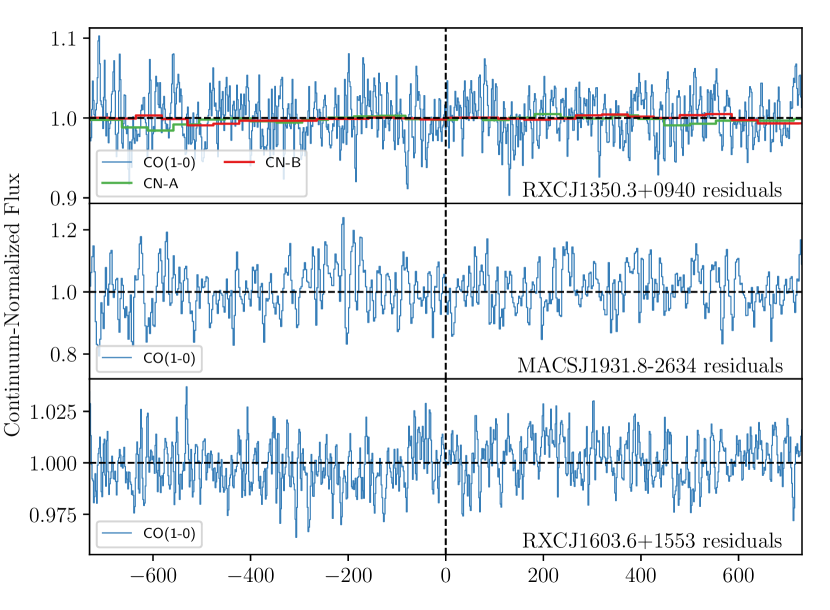
Appendix B Residuals of Absorption and Emission Line Fits
Fig. 11, 12 and 13 show the residuals for the spectra shown in Fig. 2, 3 and 4, calculated using the Gaussian best fits for the emission and absorption lines which are given in Tab. 5.