X-ray Monitoring of the Magnetar CXOU J171405.7381031 in SNR CTB 37B
Abstract
We present the results of our 8 year X-ray monitoring campaign on CXOU J171405.7381031, the magnetar associated with the faint supernova remnant (SNR) CTB 37B. It is among the youngest by inferred spin-down age, and most energetic in spin-down power of magnetars, and may contribute, at least partially, to the GeV and TeV emission coincident with the SNR. We use a series of Chandra, XMM-Newton, and NuSTAR observations to characterize the timing and spectral properties of the magnetar. The spin-down rate of the pulsar almost doubled in year and then decreased slowly to a more stable value. Its X-ray flux varied by , possibly correlated with the spin-down rate. The keV spectrum is well-characterized by an absorbed blackbody plus power-law model with an average temperature of keV and photon index , or by a Comptonized blackbody with keV and an additional hard power law with , In contrast with most magnetars, the pulsed signal is found to decrease with energy up to 6 keV, which is apparently caused by mixing with the hard spectral component that is pulse-phase shifted by cycles from the soft X-rays. We also analyze the spectrum of the nearby, diffuse nonthermal source XMMU J171410.8381442, whose relation to the SNR is uncertain.
1 Introduction
Modeling the spectra of magnetars provide an important diagnostic for understanding their emission mechanisms. Early literature characterized magnetars as “soft” X-ray sources emitting in the keV X-ray band. Their spectra were typically fitted with blackbody emission from a hot spot(s) on the neutron star (NS) surface, plus a steep power-law component with photon index , possibly scattered from the magnetosphere (e.g., Mereghetti & Stella 1995; van Paradijs et al. 1995). More recent INTEGRAL observations of the anomalous X-ray pulsar (AXP) subclass of magnetars revealed a previously unrecognized, flatter spectral component above 10 keV, extending up to keV, with a pulse modulation that increases with energy. These hard X-rays, beginning with detections of 1E 1841045 (Molkov et al., 2004) 1RXS J170849.0400910 (Revnivtsev et al., 2004), and 4U 0142+61 (den Hartog et al., 2004), are fitted with photon indices in the range , much harder than an extrapolation of the measured spectra below keV. The majority of the luminosity of these objects is emitted above 10 keV in this hard spectral component.
| Instrument/ModeaaMission modes: Chandra Timed Exposure (TE), Continuous Clocking (CC), Faint Grading (F), Very Faint Grading (VF); XMM-Newton Full Frame (FF). | ObsID | Date (UT)bbStart date of observation. | Exposure (ks)ccEffective exposure time for the EPIC pn after time filtering. | Epoch (MJD)ddEpoch of period is the mid-time of the observation. | Period (s) |
|---|---|---|---|---|---|
| ASCA GIS | 54002030 | 1996 Sep 12 | 13.3 | 50338.9 | |
| Suzaku XIS | 501007010 | 2007 Aug 27 | 82.8 | 53974.1 | … |
| Chandra ACIS-I/TE/VF | 6692 | 2007 Feb 2 | 25.2 | 54133.5 | … |
| Chandra ACIS-S3/CC/F | 10113 | 2009 Jan 25 | 30.1 | 54856.3 | |
| Chandra ACIS-S3/CC/F | 11233 | 2010 Jan 30 | 30.1 | 55226.5 | |
| XMM-Newton EPIC pn/FF | 0606020101 | 2010 Mar 17 | 93.0 | 55273.2 | |
| XMM-Newton EPIC pn/FF | 0670330101 | 2012 Mar 13 | 11.5 | 55999.5 | |
| Chandra ACIS-S3/CC/F | 13749 | 2012 Jul 16 | 20.1 | 56124.3 | |
| Chandra ACIS-S3/CC/F | 16762 | 2015 May 4 | 20.1 | 57146.6 | |
| NuSTAR FPM | 30001130002 | 2015 May 8 | 80.9 | 57151.1 | |
| Chandra ACIS-S3/CC/F | 16763 | 2015 Oct 13 | 19.2 | 57308.4 | |
| NuSTAR FPM | 30201031002 | 2016 Sep 22 | 78.6 | 57654.9 | |
| XMM-Newton EPIC pn/FF | 0790870201 | 2016 Sep 23 | 27.5 | 57654.9 | |
| XMM-Newton EPIC pn/FF | 0790870301 | 2017 Feb 22 | 20.0 | 57806.5 |
Hard X-rays from magnetars must be produced by nonthermal particles in the magnetosphere. A mechanism for this emission was recently described by Beloborodov (2013a, b): electron-positron discharge creates relativistic particles with Lorentz factors near the neutron star, the particles flow out along the extended magnetic field lines and decelerate with , losing energy to resonant scattering of thermal X-rays. The spectrum emitted by the decelerating plasma peaks above 100 keV, and its shape depends on the angle of the rotation axis to the line of sight. The model successfully reproduced the phase-resolved spectra of the aforementioned magnetars, the three best-studied objects (Hascoët et al., 2014). NuSTAR is well suited to studying the hard X-ray spectral components of magnetars, up to 79 keV. Its targets have included SGR J17452900 (Mori et al., 2013; Kaspi et al., 2014), 1E 1841045 (An et al., 2013, 2015), 1E 2259586 (Vogel et al., 2014), 1E 1048.15937 (An et al., 2014; Yang et al., 2016), 4U 0142+61 (Tendulkar et al., 2015), SGR 180620 (Younes et al., 2017a), SGR J1935+2154 (Younes et al., 2017b), PSR J16224950 (Camilo et al., 2018), XTE J1810197 (Gotthelf et al., 2019), and SGR 190014 (Tamba et al., 2019).
Aharonian et al. (2008) discovered the Chandra point source CXOU J171405.7381031 in the supernova remnant (SNR) CTB 37B in a follow up effort to identify HESS J1713381, a coincident TeV source (Aharonian et al., 2006). They considered the Chandra source a candidate pulsar, albeit with an unusually soft, non-thermal spectrum. Nakamura et al. (2009) analyzed Chandra and Suzaku spectra of CXOU J171405.7381031 (hereafter J171405), suggesting that it is an AXP based on evidence of flux variability. Halpern & Gotthelf (2010a, Paper I) discovered 3.82 s pulsations from J171405 that verifies this conjecture. Halpern & Gotthelf (2010b, Paper II) and Sato et al. (2010) reported follow-up observations using Chandra and XMM-Newton, respectively, that measure the period derivative of the pulsar, establishing its quantitative magnetar properties. J171405 has a higher spin-down power and younger characteristic age than most magnetars (Figure 1), falling among the most energetic soft gamma-ray repeaters (SGRs). Its spin-down power is comparable to its X-ray luminosity.

Although HESS J1713381 coincides with the SNR, its TeV structure has not been spatially resolved, and the young age and rapid spin-down of J171405 suggest the possibility (Paper II) that the pulsar contributes to the TeV emission via inverse Compton scattering by a relic pulsar wind nebula (PWN). Moreover, the presence of the nearby unidentified hard, diffuse X-ray source XMMU J171410.8381442 adds further uncertainty about the origin of the TeV emission.
As described in Section 2 we have obtained new Chandra, XMM-Newton, and NuSTAR observations of J171405 in order to monitor its timing and spectrum. A prime motivation was to search for any precursor of an impending SGR outburst, as may be anticipated from its location among the SGRs in Figure 1. A log of X-ray observations is presented in Table 1. In Sections 3–5 we describe the analysis of these data sets, along with available archival data spanning two decades. We show that the pulsar spins down erratically, and find that the NuSTAR X-ray observations clearly detect emission above 10 keV. In Section 5 we also provide a spectral analysis of the nearby hard, diffuse nonthermal source. Finally, we discuss our results in Section 6.
2 X-ray Observations
2.1 NuSTAR
We observed J171405 twice with NuSTAR, on 2015 May 8 and 2016 September 22. NuSTAR consists of two co-aligned X-ray telescopes, with corresponding focal plane modules FPMA and FPMB that provide FWHM ( HPD) imaging resolution over a 379 keV X-ray band, with a characteristic spectral resolution of 400 eV FWHM at 10 keV (Harrison et al., 2013). The reconstructed NuSTAR coordinates are accurate to at the 90% confidence level. The nominal timing accuracy of NuSTAR is 2 ms rms, after correcting for drift of the on-board clock, with the absolute timescale shown to be better than 3 ms (Mori et al., 2014; Madsen et al., 2015).
NuSTAR data were processed and analyzed using FTOOLS 09May2016_V6.19 (NUSTARDAS 14Apr16_V1.6.0) with NuSTAR Calibration Database (CALDB) files of 2016 July 6. The resulting data set provides a total of 80.9 ks and 78.6 ks of net good exposure time for the 2015 and 2016 pointings, respectively. For all subsequent analysis we merged data from both FPM detectors.
2.2 Chandra
Our previous Chandra observations of J171405 were reported in Papers I & II (see Table 1). We acquired three additional Chandra monitoring observations on 2012 July 16, 2015 May 4 (coordinated with our first NuSTAR observation), and 2015 October 13. The pulsar was located on the ACIS-S3 CCD and recorded in continuous-clocking (CC) mode. This provided a time resolution of 2.85 ms and no spectral pile-up. This is the same instrumental setup as used previously and fully described in the earlier papers along with a description of their reduction and analysis. The photon arrival times are adjusted in the standard processing to account for the known position of the pulsar, spacecraft dither, and any SIM offset. All observations were free of enhanced background episodes and required no time filtering. Reduction and analysis used the standard software packages CIAO (v4.8) and CALDB (v4.1.1).
2.3 XMM-Newton
J171405 was observed four times using XMM-Newton, initially by Sato et al. (2001) and later as part of our monitoring program (see Table 1). In particular, our 2016 September 23 XMM-Newton observation was obtained simultaneously with NuSTAR. In this work, we concentrate on data from the three EPIC sensors on-board XMM-Newton, the pn detector (Strüder et al., 2001) and MOS1 and MOS2 (Turner et al., 2001). The pn consist of 12 segments and the MOS comprises a mosaic of seven CCDs. These detectors lie at the focal plane of coaligned replicated foil mirrors with a maximum effective area of cm2 and cm2 at 1.5 keV. The FWHM of the on-axis point spread function (PSF) at 1.5 keV is and , for the pn and MOS, respectively. The EPIC detectors have a diameter field-of-view (FoV) and are sensitive to X-rays in the 0.1512 keV range with moderate energy resolution of 2050.
The XMM-Newton observations of J171405 were acquired with the EPIC pn operated in FullFrameMode with a sampling time of 73.4 ms. With the exception of the first observation, data collected by the two EPIC MOS detectors used the SmallWindowMode for which only a small portion () of the central CCD is read out in order to increase its time resolution to 0.3 s The first observation (ObsID 0606020101) used FullFrameMode mode that allowed MOS imaging of the whole FoV at the nominal 2.6 s time resolution. (The MOS observations are not listed separately in Table 1.)
Data were reduced and analyzed using the Standard Analysis Software (SAS) v.15 with the most up-to-date calibration files. After filtering out background flares we obtained usable pn/MOS exposure time for the observations, ordered by time, of 93/93 ks, 11.5/16.6 ks, 27.5/29.1 ks, and 20.0/21.6 ks.
3 Image Analysis
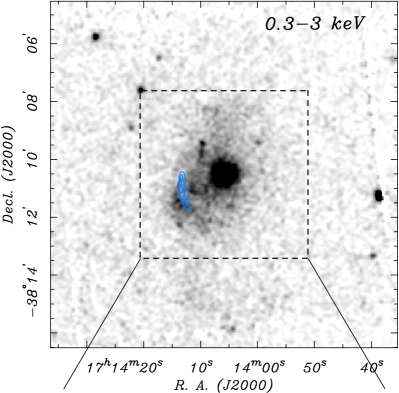
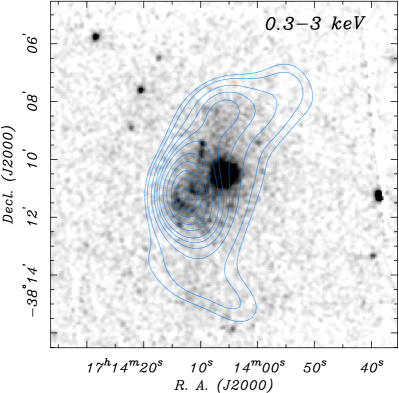
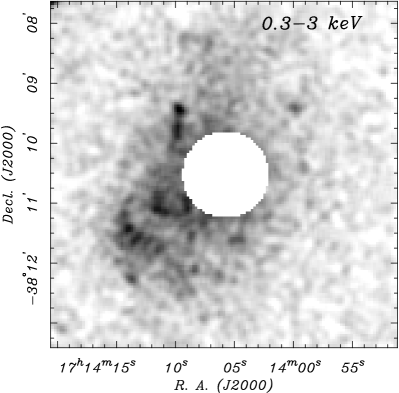
The XMM-Newton data is most useful for mapping the supernova remnant flux from CTB 37B. This soft thermal X-ray emissions falls outside the NuSTAR energy band and the Chandra data contains only 1D spatial information. Figure 2 displays EPIC MOS images in two energy bands, above and below 3 keV. These exposure-corrected, smoothed images, combining data from all four XMM-Newton data sets, are scaled logarithmically and stretched to highlight the diffuse SNR emission prominent in the lower energy band. The bulk of the thermal emission lies in a region roughly in extent and orientated with a P.A. of . To the east, the emission is evidently delineated in part by the radio SNR shell fragment. On a larger scale there is weak evidence for very low surface-brightness, asymmetric X-ray emission, possibly up to from the magnetar, suggesting the true size of the SNR. Barely resolved, to the southeast, is a patch of radial striations extending between that is not associated with any known PSF pattern. The structure in this feature is not resolved in the lower resolution EPIC pn images (not shown). Deep Chandra imaging-spectroscopy is required to further resolve and identify the nature of these striations.
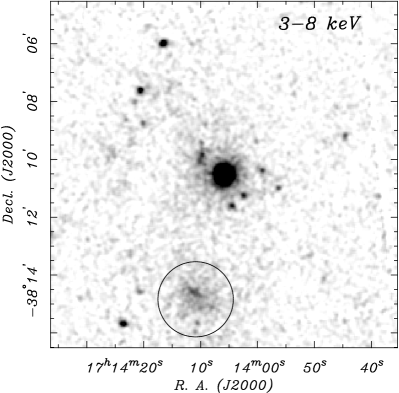
In the higher energy band, above 3 keV, the field is dominated by the central magnetar with no clear evidence of SNR emission. Instead we find a distinct diffuse hard X-ray feature in diameter, first reported by Nakamura et al. (2009). This source is located south south-east of the magnetar with approximate coordinates (J2000.0) R.A., decl. (herein XMMU J171410.8381442), and is not seen below keV. It is not clear whether this hard source is associated with CTB 37B. We will explore its possible nature in Section 5.2.


4 Timing Analysis
The erratic spin-down rates of magnetars is well documented, and a similar behavior has already been established for J171405 (see Paper II). Here we (re-)analyze all 8 years of accumulated timing observations of this magnetar to characterize its long-term spin-down evolution. For the following analysis, all photon arrival times are converted to barycentric dynamical time (TDB) using the DE405 solar system ephemeris and the Chandra position (J2000.0) R.A.=, decl.= (Paper II). The timing methods used herein are generally described in Paper I.
Source lightcurves were generated for the XMM-Newton data using a radius aperture in the energy range 15 keV, optimal for maximizing the pulse signal. As the Chandra data was obtained in CC-mode, we extracted counts from the central four source columns ( diameter), with the keV energy cut. For NuSTAR, we extracted counts from a radius source aperture, including photons below the standard 3 keV spectral analysis threshold.
To determine the spin period of J171405 at each epoch, we searched around the nominal value using the test (Buccheri et al., 1983), appropriate for the essentially sinusoidal pulse profile. The quoted 68.3% () uncertainty in the period measurements are computed from the decrement resolved around the signal peak in the periodogram. The resulting period values are reported in Table 1 and are plotted in Figure 3, along with period derivatives, determined by subtracting periods between each epoch.
In early 2010 the period derivative quickly doubled, but it gradually returned to a more stable value of . Because of the sparse and irregular monitoring, it is not possible to determine if additional, short episodes of enhanced spin-down occurred. There is one more pulsed detection, from archival ASCA data in 1996, which gives between 1996 and 2010 (Paper II), possibly representative of a long-term, average value. For clarity, we exclude the ASCA point in Figure 3.
The pulse profile appears to be generally stable in time and is well-modeled by a sinusoidal function with pulsed fraction . For the four XMM-Newton epochs, the average background-subtracted pulsed fraction is in the 15 keV band. As shown in Figure 4, we also examine the pulsed fraction as a function of energy using the deep 2010 XMM-Newton observation. These data provide sufficient statistics to resolve a strong energy dependence in the modulation, which decreases with energy until reaching the limit of 18% at keV. This result is marginally reproduced in the other, much shorter XMM-Newton observations, but with less significance.
In the NuSTAR observations we at first found no evidence for a pulsed signal in the full spectral band. Below 6 keV, however, we recover the expected signal, consistent with the XMM-Newton results. Examining the modulation as a function of energy reveals a sinusoidal signal above 9 keV that is steadily increasing with energy, but phase shifted by relative to the softer X-ray pulse profile. This is illustrated in Figure 5, showing the pulse profiles in the two energy bands of interest. This strongly suggests the presence of an independent hard spectral component dominating above 10 keV, consistent with that found for other magnetars, where the pulsed fraction increases with energy. However, the present NuSTAR data are insensitive to pulsations above 30 keV, where the signal is most likely masked by a relatively large background.
to Coincident 2016 XMM-Newton/NuSTAR Spectra
| Parameter | CBB+PL | CBB+PL | BB+PL | PL+PL |
|---|---|---|---|---|
| Tuned | ||||
| ( cm-2) | ||||
| (keV) | … | |||
| (km) | … | |||
| aaUnabsorbed luminosity, in erg s-1, for kpc (Blumer et al. 2019). | … | … | … | |
| … | … | … | ||
| … | … | |||
| ccAbsorbed keV flux, in erg cm-2 s-1, from the XMM-Newton EPIC pn. | ||||
| aaUnabsorbed luminosity, in erg s-1, for kpc (Blumer et al. 2019). | ||||
| aaUnabsorbed luminosity, in erg s-1, for kpc (Blumer et al. 2019). | ||||
| 0.869(69) | 0.872(70) | 1.02(70) | 1.14(70) |
Note. — Quoted uncertainties are at the 90% confidence level for two interesting parameters.
Given the strong energy dependence of the pulsed fraction, we postulate a model for the modulation that incorporates the overlapping, pulsed spectral components, including their phase difference. The hard and soft components combine to cancel out the modulation in their region of overlap. We also model the modulation in detail in Section 5.1 to further discriminate among the acceptable spectral models.
5 Spectral Analysis
Our previous analysis of J171405 showed that a variety of spectral models can fit the 0.310 keV Chandra and XMM-Newton data equally well, including two blackbodies, a blackbody plus power-law, and a Comptonized blackbody (Papers I, II). Now, the addition of the NuSTAR data, covering 379 keV, adds a strong spectral lever arm to help distinguish between these models. In the following sections, we use the spectral and energy-dependent modulation of the pulsar to show that its spectrum is best characterized by a Comptonized blackbody whose temperature is constant in time, plus an additional hard power-law. We also analyze the spectrum of the hard diffuse source XMMU J171410.8381442, located to the south of J171405, to consider its nature.
For spectral fitting we use the XSPEC (v12.8.2) package (Arnaud, 1996) and characterize the column density with the built-in TBabs absorption model, selecting the wilm Solar abundances (Wilms et al., 2000) and the vern photoionization cross-section (Verner et al., 1996). The statistic is used to evaluate the spectral fits throughout and the parameter uncertainties are quoted at the 90% confidence level for one or more interesting parameters, as appropriate. Response matrices and ancillary response files were generated for each data set following the standard procedures for their respective missions.
5.1 CXOU J171405.7381031
In the current spectral study of J171405 we use all available Chandra, XMM-Newton, NuSTAR data sets111We excluded the 2007 Chandra observation in TE mode as it provides a poor flux measurement. The source was dithered on and off the edge of the CCD and suffers from time variable pile-up.. Source spectra were extracted from circular apertures whose size were selected to optimize the signal to noise ratio for each observation. For the Chandra CC-mode data we extracted source spectra from the sum of the five central source columns, corresponding to a diameter of containing % of the point-source enclosed energy. The background in this case was obtained from the adjacent pixels on either side of the source region. We estimate the NuSTAR and XMM-Newton backgrounds using an annular region, to allow for underlying SNR emission in the source aperture. Because of the lack of available background regions for the XMM-Newton EPIC MOS data acquired in SmallWindowMode, only the EPIC pn data is used for spectroscopy. Spectra from the two NuSTAR FPMs were co-added.
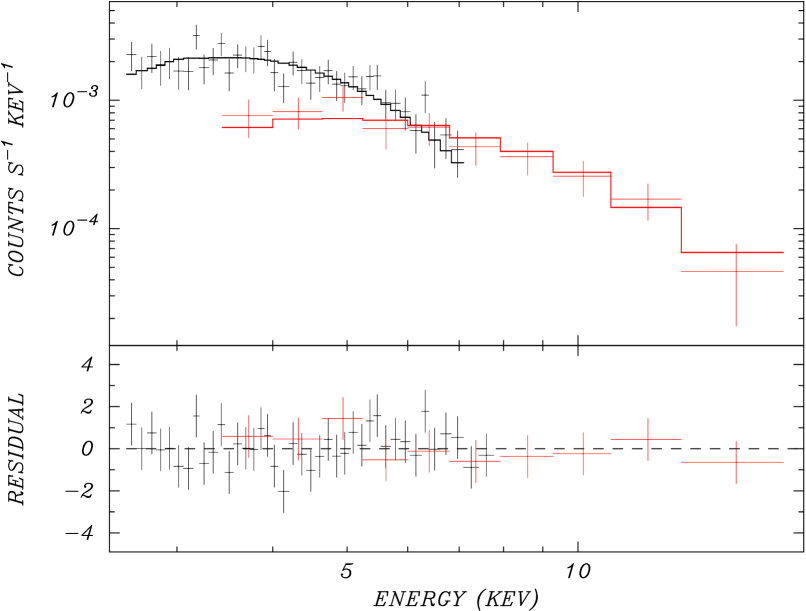
To characterize the broadband spectrum of J171405 we conducted a joint fit of the contemporaneous 2016 XMM-Newton and NuSTAR data. Several trial spectral models were fitted in the 110 keV and 365 keV range, for the two missions, respectively. With the addition of the harder NuSTAR spectra, we find that all single component models are rejected, including those allowed by previous fits to data below keV, as reported in Paper II. Similarly, of the plausible two-component models, the two-blackbody model is also rejected due to a poor fit.
In contrast, we are able to obtain an excellent fit to the data (Figure 6) using an absorbed blackbody plus hard power-law model (BB+PL), with or without taking into account possible Compton scattering of the thermal emission (CBB+PL). For the latter, we use the model described in Halpern et al. (2008), where is the log ratio of the scattering optical depth over the mean amplification of photon energy per scattering, valid for (Rybicki & Lightman, 1986). The derived column densities for these models are consistent with the value reported for the SNR obtained using Suzaku data (Nakamura et al., 2009). While a fit using the double power-law model is formally acceptable, in this case the column density is far from that obtained for the SNR. A summary of spectral results for these models is presented in Table 2. Assuming a distance of 9.8 kpc (Blumer et al., 2019), the 2–50 keV X-ray luminosity of J171405 is erg s-1. This is comparable to its spin-down power, erg s-1 for s, , and moment of inertia g cm2.

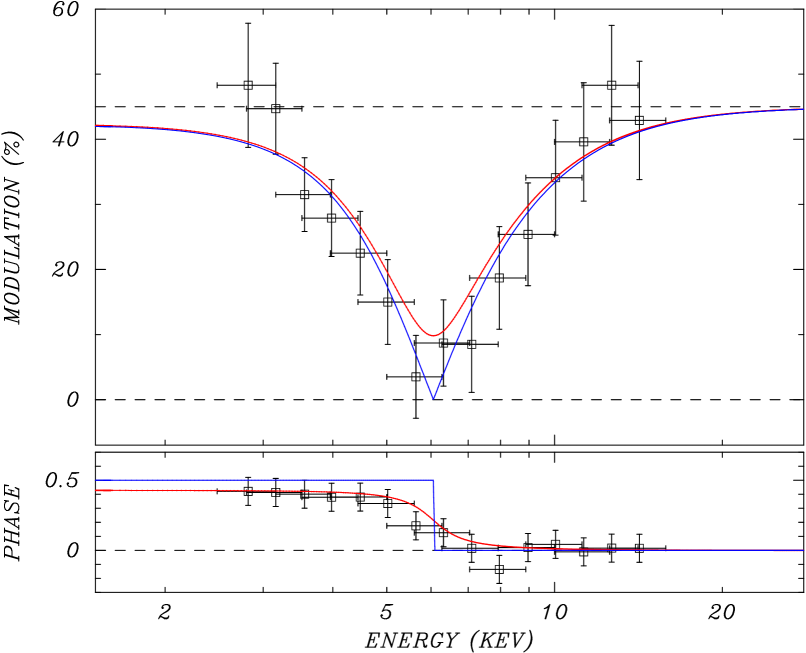
A further constraint on possible spectral models is provided by the energy-dependent modulation of the pulse profile as presented in Section 4. For the sum of two sinusoidally varying spectral components with the same period, but phase difference , the net pulsed fraction as a function of photon energy is predicted from their relative fluxes, and , as follows:
where and are the (assumed energy-independent) pulsed fractions of the two spectral components, and
is the energy-dependent phase shift. Of note, the modulation tends towards a minimum at the spectral cross-over energy, where the fluxes from the two spectral components are equal.
We apply this modulation model to the results of the joint fits to the coincident 2016 XMM-Newton and NuSTAR spectra for each spectral model of Table 2. Only the Comptonized blackbody plus power-law model is able to reproduce the observed modulation curve as a function of energy, specifically the location of the dip at keV (Figure 7). The implied energy-independent modulation is 45% for both components, and the apparent phase offset is cycles. This offset between the phase of the blackbody and the power-law spectral components suggest that they arise on opposite sides of the neutron star, or possibly that the thermal emission is not viewed directly, but reflected by an opaque scattering screen (see Section 6).
The of the CBB+PL spectral fit is smaller than that of the BB+PL model, justifying the extra parameter. But the modulation data provides a further constraint on the spectrum that allows us to distinguish between models, in this case implying deviations from pure blackbody emission. Furthermore, simultaneously fitting the spectra and modulation curve allows us to fine tune the spectral parameters for the CBB+PL model to adjust the spectral cross-over (6.6 keV) between components to match the dip in modulation at 6.1 keV. The tuned spectral parameters are well within the uncertainties of the nominal fit parameters for this model, resulting in a negligible change in the , as presented in Table 2.
We now consider the full set of Chandra, XMM-Newton, and NuSTAR spectra acquired over a span of 8 years, from 2009 January 25 to 2017 February 22 (11 observations, see Table 1). Initial fits at each epoch shows no evidence of significant change in the spectral shape over time. We therefore fit all the spectra simultaneously with their normalization left free, to allow for calibration differences between telescopes and to search for flux variability. For ease of comparison, we use the nominal blackbody plus power-law model. The resulting combined fit is shown in Figure 8. The NuSTAR spectra, even if not generally taken at the same epoch as the other data sets, strongly constrain the temperature at the lower energies where the blackbody component dominates the Chandra and XMM-Newton spectra. The combined best fit model parameters are cm-2, blackbody temperature keV, and photon index , with a for 601 degrees of freedom. This result is consistent with that presented in Table 2 for the coincident XMM-Newton and NuSTAR spectral fits.
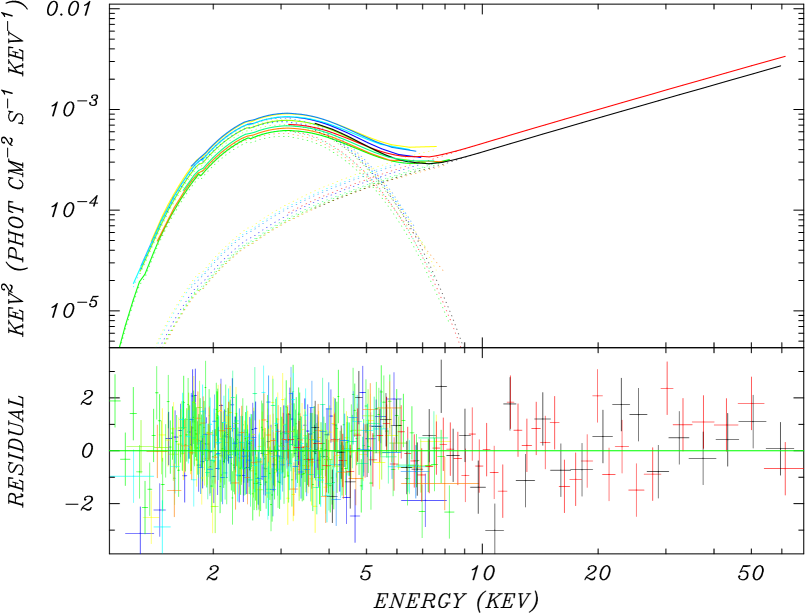
To study the long-term flux and spectral variability we refitted the individual spectra with column density and power-law index again linked between epochs, but with temperatures and normalizations free. The resulting temperature and flux for each observation are shown in Figure 9. We find no significant change in the time history of the temperature, but there is flux variability evidently uncorrelated with temperature. We quantify this variability by comparing a simultaneous fit across the 11 spectra with all parameters linked to one for which the blackbody normalization (only) is free to vary. The ratio of the resulting statistics, and , strongly excludes a constant flux model, with F-test probability .
We note that this result does not take into account systematic differences in the inter-instrument flux calibrations or the photometric reproducibility of the individual instruments. However, we find that observations which are contemporaneous or adjacent have consistent fluxes, within their uncertainties. Interestingly, a possible exception is the highest flux point, in early 2010, which coincides with the brief doubling of in Figure 3. However, the data are otherwise too sparse to test for a relation between luminosity and spin-down rate.

The XMM-Newton and Chandra spectra used here were also analyzed by Watanabe et al. (2019), who found lower column densities, and 2–10 keV fluxes higher by than ours. It is not clear what is responsible for these differences. Without the benefit of the NuSTAR data, their spectral models do not account for the hard power-law component. They deemed the long-term flux variability to be insignificant.
5.2 XMMU J171410.8381442
We extracted spectra from XMMU J171410.8381442, the hard source to the south of CTB 37B, using data from the deep 2010 XMM-Newton and the 2016 NuSTAR observations. The source extraction aperture in the XMM-Newton data is shown in the lower right panel of Figure 2. The 2015 NuSTAR observation is not used, as the source region there is contaminated by stray light. For the XMM-Newton data, we restrict our analysis to the EPIC MOS data set due to the overwhelming background in the EPIC pn. The MOS spectrum is fitted in the 2–7 keV band, where the lower limit is chosen to avoid poorly subtracted, strong instrumental features. The NuSTAR spectrum is fitted in the 3–20 keV range, for lack of photons at higher energies. A total of 2310 MOS counts and 1010 FPM counts are extracted from the diameter aperture, of which 45% and 65% are background counts, respectively. The background regions for both spectra are chosen from a diameter aperture adjacent to the source region. With the lack of evidence for spectral features, we fit a simple absorbed power-law model. The best-fit parameters are cm-2, and photon index , with a for 49 degrees of freedom. These results are somewhat different from the findings of Nakamura et al. (2009) from Suzaku, particularly our 2–10 keV unabsorbed flux of erg cm-2 s-1, which is half that reported by those authors. We consider the present results to be more reliable because of the smaller PSF of NuSTAR and XMM-Newton in comparison to the Suzaku data, which suffered contamination from the nearby SNR and magnetar. The fitted column density to XMMU J171410.8381442 is significantly higher than in the favored spectral model for J171405, which suggests that it might be unrelated to the magnetar or the SNR.
6 Discussion and Conclusions
The spectra of most magnetars are well-fitted below 10 keV with either a two-blackbody model or a blackbody plus a non-thermal power-law model with a steep slope. The latter model is similar to a Comptonized blackbody of appropriate scattering parameters. Evident non-thermal emission above 10 keV is characterized by a much flatter power-law with . The spectrum of J171405 is somewhat unusual in that the flux below keV falls off much slower with energy then expected. In addition to a thermal component of , notably, a hot thermal component ( keV) or a flat () power-law component is required to fit the spectrum in this band. Because its power-law index is compatible with those from fits obtained above 10 keV, only two components are in fact required to fit the overall broad band spectrum of J171405.
For the magnetar spectral survey of Enoto et al. (2017), only four out of 15 objects that have a hard component above 10 keV can be satisfactorily fit with a single component in addition to their thermal spectra: SGR 180620, SGR 1900+14, 1E 1547.05408, and SGR 18330832. Furthermore, two more objects, 1E 1048.15937, and 1E 2259+586, show the need for either one or two components at different times, suggesting a correlation with their emission state. Like for SGR 180620 and SGR 1900+14, the hard power-law emission from J171405 might dominate and obscure a fainter thermal/power-law component. The spectral properties of J171405, shared by several of the SGRs, may therefore be attributes of its comparative youth and greater magnetic field strength relative to other AXPs, as shown in Figure 1. In fact, the spin-down rate, characteristic age, and surface magnetic field of J171405 are most similar to those of SGR 190014. And its hardness ratio, comparing the flux in the hard to soft bands, of agrees well with the correlations for those parameters reported by Enoto et al. (2017).
The energy-dependent modulation of J171405 is also unusual for a magnetar. In contrast with most magnetars, its pulsed fraction decreases with energy up to keV, but this can be explained by the rising contribution of the hard spectral component, which happens to be phase-shifted by cycles from the soft X-rays, thus reducing the net modulation. A similar effect is seen in 1RXS J170849.0400910 (den Hartog et al., 2004), where a hard pulse component that dominates above 8 keV is shifted by cycles from a soft pulse component below that energy.
The simplest interpretation of the phase shift would have the two spectral components arise from nearly opposite sides of the NS. However, in the Beloborodov (2013a, b) model of scattering from e± pairs on twisted magnetic field-line bundles, the particles can form an opaque (to soft X-rays) resonance-scattering layer at the top of the magnetic loops, which obscures the surface hot spots from certain viewing angles. In this case, the thermal emission might not be seen directly, but could peak in reflection at the opposite phase.
For most other magnetars with hard pulsed components, the modulation increases with energy above 10 keV. Unfortunately the statistics of the NuSTAR data on J171405 are not sufficient above 30 keV to determine if its pulsed modulation continues to increase with photon energy above 10 keV, where the pulsed fraction reaches . In some objects the pulsed fraction increases to as high as 0.96 at 20 keV (1E 2259+586:Vogel et al. 2014), while in others, the pulsed fraction levels off (4U 0142+61: Tendulkar et al. 2015; 1E1841045: An et al. 2013, 2015) or decreases (1E1048.1-5937: Yang et al. 2016; XTE J1810197: Gotthelf et al. 2019) at high energy.
Our original motivation for monitoring J171405 was to detect any timing and spectral changes that might precede an SGR outburst, which could reveal the proximate cause of SGR flares. Based on the similarity of the timing properties of J171405 to the most energetic SGRs, an outburst can be expected, although we are still waiting for it. The factor of 2 change in that we observed is evidently not sufficient to trigger an outburst, even though it may be correlated with changes in X-ray luminosity. In other magnetars, an increase in torque has been seen following an outburst, by days in 1E 1048.15937 (Archibald et al., 2015), and by year in SGR 182020 (Woods et al., 2007; Younes et al., 2015), so it cannot be excluded that J171405 had an undetected bursting episode just prior to the beginning of our timing program.
The relation, if any, between the magnetar and HESS J1713381 remains uncertain. There is no direct evidence from X-rays for a PWN that could contribute TeV emission. The existing XMM-Newton images are limited in their sensitivity to a PWN by the thermal X-ray emission from the SNR and the magnetar itself, while the deep imaging with Chandra that would be necessary to reveal a compact, nonthermal structure, has not yet been done. As discussed in Paper II, even though the present spin-down power of J171405 is only about equal to the TeV luminosity of HESS J1713381, it is plausible that relic electrons, from a recent time when the was much larger than it is now, are powering a TeV nebula via inverse Compton scattering. GeV emission from Fermi has also been detected in the direction of CTB 37B (Xin et al., 2016), and its spectrum connects smoothly with that of HESS J1713381, suggesting that there is only one -ray source at this location.
It is interesting that the only magnetar that has good evidence of possessing an X-ray PWN, Swift J1834.90846 (Younes et al., 2016), is also coincident with a SNR (W41), a TeV source (HESS J1834097), and a GeV source (2FGL J1834.30848). Abramowski et al. (2015) discuss these associations in the context of the PWN possibly belonging to the nearby pulsar candidate XMMU J183435.3084443 (Mukherjee et al., 2009), but it more likely belongs to Swift J1834.90846 (see also Misanovic et al. 2011). J171405 thus bears some similarity to Swift J1834.90846 in its associations.
The nearby source XMMU J171410.8381442 is also a potential -ray emitter, although it is not clear whether it is part of the SNR shell of CTB 37B or an unrelated object. Its X-ray , larger than that of the magnetar or the SNR, is tentative evidence that it may be a background source, e.g., a PWN. The GeV and TeV centroids are both closer to the magnetar and the SNR than to XMMU J171410.8381442, although there is room for overlap. This leaves the nature of XMMU J171410.8381442 unknown. It could also be investigated with a deeper Chandra observation, e.g., to search for an embedded pulsar point source.
References
- Abramowski et al. (2015) Abramowski, A., Aharonian, F., Ait Benkhali, F., et al. 2015, A&A, 574, A27
- Aharonian et al. (2006) Aharonian, F., Akhperjanian, A. G., Bazer-Bachi, A. R., et al. 2006, ApJ, 636, 777
- Aharonian et al. (2008) Aharonian, F., Akhperjanian, A. G., Barres de Almeida, U., et al. 2008, A&A, 486, 829
- An et al. (2013) An, H., Hascoët, R., Kaspi, V. M., et al. 2013, ApJ, 779, 163
- An et al. (2014) An, H., Kaspi, V. M., Beloborodov, A. M., et al. 2014, ApJ, 790, 60
- An et al. (2015) An, H., Archibald, R. F., Hascoët, R., Kaspi, V. M., et al. 2015, ApJ, 807, 93
- Archibald et al. (2015) Archibald, R. F., Kaspi, V. M., Ng, C.-Y., et al. 2015, 800, 33
- Arnaud (1996) Arnaud, K. A. 1996, in ASP Conf. Ser. 101, Astronomical Data Analysis Software and Systems V, ed. G. H. Jacoby & J. Barnes (San Francisco, CA: ASP), 17
- Beloborodov (2013a) Beloborodov, A. M. 2013a, ApJ, 762, 13
- Beloborodov (2013b) Beloborodov, A. M. 2013b, ApJ, 777, 114
- Blumer et al. (2019) Blumer, H., Safi-Harb, S. & Kothes, R. 2019, MNRAS, submitted (arXiv:1906.07249)
- Buccheri et al. (1983) Buccheri, R., Bennet, K., Bignami, G. F., et al. 1983, A&A, 128, 245
- Camilo et al. (2018) Camilo, F., Scholz, P., Serylak, M., et al. 2018, ApJ, 856, 108
- den Hartog et al. (2004) den Hartog, P. R., Kuiper, L., Hermsen, W., & Vink, J. 2004, ATel, 293, 1
- den Hartog et al. (2004) den Hartog, P. R., Kuiper, L., & Hermsen, W. 2008, A&A, 489, 263
- Enoto et al. (2017) Enoto, T., Shibata, S., Kitaguchi, T., et al. 2017, ApJS, 231, 847, L25
- Gotthelf et al. (2019) Gotthelf, E. V., Halpern, J. P., Alford, J. A. J., et al. 2019, ApJ, 974, L25
- Green et al. (1999) Green, A. J., Cram, L. E., Large, M. I., & Ye, T. 1999, ApJS, 122, 207
- Halpern & Gotthelf (2010a) Halpern, J. P., & Gotthelf, E. V. 2010a, ApJ, 710, 941 (Paper I)
- Halpern & Gotthelf (2010b) Halpern, J. P., & Gotthelf, E. V. 2010b, ApJ, 725, 1384 (Paper II)
- Halpern et al. (2008) Halpern, J. P., Gotthelf, E. V., Reynolds, J., Ransom, S. M. & Camilo, F. 2008, ApJ, 676, 1178
- Harrison et al. (2013) Harrison, F. A., Craig, W. W., Christensen, F. E., et al. 2013, ApJ, 770, 103
- Hascoët et al. (2014) Hascoët, R., Beloborodov, A. M., & den Hartog, P. R. 2915, ApJ, 786, L1
- Kaspi et al. (2014) Kaspi, V. M., Archibald, R. F., Bhalerao, V., et al. 2014, ApJ, 786, 84
- Madsen et al. (2015) Madsen, K. K., Harrison, F. A., Markwardt, C. B., et al. 2015, ApJS, 220, 8
- Mereghetti & Stella (1995) Mereghetti, S., & Stella, L. 1995, ApJ, 442, L17
- Misanovic et al. (2011) Misanovic, Z., Kargaltsev, O., & Pavlov, G. G. 2011, ApJ, 735, 33
- Molkov et al. (2004) Molkov, S. V., Cherepashchuk, A. M., Lutovinov, A. A., et al. 2004, AstL, 30, 534
- Mori et al. (2013) Mori, K., Gotthelf, E. V., Zhang, S., et al. 2013, ApJ, 770, L23
- Mori et al. (2014) Mori, K., Gotthelf, E. V., Dufour, F., et al. 2014, ApJ, 793, 88
- Mukherjee et al. (2009) Mukherjee, R., Gotthelf, E. V., Halpern, J. P., et al. 2009, ApJ, 691, 1707
- Nakamura et al. (2009) Nakamura, R., Bamba, A., Ishida, et al. 2009, PASJ, 61, S197
- Revnivtsev et al. (2004) Revnivtsev, M. G., Sunyaev, R. A., Varshalovich, D. A., et al. 2004, Astl, 30, 382
- Rybicki & Lightman (1986) Rybicki, G. B., & Lightman, A. P. 1986, Radiative Processes in Astrophysics, (New York: Wiley-VCH)
- Sato et al. (2010) Sato, T., Bamba, A., Nakamura, R., & Ishida, M. 2010, PASJ, 62, L33
- Strüder et al. (2001) Strüder, L., Briel, U., Dennerl, K., et al. 2001, A&A, 365, L18
- Tamba et al. (2019) Tamba, T., Bamba, A., Odaka, H., & Enoto, T. 2019, PASJ, in press (arXiv:1906.04406)
- Tendulkar et al. (2015) Tendulkar, S. P., Hascoët, R., Yang, C., et al. 2015, ApJ, 808, 32
- Turner et al. (2001) Turner, M. J. L., Abbey, A., Arnaud, M., et al. 2001, A&A, 365, L27
- van Paradijs et al. (1995) van Paradijs, J., Taam, R. E., & van den Heuvel, E. P. J. 1995, A&A, 299, L41
- Verner et al. (1996) Verner, D. A., Ferland, G. J., Korista, K. T., & Yakovlev, D. G. 1996, ApJ, 465, 487
- Vogel et al. (2014) Vogel, J. K., Hascoët, R., Kaspi, V. M., et al. 2014, ApJ, 789, 75
- Watanabe et al. (2019) Watanabe, H., Bamba, A., Shibata, S., & Watanabe, E. 2019, PASJ, in press (arXiv:1905.11561)
- White et al. (2005) White, R. L., Becker, R. H., & Helfand, D. J. 2005, AJ, 130, 586
- Wilms et al. (2000) Wilms, J., Allen, A., & McCray, R. 2000, ApJ, 542, 914
- Woods et al. (2007) Woods, P. M., Kouveliotou, C., Finger, M. H. et al. 2007, ApJ, 654, 470
- Xin et al. (2016) Xin, Y.-L., Liang, Y.-F., Li, X., et al. 2016, ApJ, 817, 64
- Yang et al. (2016) Yang, C., Archibald, R. F., Vogel, J. K., et al. 2016, ApJ, 831, 80
- Younes et al. (2015) Younes, G., Kouveliotou, C., & Kaspi, V. M. 2015 ApJ, 809, 165
- Younes et al. (2016) Younes, G., Kouveliotou, C., Kargaltsev, O., et al. 2016 ApJ, 824, 138
- Younes et al. (2017a) Younes, G., Baring, M. G., Kouveliotou, C., et al. 2017a ApJ, 851, 17
- Younes et al. (2017b) Younes, G,, Kouveliotou, C., Jaodand, A., et al. 2017b ApJ, 847, 85