A Communication-Centric Observability Selection for Post-Silicon System-on-Chip Integration Debug
Abstract
Reconstruction of how components communicate with each other during system execution is crucial for debugging system-on-chip designs. However, limited observability is the major obstacle to the efficient and accurate reconstruction in the post-silicon validation stage. This paper addresses that problem by proposing several communication event selection methods guided by system-level communication protocols. Such methods are optimized for on-chip communication event tracing infrastructure to enhance observability. The effectiveness of these methods are demonstrated with experiments on a non-trivial multicore SoC prototype. The results show that with the proposed method, more comprehensive information on system internal execution can be inferred from traces under limited observability.
1 Introduction
A modern System-on-Chip (SoC) design is typically constructed by composing a large number of pre-designed \sayintellectual properties or \sayIPs that coordinate through complex protocols to implement system-level behavior.Over the last decade, the number and heterogeneity of IPs integrated in an SoC design have continued to grow, and the trend is towards an even sharper growth gradient as we develop sophisticated systems targeting complex applications like automotives and Internet-of-Things. Unsurprisingly, this has led to an increasing count of design bugs [1, 2]. These systems are often deployed in critical applications, bugs discovered after their deployment in field can be extremely expensive, resulting in catastrophic loss of company revenues, compromise of personal and national security, and even human life.
Post-silicon debug is a critical component of the validation of modern microprocessors and SoC designs. It is performed on silicon implementation, to make sure that the finished system works as intended under actual operating conditions. Unfortunately, it is also highly complex, performed under aggressive schedules and accounting for more than of the overall design validation cost [2]. A major challenge in post-silicon debug is the severely limited observability where only a small number of debug interface signals are available to observe a vast space of internal executions of SoC designs.
In this paper, we consider post-silicon integration debug of SoC designs, which concerns debugging anomalies in executions of communication protocols among various IPs. Executions in modern SoC designs entail significant interleavings of a large number of such protocols, and errors can occur because of a subtle race condition in a specific interleaving which is difficult to exercise or repeat [3]. Furthermore, while individual IPs are often reused across products, their specific integration, — and consequently, the protocols involved in their communications —, is unique to each individual SoC. This results in unique bugs arising in the communication component of each SoC, which are hard to isolate, replay, triage, and root-cause. The situation is particularly exacerbated by the fact that due to partial observability only a small set of events in the participating protocols can be actually observed in each execution, making it harder to pinpoint the exact interleaving involved in the execution.
In order to address the above challenge, this paper presents a number of communication event selection methods aiming to increase coverage metrics that are relevant to various debug objectives. These methods are optimized for an on-chip communication event tracing infrastructure that can be typically found in modern SoC designs. The main contributions of this paper include the following.
-
•
This work considers enhancing observability with respect to an on-chip real-time tracing infrastructure instead of trace buffers. Using trace buffers can only offer a limited window of observability while the real-time tracing provides more comprehensive observability over the entire course of system execution, which is indispensable for SoC integration debug.
-
•
New coverage metrics are proposed for evaluating relevance and comprehensiveness of information captured on observed traces with respect to system-level communication protocols. The traditional metric, state restoration ratio (SRR), is not applicable for SoC integration debug.
-
•
Communication event selection methods are driven by the proposed coverage metrics optimized for the real-time tracing infrastructure so that observed traces only capture the most relevant communication events under limited observability.
2 Background
In architectural documents, system-level protocols are often represented as message flows, therefore they are referred to as system flows in this paper.
Definition 2.1
A system flow is defined as a tuple where is a finite set of places, is a finite set of transitions, is a finite set of events, and is a labeling function that maps each transition to an event .
An SoC typically implements several flows denoted as . In this paper, denotes one such flow. In a system flow, an event is a tuple where is a command sent from a source component to a destination component . An event is generated when block src communicates with block dest. An example CPU write flow is shown in Figure 1.
For each transition , its preset, denoted as , is the set of places connected to , and its postset, denoted as , is the set of places that is connected to. A state of a flow is a subset of places marked with tokens. There are two special states associated with each flow; is the set of initially marked states, also referred to as the initial state, and the end state is the set of end states not going to any transitions. Each flow is associated with one start and several end events. An event is a start event if and . An event is an end event if and . In Figure 1, , and , its start event is (CPU_X:Cache_X:wr_req), and its end event is the one labeled for transitions and . The occurrence of a start event indicates the beginning of a flow execution, while the occurrence of an end event indicates the complete of a flow execution.
A transition can be fired in a state if . Firing causes the labeled event to be emitted, and leads to a new state . Therefore, executing a flow induces a sequence of events. Execution of a flow completes if its is reached.
Definition 2.2
An instance of a flow is where denotes the instance index. Similarly, every element of is an instance of the corresponding element in .
During an execution of a SoC design, instances of the set of flows that it implements are executed. Suppose that the set of flow instances executed is . The following definition relates flow executions with event sequences.
Definition 2.3
Given a SoC design that implements a set of flows , an execution on its instances yields a trace such that
where is the set of events of flow instance .
From a trace, an execution of flow instances can be inferred by following the transition firing semantics of system flows defined above.
3 Communication Tracing
System execution typically involves a number of flow instances executed concurrently. In order to reconstruct flow executions off-chip, communication events involved in flow executions must be collected and off-loaded. Modern SoC designs are typically instrumented with extensive dfx circuitry for various debug functions. This section describes an on-chip infrastructure for real-time tracing of communication events during system execution. The architecture of this infrastructure is shown in Figure 2.
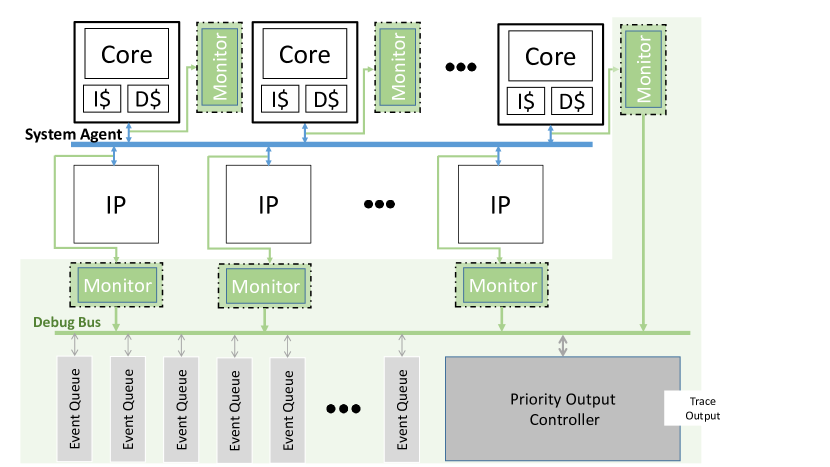
3.1 Communication Tracing Module (CTM)
The communication tracing module consists of communication monitors and an off-load unit. Communication monitors are attached to communication links of interest. A monitor observes signal events transferred on a link, and generates a communication event if a pattern on the observed signal events is recognized. A signal event is an assignment to a set of design signals. A flow event is an abstract construct used in flow specifications, and is typically implemented by a sequence of signal events. Communication events generated by monitors can be viewed as encodings of flow events in a SoC design. An important function of a monitor is to compress a sequence of signal events across a potentially large number of cycles into a single cycle communication event, which is beneficial to reduce the bandwidth demand on the trace interface. Once a communication event is detected, a monitor can selectively encode information that is useful for the off-chip analysis including operation commands, addresses, etc.
Communication events from monitors can be stored in the on-chip trace buffers, and off-loaded at the end of system execution. However, the on-chip trace buffers can only store a limited number of events due to their limited capacities. On the other hand, our communication tracing infrastructure includes an event off-load unit that can off-load events via trace ports on-the-fly, thus enabling system internal executions over an much extended period to be observed for off-chip analysis.
Since communcation events from monitors are typically distributed over time relatively sparsely, the off-load unit interleaves events, and off-loads them via the shared trace ports in a time-multiplexing manner. An issue with the interleaved approach is that the rate of events detected by monitors can exceed the peak bandwidth of the trace ports. In that case, certain events have to be dropped. The inability to off-load all events occurred during an execution can be viewed as another form of limited observability. In order to reduce the number of events that have to be discarded, output of each monitor is connected a queue that buffers events waiting for off-load. On every cycle, events from all monitors are stored into the corresponding queues. An output controller scans all event queues, and off-loads buffered events one at a time.
3.2 Limited Observability
As indicated in the previous section, limited bandwidth of trace ports may cause some communication events not to be observed. The frequency of event dropping is roughly affected by the gap between the rate of events generated by all monitors and the bandwidth of trace ports. The factors affecting the rate of communication event generation include the design micro-architecture, test programs used during debug, and the number of flows and flow events selected for observation. One simple technique to reduce the frequency of event dropping is large buffers for events waiting for output, but it leads to a large area overhead.
An important observation exploited in this paper is that some events are more important for understanding flow executions than others. If the less important events are not observed, then the whole trace port bandwidth can be dedicated to observing the more important events. Furthermore, not observing certain events may eliminate the need of observing certain communication links altogether. In that case, the corresponding monitors can be disabled, and the capacities of the associated event queues can be re-allocated to the queues for the links under observation. By increasing the queue capacities for the links under observation, the event droppings can be effectively reduced. This hypothesis about the relation between the number of links to observe and the event losses will be exploited and experimentally validated in the following sections. Next section presents metrics for evaluating importance of events, and methods for selecting important events to observe.
4 Flow Event Selection
As shown in the previous section, not observing less important events can help prevent important events from being dropped. In this section, importance of events is characterized by a number of coverage metrics for different debug purposes. After defining the coverage metrics, we describe communication event selection methods driven by those coverage metrics. The objective of these selection methods is to maximize the coverage metrics under the resource constraints of the communication tracing infrastructure. Unlike previous work on trace signal selection [4, 5], the methods presented in this section target selecting flow events for observation instead of individual design signals.
4.1 Selecting Flows to Observe
An critical activity performed in post-silicon stage is to validate application usage scenarios. In this activity, individual target usage scenarios, e.g., for a smartphone, playing videos or surfing the Web, while receiving a phone call, are exercised, while possible failures e.g., hangs, crashes, deadlocks, overflows, etc., are monitored. Usage scenario validation forms a key part of SoC integration validation. Each usage scenario usually involves interleaved execution of several flows among IPs in the SoC design, e.g.., a usage scenario that entails receiving a phone call in a smartphone when the phone is asleep involves flows among the antenna, power management unit, CPU, etc. Therefore, only the flow events of the involved flows in a usage scenarios are typically observed. As explained in the previous section, observing a restricted subset of events can reduce incidients of events being dropped.
4.2 Flow Execution Coverage Metrics
In this section, we consider the problem of characterizing the important or relevance of flow events by defining coverage metrics for different debug purposes.
The first metric is flow instance coverage (FIC), which is defined below.
| (1) |
where is the number of flow instances observed, and is the total number of flow instances executed. FIC defines a fraction of the number of flow instances actually observed versus the total number of flow instances executed. We say that a flow instance is observed in a trace if any event of that flow instance is observed in the trace. Note that the parameter is not essential when this metric is applied to evaluate different observabilities as all of them are evaluated assuming the same .
The purpose of FIC is to offer a metric to evaluate different observabilities to support a coarse-grained global view of system execution. In this coarse-grained global view, we are interested in all flow instances executed in the entire course of a debug run, instead of detailed execution of individual flow instances. It may provide valuable information about anomaly behavior in system execution, e.g., an unusually high number of wakeup calls to a CPU from the power management unit. In this case, we want to select an observability that maximize FIC. Obviously, one observability is better than another one if its FIC derived from an observed trace is higher.
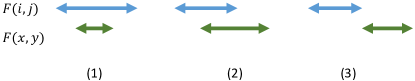
As explained in the introduction, many errors are due to intricate interleaved execution of flows, e.g., a firmware execution flow executed before a firmware authenticate flow completes, signaling a security breach. Therefore, the coarse-grained global view obtained by only observing flow instances is inadequate. Observed traces must capture sufficient information to allow interleaved execution of different flow instances to be extracted. The interleaving relations between two flow instances and are shown in Figure 3. In this figure, the length of arrows shows the duration of a flow instance execution, while the arrows at both ends indicate the time when a flow instance is initiated and when it completes. Figure 3 shows three possible interleavings: (1) starts before starts, and it completes after completes; (2) the initiation and completion of occur earlier that the initiation and completion of ; (3) completes before starts. An observability needs to be selected in order to support such interleavings to be captured on the observed traces. To evaluate different observabilities, we define the complete execution coverage (CEC) metric as below.
| (2) |
where is the number of complete flow instances extracted from an observed trace, and similarly is the total number of flow instances executed. A complete flow instance is observed if both its start and end events are found in the observed trace.
4.3 Coverage Driven Event Selection
This section presents observability selection methods driven by coverage metrics described in the previous section. The inputs to a selection method are a set of flows to observe and a coverage metric, and the output is a subset of flow events for observability that maximize the coverage metric.
To select an observability targeting coverage metric FIC, it is necessary to select a subset of flow events that cover all flows under observation such that an event in an observed trace can uniquely identify a flow instance. In practice, most SoC designs include architectural support for tagging, which allows uniquely identifying different flow instances from observing properly tagged events. Because of the unique correspondence between flow instances and observed events, all flow events are FIC-equivalent. Therefore, we aim to select a subset of events that maximizes the FIC.
Given a set of flows to observe, there can be many different selections of events of those flows. In order for the observed traces on the selected events to have high FIC, the losses of the selected events must be low. Recall the hypothesis presented in the previous section indicating that the losses of events can be reduced if the number of links under observation is reduced. By this hypothesis, for two sets of selected events, if the number of links to observe for one set of selected events is smaller than that of another set, then the former is preferred.
Next, we consider observability selection targeting the coverage metric CEC. In order for observed traces to have high CEC, the start and end events of all flow instances should be observable. Therefore, the start and end events of all flows to observe must be selected.
To facilitate more effective debug, it is necessary to know additional information beyond the initiation and completion of each flow instance. More specifically, it would be useful to know which path in the flow is followed when an instance of that flow is executed. Consider the flow in Figure 1 fpr an example. It has three possible execution paths. Observing only the start and end events (labelings of and ) is not sufficient to tell which execution path is actually followed. Given an observed trace shown below,
(CPU_x:Cache_x:wr_req), (Cache_x:CPU_x:wr_resp), …
we are not able to confirm whether it is a result of executing that flow following the rightmost path (, , , , ) or one of the other two paths with all the intermediate events not observed. To obtain the information on paths following by a flow execution, some unique event from each path needs to be selected. Consider the same flow example. Either one of needs to be selected in order to identify the leftmost or middle path. Moreover, one event from needs to be selected to identify the middle path. As the above illustration shows, there are different ways to select additional events to observe for detailed executions of a set of flows. Similarly, these different selections are evaluated based on the number of links that need to be observed for the selected events.
5 Experiments
5.1 The Model
To evaluate the presented framework, a non-trivial SoC design meeting the following requirements is desired.
-
•
It implements sophisticated system flows.
-
•
Flows are well documented.
-
•
On-chip communication fabric is concurrent, and can support multiple active flow executions in parallel.
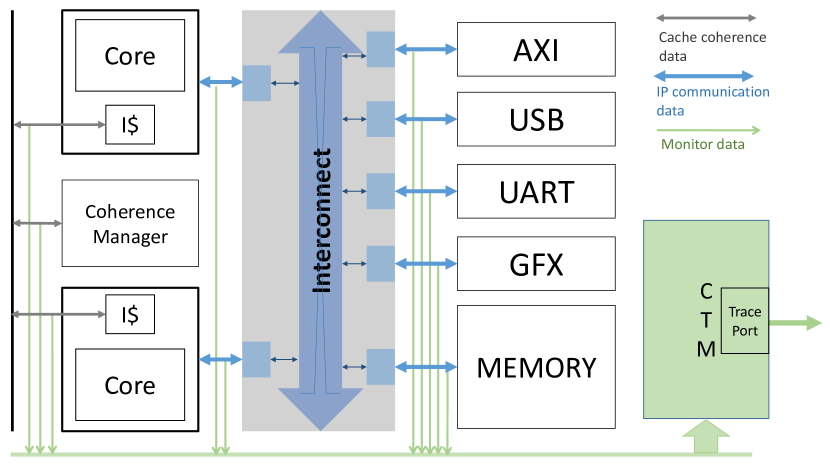
However, to the best of our knowledge, we cannot find an open-source design that meets the above requirements. Therefore, we developed a multi-core SoC prototype, as shown in Figure 4, to evaluate the proposed methods. Even though this model is simple compared to real SoC designs, it is much more sophisticated than the gate-level benchmark suites typically considered as targets for post-silicon debug research. In particular, while simplified, the system is representative of industrial complexity. All the flows are abstracted from real industrial protocols. Note that a typical industrial subsystem includes between and flows [3]. We implement a total of system-level flows, including cache coherence, power management, downstream read/write protocols for CPUs, upstream read/write for the peripheral blocks, etc. A different paper [6] details some of the flows.
We implemented this SoC as a cycle- and pin-accurate RTL model written in VHDL. The above system-level protocols are supported by block-level protocols based on the ARM AXI4-lite [7]. A total of monitors are inserted into this model guided by the implemented flows. Since the proposed framework is to support communication-centric debug, the focus of this model is the implementation of system flows for on-chip interconnect. The interconnect is a switch-based network, that allows multiple flow instances in-flight simultanenously. The CPUs are treated as test generators where software programs are simulated in VHDL. Therefore, there is no instruction cache. Blocks GFX, PMU, Audio, etc, are also described as abstract models that generate events to initiate flows or to respond incoming requests.
5.2 Experimental Results
The prototype is simulated in a random test environment where CPUs and three other peripheral blocks are programmed to randomly select a flow to initiate with a delay between 1 to 10 cycles. Each of these blocks activates 100 flow instances, and a total of flow instances are activated during the entire simulation.
| Scope | FIC | CEC |
|---|---|---|
| All | 470/500 (0.94) | 101/500 (0.202) |
| CPU | 192/200 (0.96) | 103/200 (0.515) |
| CPU0 | 100/100 (1) | 100/100 (1) |
Table 1 shows the experimental results when different flows are observed. Under the columns FIC and CEC, the numbers represent the ratios as defined in Section 4. The equivalent fractional numbers for are enclosed in parentheses. The second row shows the results when all flow instances are observed. The third row shows the results from observing only flows initiated by CPU0 or CPU1. The last row shows the results from observing only the flows initiated by CPU0. From the table, it can be seen that as the number of flows under observation decreases, the number of events that need to be observed for FIC and CEC decreases. This leads to reduced losses of events, which is reflected in the higher FIC and CEC values from row two to row four. Particularly, in the last row, all executed instances of the flows under observation can be precisely inferred.
| FIFO_SIZE | FIC | CEC |
|---|---|---|
| 8 | 470/500 (0.94) | 101/500 (0.202) |
| 16 | 490/500 (0.98) | 178/500 (0.356) |
| 32 | 499/500 (0.998) | 307/500 (0.614) |
In the second experiment, the impacts of different queue capacities are evaluated. All flows and all flow events are observed. Event dropping happens only when a queue becomes full. In this experiments, the capacities of event queues are increased gradually. This increase in queue capacity can simulate the situation where the number of links to observe is reduced and the queues of the non-observable links are re-allocated to the queues of links under observation. The results are shown in Table 2. It is noticeable that an increase in the size of queues leads to a significant improvement in FIC and CEC values of observed traces. These results validate the hypothesis described in Section 3.2.
| Selection method | #_Links | FIC | CEC |
|---|---|---|---|
| NO-SELECTION | 32(total) | 470/500 (0.94) | 101/500 (0.202) |
| SEL1 (FIC) | 8 | 500/500 (1) | 0/500 (0) |
| SEL2 (CEC) | 16 | 441/500 (0.882) | 200/500 (0.4) |
| SEL3 [6] | 16 | 466/500 (0.932) | 0/500 (0) |
Table 3 compares the result of the proposed flow event selection algorithm with another system level flow guided selection approach proposed in [6]. We generate two sets of selections guided by and individually ( and ) and compare their results with selection generated by [6]. And the results are evaluated by the previously mentioned two metrics and the numbers of links used. The second row - represents the analysis result when no selection method is applied, and all flow events on the 32 links are observed.
The on the third row is generated by our method that is primarily guided by the . In the beginning, several sets of flow events with the optimal effects (covering all flows) are generated, and within them we select the set with the minimal numbers of links required, that is in this situation. The result shows that the is improved to its maximum value . While on the other hand is reduced to . This is expected as is not considered for this selection. Then for the second selection , we considers the only and its result is shown in the fourth row. It first selects all 32 initiating and terminating events of all flows to enhance . Because several flow events are transferred on the same link (for example, both (CPU_0:Cache_0:wr_req) and (CPU_0:Cache_0:rd_req) are transferred on the same link), these events takes 12 links in total. Moreover, selects four flow events including and that indicates the path of a flow, as discussed in Section 4.3, occupying 4 links. Compared to the -, The result of takes only 16 links, and it shows significant improvement on the (almost double) as more start and end events are observed. Consequently, more details regarding the interleaving relationship of fired flow instances are revealed in . This improvement comes in the cost of less flow instances being observed, shown by the decrease in value.
The fifth row shows the result of using flow selection method from [6]. [6] proposes to rank each flow event by their Frequency Coverage () value in descending order, and apply greedy algorithm to select the optimal set of flow events. The considers the fact that some flow events are shared by multiple flows thus are always preferred. The concept of is very similar with as it enforces the maximum number of flows being covered for a set of flow events. However, the in [6] is different in two aspects: (1) it does not consider the number of links used for such selection. Consequently, the capacity improvement may not be as significant as our method where we always select the set with the minimal number of links; (2) Because considers each flow event individually, it is possible the selected combination of events achieves high coverage only on certain flows. While our method ensures that the selected flow event set covers all flows.
We applied the algorithm in [6] and selected top (half of the total link number) flow events with the highest . The result of , however, does not show any improvement compared to -, the actually reduced from to due to the two factors mentioned above. It is also to be noted for , each of the selected flow occupies one link individually, taking 16 links in total, that is double of . As a result, the of is comparably worse than both and -. On the other hand, none of the initiation and termination events are selected due to their uniqueness to their belonging flows (not shared by any other flows), leading to . This is expected as this algorithm does not consider special meanings of such critical events.
Area overhead. The SoC model is synthesized to the Xilinx Zynq FPGA xc7z020ckg484-1. The area overhead of the debug infrastructure is measured by the additional FPGA resources including LUTs, FFs, block RAMs (BRAMs), etc. From the obtained result, the demand on logic resources is small to implement the monitoring infrastructure; On tops of the original design area, this new implementation requires additional LUTs, FFs, and Muxs, that are , and of the original design area.
6 Related Work
Gharehbaghi and Fujita [8, 9, 10] describe transaction-level debug with an on-chip instrumentation that allows transaction level message abstraction using formal specifications of the bus communication protocols. Their approach does not check system-level protocols as it only focus on communication protocols among component interfaces. [11] presents another on-chip instrumentation BiPeD that learns communication interface’ protocol during pre-silicon stage, and reconfigure its detection hardware to check the learned protocols during the post-silicon validation. Similar to [8, 9, 10], interpreting the observed traces are not done at the system level. [12] presents a processor verification framework on an acceleration platform. Although both [12] and this paper consider interpretation of low level behavior on hardware signals at a higher level, [12] considers verification of individual processors, while this work targets post-silicon debug of SoC designs where processors are just some IP blocks. Since the work in [12] is developed for an acceleration platform, its monitoring infrastructure does not consider area restriction of the monitors. On the other hand, area overhead is a top restriction in our monitor design. Furthermore, the design under verification can be slowed down to match the speed of the monitors to make sure that all observed events can be outputted [12]. However, on-chip debug infrastructure cannot interfere with normal chip operations in the post-silicon environment where this work is positioned.
Previous work on trace signal selection such as [4] is typically applied to gate level design models, and the quality of the results is evaluated by the commonly used state restoration ratio. However, it is difficult to scale those methods to large and complex SoC designs. More importantly, signals selected at the gate level are often irrelevant to system-level functionalities. There is an attempt to raise the abstraction level for trace signal selection to the register transfer level (RTL) guided by assertions [5], however that work does not consider system level functionalities either. On the other hand, our framework considers selection of communication events guided by system-level protocols, instead of raw hardware signals. [13] proposed an similar concept where signal selection is conducted on system-level communication protocols. While [13] shows significant improvement compared to other low level based signal selection algorithms, its effect is mitigated by the resource limitation of the on-chip debug infrastructure. The selecting scheme proposed in [13] is guided by a metric that treat every communication protocol event equally. It failed to consider special events that are critical for an comprehensive interpretation of the system behavior. Furthermore, the algorithm in [13] requires the interleaving graph of all flow instances to generate a set of selection. Obtaining such interleaving graph requires the type and number of instances of each flow. Such requirement is impractical as itself is one of the critical information needed to be extracted during post silicon validation.
7 Conclusion
This paper describes several communication event selection methods aiming to boost flow execution coverages under limited observability. The observed traces on the selected communication events capture more comprehensive information to allow better understanding of the communications of components during system execution, thus facilitating debug. In the future, we plan to perform in-depth studies of the proposed methods on more complex SoC designs with diverse interconnects such as the RocketChip SoC design.
Acknowledgment The work presented in this paper is partially supported by a gift from the Intel Corporation.
References
- [1] S Yerramilli. Addressing post-silicon validation challenge: Leverage validation and test synergy. In Keynote, Intl. Test Conf, 2006.
- [2] Priyadarsan Patra. On the cusp of a validation wall. IEEE Des. Test, 24(2):193–196, March 2007.
- [3] M. Talupur, S. Ray, and J. Erickson. Transaction flows and executable models: Formalization and analysis of message-passing protocols. In FMCAD, pages 168–175, Austin, TX, 2015.
- [4] Kanad Basu and Prabhat Mishra. Efficient trace signal selection for post silicon validation and debug. In VLSI Design, pages 352–357. IEEE, 2011.
- [5] Sai Ma, Debjit Pal, Rui Jiang, Sandip Ray, and Shobha Vasudevan. Can’t see the forest for the trees: State restoration’s limitations in post-silicon trace signal selection. ICCAD ’15, pages 1–8, 2015.
- [6] Matthew Curtis Amrein. System-level trace signal selection for post-silicon debug using linear programming. Master’s thesis, 2015.
- [7] Amba axi and ace protocol specification. http://www.arm.com.
- [8] A. M. Gharehbaghi and M. Fujita. On-chip transaction level debug support for system-on-chips. In ISOCC, pages 124–127, Nov 2009.
- [9] A. M. Gharehbaghi and M. Fujita. Transaction-based debugging of system-on-chips with patterns. In ICCD’09, pages 186–192, Oct 2009.
- [10] A. M. Gharehbaghi and M. Fujita. Transaction-based post-silicon debug of many-core system-on-chips. In ISQED, pages 702–708, March 2012.
- [11] A. DeOrio, J. Li, and V. Bertacco. Bridging pre- and post-silicon debugging with biped. In ICCAD’12, pages 95–100, Nov 2012.
- [12] D. Chatterjee, A. Koyfman, R. Morad, A. Ziv, and V. Bertacco. Checking architectural outputs instruction-by-instruction on acceleration platforms. In DAC’12, pages 955–961. ACM, 2012.
- [13] D. Pal, A. Sharma, S. Ray, F. M de Paula, and S. Vasudevan. Application level hardware tracing for scaling post-silicon debug. In DAC’18, 2018.