DAMIC Collaboration
Constraints on Light Dark Matter Particles Interacting with Electrons from DAMIC at SNOLAB
Abstract
We report direct-detection constraints on light dark matter particles interacting with electrons. The results are based on a method that exploits the extremely low levels of leakage current of the DAMIC detector at SNOLAB of 2–610-22 A cm-2. We evaluate the charge distribution of pixels that collect for contributions beyond the leakage current that may be attributed to dark matter interactions. Constraints are placed on so-far unexplored parameter space for dark matter masses between 0.6 and 100 MeV . We also present new constraints on hidden-photon dark matter with masses in the range – eV .
There is overwhelming astrophysical and cosmological evidence for Dark Matter (DM) as a major constituent of the universe. Still, its nature remains elusive. The compelling Weakly Interacting Massive Particle (WIMP) dark matter hypothesis Kolb and Turner (1990) — implying DM is made of hitherto unknown particles with mass in the GeV–TeV scale — has been intensely scrutinized during the last two decades by detectors up to the tonne-scale looking for nuclear recoils induced by coherent scattering of WIMPs. Despite the impressive improvements in sensitivity, notably by noble liquid experiments Aprile et al. (2018); *akerib:2017; *agnes:2018, WIMPs have so far escaped detection. Other viable candidates include DM particles from a hidden-sector Battaglieri et al. (2017), which couple weakly with ordinary matter through, for example, mixing of a hidden-photon with an ordinary photon Okun (1982); *holdom:1985. A phenomenological consequence is that hidden-sector DM particles also interact with electrons, with sufficiently large energy transfers to be detectable down to DM masses of MeV Essig et al. (2012). Also, eV-mass hidden-photon DM particles can be probed through absorption by electrons in detection targets Hochberg et al. (2017).
The DAMIC (Dark Matter in CCDs) experiment Aguilar-Arevalo et al. (2016) is well-suited for a sensitive search of this class of DM candidates. DAMIC detects ionization events induced in the bulk silicon of thick, fully depleted Charge-Coupled Devices (CCDs). By exploiting the charge resolution of the CCDs ( ) and their extremely low leakage current ( ), DAMIC has already placed constraints on hidden-photon DM with masses in the range – eV Aguilar-Arevalo et al. (2017) with data collected in a preliminary science run. In this Letter we apply a similar approach to explore DM- interactions with high-quality data from the DAMIC science run at the SNOLAB underground laboratory. We also present improved limits on hidden-photon DM particles.
To model DM- interactions we follow Ref. Essig et al. (2016) where the bound nature of the electrons and crystalline band structure of the target are properly taken into account. The differential event rate in the detector for a DM mass , with transferred energy , and momentum is parametrized as
| (1) |
where is a reference cross section for free electron scattering, includes properties of the incident flux of galactic DM particles, is the dark matter form factor, and the crystal form factor quantifies the atomic transitions of bound-state electrons.
The DM form factor expresses the momentum-transfer dependence of the interaction, generically introduced as {}. The case corresponds to point-like interactions with heavy mediators or a magnetic dipole coupling, the case to an electric dipole coupling, and to massless or ultra-light mediators. The crystal form factor encodes target material properties and is calculated numerically from a density functional theory (DFT) approach, with results taken from Ref. Essig et al. (2016) for silicon.
The DAMIC detector has taken data at SNOLAB since 2017 with seven CCDs (4k 4k-pixel, 15 15 m2 pixel size, 675 m thick for 6.0 g mass each). The devices are fully depleted and a drift field is maintained across the CCD thickness by the application of 70 V to a thin backside contact. The CCDs are operated at K (stable to within K) inside a copper vacuum vessel kept at 10-6 mbar. The CCD tower is shielded on all sides by at least 18 cm of lead, with the innermost 5 cm of ancient origin, and 42 cm of polyethylene to stop background radiation from environmental rays and neutrons, respectively. Each CCD is read out serially by three-phase clocking, which first moves the charge in rows of pixels vertically (-direction) into the serial register. Then, single pixels are shifted horizontally (-direction) into the readout node, a charge to voltage amplifier located at a corner of the device. A second readout node at the opposite end of the serial register is also read out synchronously, providing a correlated noise-only measurement. An analog-to-digital converter (ADC) measures the readout node voltage, giving a pixel value in analog-to-digital converter units (ADU) linearly proportional to the number of charges in the pixel. The CCDs are individually calibrated in-situ by a red LED, with conversion constants ADU/. The standard mode of data taking consists of 30 ks ( 8.3 hours) long exposures followed by readout. “Blank” images with a much shorter 30 s exposure are also taken immediately after each long exposure as a systematic check of the device operation. Details of device architecture, DAMIC infrastructure, calibration, and image processing are given in Refs. Aguilar-Arevalo et al. (2016, 2017).
The search reported here was performed on a special data set consisting of 38 exposures, each 100 ks ( 1.16 days) long, collected in late 2017. This longer exposure time allows for a more precise determination of the leakage current. The data were acquired with 1 100 binning, a readout mode where the charges of 100 consecutive pixels in a column are summed into the serial register before readout. The binned pixel size is thus 15 1500 m2. Since readout noise is introduced each time the charge is measured, a better signal-to-noise ratio in the measurement of the charge collected over multiple pixels is achieved by binning. Hereafter, the term pixel will refer to a binned pixel. Each image contains 4272 193 pixels, with a subset of 4116 42 pixels corresponding to the active area of the CCD. The extra pixels, referred to as the and overscans, do not contain any charge since they are the result of clocking the CCD past the active region.

Image processing begins with subtraction of the constant offset (“pedestal”) present in each pixel introduced by the electronics chain. The pedestal is estimated on a per-row basis as the mean value of pixels in the -overscan. To exclude an instrumental increase in transient noise at the boundaries of the CCDs, the analysis is restricted to 2500 columns in a central portion of the image. To remove correlated readout noise, we subtract from every pixel an appropriate linear combination of corresponding pixel values in the noise images acquired with the aforementioned second readout node. The subtraction coefficients are calculated to minimize the variance of the pixel noise. The resulting image noise is found to be as reported in Table 1.
Physical defects in the silicon lattice structure of the CCDs often result in localized regions of high dark current, generating hot pixels and columns recurring over multiple images. A mask obtained from a statistical analysis of 864 images of the full-science data set (see details of the methodology in Ref. Aguilar-Arevalo et al. (2017)) is applied, resulting in the removal of 0.25% of pixels.
Clusters of pixels with signal larger than 8 , arising from ionization events by particles Aguilar-Arevalo et al. (2016) that deposit more than eV, are also excluded as to limit the analysis to leakage current and signals from light dark matter. To mitigate the effect of charge trailing along rows from charge transfer inefficiency in the serial register, 200 pixels to the left of every cluster are masked along with 4 pixels to the right. Each pixel above and below these clusters is also masked to account for charge splitting across rows due to diffusion. This procedure removes 2.0% of pixels.
After applying these image processing and pixel selection procedures, we calculate the mean value of pixels in each row over the 38 images of the data set (Fig. 1). Rows 43 and higher correspond to the overscan, where is consistent with zero. CCD data are contained in the first 42 rows of the image, where an offset is clearly present due to charge collected by the pixels. CCD numbers 2, 6 and 7 present a significantly higher leakage current that is non-uniform across the rows. This is likely due to external sources — e.g. optical or IR photons in the vessel — and inconsistent with DM which would produce charge uniformly distributed throughout the pixel array. Thus these CCDs are not considered any further in this analysis. For the four remaining CCDs, the analysis is restricted to rows 1-36 where is found to be constant within uncertainty. The final selected region includes 3.2106 pixels for each of the four CCDs, with their corresponding pixel value distributions shown in Fig. 2. The total equivalent exposure of the search is 200 g d.
The distribution of pixel values in a CCD is shown in Fig. 2 and is modeled by the function , which comes from the convolution of the pixel charge with the pixel readout noise. We take the pixel charge to be the sum of a Poisson-distributed leakage current accumulated during the exposure and a DM signal derived from Eq. 1, where specifies the probability to produce charges in a pixel from specific DM interactions. The readout noise is parametrized from the pixel value distribution of blanks and overscans, and found to be well-described by the convolution of a Poisson with average and a Gaussian of standard deviation . This parametrization reflects the presence of non-Gaussian features in the noise distribution. The pixel value distribution for a given CCD is then derived as:
| (2) | ||||
| (3) |
where is the number of pixels in the dataset, is the number of charges in a pixel from the DM signal and leakage current, is the number of charges in a pixel from readout shot noise, is the to ADU calibration constant, and is an offset accounting for pedestal subtraction. The noise parameters , and reported in Table 1 are determined from a fit of the blanks and -overscans. We then perform a maximum likelihood fit of the data to the leakage-only model (i.e. no contribution from DM- interactions, corresponding to and ) with and constrained with Gaussian penalty terms. The leakage current parameter derived from the leakage-only best-fit value of is reported in Table 1; and from the constrained fit were found to be consistent with the blank and -overscan values. Notice that represents an upper limit to the leakage current, with e-mm -2 d-1 ( 210-22 A cm-2) for CCD 4, the lowest ever measured in a silicon device.
| CCD n. | ||||
|---|---|---|---|---|
| [e-] | [e- mm-2 img-1] | [e-] | [e- mm-2 d-1] | |
| 1 | 1.628(1) | 8.2(2) | -0.185(3) | 2.8(2) |
| 3 | 1.572(1) | 7.8(2) | -0.160(4) | 1.7(2) |
| 4 | 1.594(1) | 10.0(2) | -0.219(4) | 1.0(2) |
| 5 | 1.621(1) | 8.5(2) | -0.183(4) | 2.0(2) |
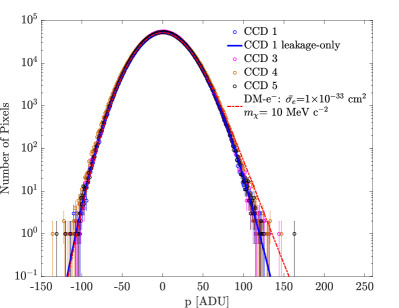
The DM signal is computed using Eq. 1. We obtain the distribution of from the binned output of the QEDark Essig et al. (2016); Yu et al. (2019) module written for the QuantumEspresso Giannozzi et al. (2009) DFT code. To compute we assume halo parameters of dark matter density GeV cm-3, an isothermal Maxwellian velocity distribution with escape velocity vesc = 544 km s-1 and mean v0 = 220 km s-1, and periodic Earth motion with mean velocity vE = 232 km s-1 Lewin and Smith (1996). The resulting ionization rate is then discretized into , where is the number of ionization charges. For this purpose we use Monte-Carlo-derived probabilities to produce electron-hole (e-h) pairs, informed from studies in Ref. Alig et al. (1980); *alig1983scattering, with the assumption that the initial energy deposit is split randomly between the e-h pair. Measurements of direct charge injection Chang et al. (1985); Scholze et al. (1998) validate the quantum yield of these prescriptions for deposits eV; these prescriptions also match the Fano factor Fano (1947) measured with similar CCDs in Ref. Ramanathan et al. (2017). The ionization rate is then obtained from . Lastly, the effect of charge diffusion in the CCDs is included. In fact, a point-like charge deposit in the silicon bulk of the CCD may split over several pixels due to diffusion of the ionized charge as it drifts towards the pixel array. To derive the effective signal distribution, point-like charge deposits uniformly distributed across the depth of the CCD are simulated according to . The charges are then distributed in the - pixel array following the spatial variance from a diffusion model derived from data Aguilar-Arevalo et al. (2016), and a distribution of charges collected by a pixel is obtained. The procedure is repeated 1000 times to obtain the numerical distribution for the DM signal . Examples of the DM model and leakage-only expectations are shown in Fig. 2.
To constrain the DM signal, we implement a likelihood analysis in ( ) space. For a fixed and for every CCD we minimize the negative log-likelihood of , leaving as a free parameter while and are constrained to within their uncertainty (Table 1), and report the total log-likelihood .
We find that non-zero values of are preferred for DM masses above a few MeV . This is mostly due to the presence of a few pixels with values in the positive tail of the distribution (Fig. 2), consistent with the higher charge multiplicity expected for larger . However, the presence of a similar tail in the negative side of the distribution and of similar features in the blank images suggest a noise origin. In Table 2, we report the number of pixels found in the negative and positive tails of the distribution. The thresholds for the tails were chosen appropriately to obtain an expectation of two pixels from the fit with the leakage-only model. There is evidence for an overall excess with comparable numbers on both sides of the distribution and between blank and exposure images. We conclude that the preference for non-zero values of in the fit is due to an imperfect modeling of the extreme tails of the noise distribution. Since we do not attempt to parametrize these tails further, more conservative limits are placed when the minimum of the total log-likelihood, , is found at a non-zero value of . For each we obtain 90% C.L. constraints on using the test statistic .
| CCD no. | 1 | 3 | 4 | 5 |
|---|---|---|---|---|
| (negative tail) / (positive tail) | ||||
| Exposures | 1 / 3 | 2 / 4 | 5 / 5 | 3 / 2 |
| Blanks | 3 / 5 | 4 / 1 | 2 / 1 | 2 / 3 |
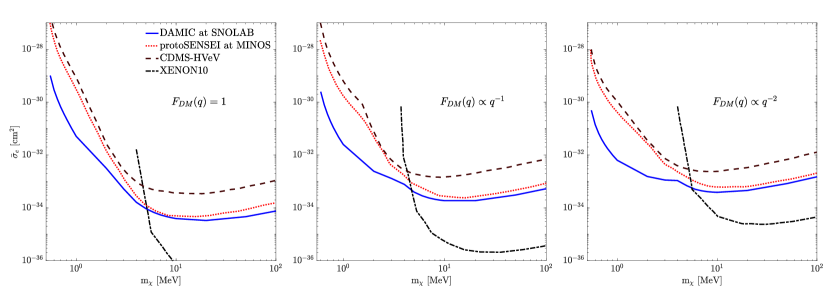
The 90% C.L. constraints on the DM- cross section from this analysis are compared in Fig. 3 to the current best direct-detection limits in Refs. Abramoff et al. (2019); Essig et al. (2017); Agnese et al. (2018); Emken et al. (2019). Complementary limits for heavier DM masses from noble liquid experiments can be found in Ref. Aprile et al. (2019); *agnes:2018:dme. Note that for a high enough DM- cross section the DM flux at SNOLAB would be drastically reduced by interactions in the rock overburden Emken et al. (2019). However, this region has already been excluded by experiments at shallower sites Emken et al. (2019). Other constraints from analyses based on astrophysical modifications to the dark matter speed distribution can be found in Ref. Ema et al. (2019); *an2018directly.
Several checks are performed to evaluate the robustness of the results. A 5% systematic uncertainty in the linearity of the calibration constant changes the limits by 20% for below few MeV . We modify the ionization model by splitting the energy equally between the e-h or assigning it entirely to one of them, with limits changing by 10% for below few MeV . Lastly, we perform the analysis with different central portions of the CCD image, with limits changing by 10%.
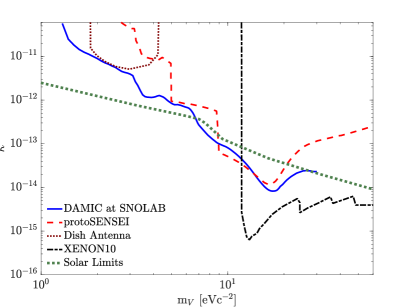
Our previous constraints on hidden-photon dark matter Aguilar-Arevalo et al. (2017) were obtained with a method analogous to the one presented in this Letter. The lower leakage current and larger exposure of this data set result in more stringent constraints. The corresponding 90% C.L. upper limits on the hidden-photon kinetic mixing parameter (also known as in literature) as a function of the hidden-photon mass are shown in Fig. 4.
In summary, we have established the best direct-detection limits on dark matter-electron scattering in the mass range of 0.6 MeV to 6 MeV by exploiting the excellent charge resolution and extremely low leakage current of DAMIC CCDs. We also place the best direct-detection constraints on hidden-photon dark matter in the mass range – eV . Further improvements with the SNOLAB apparatus will be explored by cooling the CCDs to 100 K and improving the light tightness of the cryostat, which may sensibly reduce the leakage current. Improvements of several orders of magnitude are expected with DAMIC-M, a kg-size detector with sub-electron resolution to be installed at the Laboratoire Souterrain de Modane in France Settimo (2018).
We thank Rouven Essig, Tien-Tien Yu, and Tomer Volansky for assistance with the theoretical background of DM- scattering, and Chris Kouvaris for pointing to limit calculations for the overburden. We thank SNOLAB and its staff for support through underground space, logistical and technical services. SNOLAB operations are supported by the Canada Foundation for Innovation and the Province of Ontario Ministry of Research and Innovation, with underground access provided by Vale at the Creighton mine site. We acknowledge the financial support from the following agencies and organizations: Kavli Institute for Cosmological Physics at The University of Chicago through an endowment from the Kavli Foundation; National Science Foundation through Grant No. NSF PHY-1806974; Mexico’s Consejo Nacional de Ciencia y Tecnología (Grant No. 240666) and Dirección General de Asuntos del Personal Académico - Universidad Nacional Autónoma de México (Programa de Apoyo a Proyectos de Investigación e Innovación Tecnológica Grant No. IN108917).
References
- Kolb and Turner (1990) E. W. Kolb and M. S. Turner, Front. Phys. 69, 1 (1990).
- Aprile et al. (2018) E. Aprile et al. (XENON Collaboration), Phys. Rev. Lett. 121, 111302 (2018).
- Akerib et al. (2017) D. S. Akerib et al. (LUX Collaboration), Phys. Rev. Lett. 118, 021303 (2017).
- Agnes et al. (2018a) P. Agnes et al. (DarkSide Collaboration), Phys. Rev. D 98, 102006 (2018a).
- Battaglieri et al. (2017) M. Battaglieri et al., arXiv:1707.04591 [hep-ph] (2017), and references therein.
- Okun (1982) L. B. Okun, Sov. Phys. JETP 56, 502 (1982), [Zh. Eksp. Teor. Fiz. 83, 892 (1982)].
- Holdom (1986) B. Holdom, Phys. Lett. B166, 196 (1986).
- Essig et al. (2012) R. Essig, J. Mardon, and T. Volansky, Phys. Rev. D 85, 076007 (2012).
- Hochberg et al. (2017) Y. Hochberg, T. Lin, and K. M. Zurek, Phys. Rev. D 95, 023013 (2017).
- Aguilar-Arevalo et al. (2016) A. Aguilar-Arevalo et al. (DAMIC), Phys. Rev. D D94, 082006 (2016).
- Aguilar-Arevalo et al. (2017) A. Aguilar-Arevalo et al. (DAMIC), Phys. Rev. Lett. 118, 141803 (2017).
- Essig et al. (2016) R. Essig, M. Fernández-Serra, J. Mardon, A. Soto, T. Volansky, and T.-T. Yu, Journal of High Energy Physics 2016, 46 (2016).
- Yu et al. (2019) T.-T. Yu, T. Volansky, and J. Tiffenberg, Private communication; provision of differential rate spectra (2019).
- Giannozzi et al. (2009) P. Giannozzi et al., Journal of physics: Condensed matter 21, 395502 (2009).
- Lewin and Smith (1996) J. Lewin and P. Smith, Astroparticle Physics 6, 87 (1996).
- Alig et al. (1980) R. Alig, S. Bloom, and C. Struck, Phys. Rev. B 22, 5565 (1980).
- Alig (1983) R. C. Alig, Phys. Rev. B 27, 968 (1983).
- Chang et al. (1985) C. Chang, C. Hu, and R. W. Brodersen, Journal of Applied Physics 57, 302 (1985).
- Scholze et al. (1998) F. Scholze, H. Rabus, and G. Ulm, J. Appl. Phys. 84, 2926 (1998).
- Fano (1947) U. Fano, Phys. Rev. 72, 26 (1947).
- Ramanathan et al. (2017) K. Ramanathan et al., Physical Review D 96, 042002 (2017).
- Abramoff et al. (2019) O. Abramoff et al. (SENSEI Collaboration), Phys. Rev. Lett. 122, 161801 (2019).
- Emken et al. (2019) T. Emken, R. Essig, C. Kouvaris, and M. Sholapurkar, arXiv:1905.06348 [hep-ph] (2019).
- Agnese et al. (2018) R. Agnese et al. (CDMS Collaboration), Phys. Rev. Lett. 121, 051301 (2018).
- Agnese et al. (2019) R. Agnese et al. (CDMS Collaboration), Phys. Rev. Lett. 122, 069901 (2019).
- Essig et al. (2017) R. Essig, T. Volansky, and T.-T. Yu, Phys. Rev. D 96, 043017 (2017).
- Bloch et al. (2017) I. M. Bloch, R. Essig, K. Tobioka, T. Volansky, and T.-T. Yu, Journal of High Energy Physics 2017, 87 (2017).
- Suzuki et al. (2015) J. Suzuki, T. Horie, Y. Inoue, and M. Minowa, JCAP 1509, 042 (2015).
- An et al. (2013) H. An, M. Pospelov, and J. Pradler, Phys. Lett. B725, 190 (2013), arXiv:1302.3884 [hep-ph] .
- Redondo and Raffelt (2013) J. Redondo and G. Raffelt, JCAP 1308, 034 (2013), arXiv:1305.2920 [hep-ph] .
- Aprile et al. (2019) E. Aprile et al., arXiv:1907.11485 [hep-ex] (2019).
- Agnes et al. (2018b) P. Agnes et al. (DarkSide Collaboration), Phys. Rev. Lett. 121, 111303 (2018b).
- Ema et al. (2019) Y. Ema, F. Sala, and R. Sato, Phys. Rev. Lett. 122, 181802 (2019).
- An et al. (2018) H. An, M. Pospelov, J. Pradler, and A. Ritz, Phys. Rev. Lett. 120, 141801 (2018).
- Settimo (2018) M. Settimo, in Proceedings of the 53rd RENCONTRES DE MORIOND, Cosmology, edited by E. Augé, J. Dumarchez, and J. T. Thanh Vân, Moriond (ARISF, 2018) pp. 315–318.