17-Jun-2019 \Accepted24-Jul-2019 \Publishedpublication date
3-1-1 Yoshinodai, Chuo-ku, Sagamihara, Kanagawa 252-5210, Japan 22affiliationtext: Department of Astronomy, The University of Tokyo, Bunkyo, Tokyo 113-0033, Japan33affiliationtext: National Radio Astronomy Observatory, Socorro, NM 87801-0387, USA44affiliationtext: College of Arts and Sciences, J.F. Oberlin University, Machida, Tokyo 194-0294, Japan55affiliationtext: National Astronomical Observatory of Japan, Mitaka, Tokyo 181-8588, Japan66affiliationtext: Japan Space Forum, Kanda-surugadai, Chiyoda-ku,Tokyo,101-0062, Japan
accretion, accretion disks—Galaxy: center — black hole: formation
Rotating Ionized Gas Ring around the Galactic Center IRS13E3
Abstract
We detected a compact ionized gas associated physically with IRS13E3, an Intermediate Mass Black Hole (IMBH) candidate in the Galactic Center, in the continuum emission at 232 GHz and H30 recombination line using ALMA Cy.5 observation (2017.1.00503.S, P.I. M.Tsuboi). The continuum emission image shows that IRS13E3 is surrounded by an oval-like structure. The angular size is ( cm cm). The structure is also identified in the H30 recombination line. This is seen as an inclined linear feature in the position-velocity diagram, which is usually a defining characteristic of a rotating gas ring around a large mass. The gas ring has a rotating velocity of km s-1 and an orbit radius of cm. From these orbit parameters, the enclosed mass is estimated to be . The mass is within the astrometric upper limit mass of the object adjacent to Sgr A∗. Considering IRS13E3 has an X-ray counterpart, the large enclosed mass would be supporting evidence that IRS13E3 is an IMBH. Even if a dense cluster corresponds to IRS13E3, the cluster would collapse into an IMBH within years due to the very high mass density of . Because the orbital period is estimated to be as short as yr, the morphology of the observed ionized gas ring is expected to be changed in the next several decades. The mean electron temperature and density of the ionized gas are K and cm-3, respectively. Then the mass of the ionized gas is estimated to be .
1 Introduction
Sagittarius A∗ (Sgr A∗) is the galactic nucleus of the nearest spiral galaxy, Milky Way, and harbors the Galactic Center black hole (GCBH) with (e.g. [Boehle et al. (2016)], [Abuter et al. (2018)]). This region is a precious laboratory for studying activities and structures of galactic nuclei because peculiar phenomena which will be found in the nuclei of external galaxies by future huge telescopes can be observed by Atacama Large Millimeter/Submillimeter Array (ALMA) here. New ones have been discovered in succession since ALMA has started to observe Sgr A∗ and the surrounding region (e.g. [Moser et al. (2017)], [Tsuboi et al. (2017b)], [Yusef-Zadeh et al. (2017a)], [Yusef-Zadeh et al. (2017b)]). Although the activity of Sgr A∗ must be supported by the gravitational energy release of the material accreting to the GCBH, it is an open question how the GCBH acquires the material up to the present huge mass. There are two possibilities about the growth history of the GCBH. The first one is that very dense and massive gas blobs had fallen to the GCBH. This is a simple scenario but it has several issues to grow the GCBH to the present mass. Even if gas blobs are accreting continuously to the GCBH within the Hubble time, the accretion rate is required to be up to . This is several orders of magnitude larger than the present estimated rate from observations (e.g. [Agol (2000)], [Quataert & Gruzinov (2000)]). The very high accretion rate requires a quite low radiation efficiency of for Sgr A∗.
On the other hand, there is a possibility that the accretion rate may have been much higher in the past caused by any episodic large accretion event, for example, the formation of the Fermi Bubbles (Su, Slatyer,& Finkbeiner, 2010) and it has decreased to the present rate.
The second one is that several heavy compact bodies, stellar-mass black holes and/or intermediate mass black holes (IMBHs), had fallen and merged into the GCBH. First of all, it is required that there are such objects in the surrounding region of Sgr A∗. Recent X-ray observations have already revealed a dozen stellar-mass black holes around Sgr A∗ (Hailey et al., 2018). However, it is an open question in the latter case (Cf. Schödel et al. (2005), Paumard et al. (2006), Genzel et al. (2010), Oka et al. (2016)).
In our previous study, we detected a peculiar ionized gas flow associating with the Galactic Center IRS13E complex which is located to the southwest of Sgr A∗ by cm ( pc) in projection (Tsuboi et al., 2017b). The ionized gas flow has a very large velocity width ( km s-1) and a very compact size ( cm) in the complex. An extended ionized gas component connecting with the compact component has also been found. A hypothesis explains that this uncommon ionized gas system is a continuous gas flow orbiting on a high-eccentricity Keplerian orbit around IRS13E3 embedded in the complex. The enclosed mass is estimated to be M⊙ by the analysis of the orbit, which is within the mass range of an IMBH. However, the Keplerian orbit parameters derived from the complicated trajectory in the position-velocity diagram should involve large ambiguity.
If IRS13E3 is an IMBH, an ionized gas ring would be rotating around it. ALMA is able to get the spatial and velocity resolved image of the disk. If the rotating ring is discovered, the enclosed mass derived with the simple structure must be reliable. This would be stronger evidence that the IMBH exists in the complex. We have searched such ionized gas with ALMA in order to prove our hypothesis that IRS13E3 is an IMBH. Throughout this paper, we adopt 8.0 kpc as the distance to the Galactic center (e.g.Ghez et al. (2008), Gillessen et al. (2009), Schödel, Merritt,& Eckart (2009), Boehle et al. (2016)): corresponds to cm and 0.04 pc at the distance.
2 Observation and Data Reduction
We observed the area including Sgr A∗ and the IRS 13E complex at 230 GHz as an ALMA Cy.5 program (2017.1.00503.S. PI M.Tsuboi). The field of view (FOV) is centered at = and = , which is a nominal center position of Sgr A∗. The diameter of the FOV is in FWHM. The center frequencies of the spectral windows are and GHz, respectively. The last spectral window covers the H30 recombination line (231.9 GHz). The frequency coverage and frequency resolution are 2.0 GHz and 15.625 MHz, respectively. The velocity resolution corresponds to a velocity width of km s-1, which approximately corresponds to the thermal velocity width of ionized gas at K. The observations were performed in ten days from 5 Oct. 2017 to 20 Oct. 2017. The observation epochs were in the period of the longest baseline antenna configuration of ALMA. J1744-3116 and J1752-2956 were used as a phase calibrator. The flux density scale was determined using J1924-2914.
We performed the data analysis by Common Astronomy Software Applications (CASA) (McMullin et al., 2007). Before imaging in the recombination line, the continuum emissions of Sgr A∗ and the Galactic Center Mini Spiral (GCMS) were subtracted from the data using CASA task, uvcontsub (fitorder=1) for the combined data in the ten-day observations. The imaging to obtain channel maps was done using CASA 5.4 with clean task. We also got the line-free continuum data using this task. This data was used for the continuum imaging shown below. We will show the full results including the resultant continuum maps of the other three spectral windows in another publication. The angular resolution using “natural weighting” is . The sensitivities of the original velocity width channels are Jy beam-1 or 2.3 K in in the emission-free areas. The sensitivity is slightly worse than the expected one by the ALMA sensitivity calculator because there are yet unavoidable sidelobes of Sgr A∗ in the channel maps.
The flux density of Sgr A∗ changed significantly in the observation epochs although such variability had been reported (e.g. Miyazaki, Tsutsumi & Tsuboi (2004)). The flux density in the first seven days (from 5 Oct. 2017 to 14 Oct. 2017) was around Jy. On the other hand, the flux density in the last three days (from 16 Oct. 2017 to 20 Oct. 2017) was around Jy. Such significant flux density change might make some artifacts including unavoidable sidelobe effects in the continuum map from the combined data. We used only the data of the first seven days to produce the resultant continuum map here. In addition, the data with the baselines over 11 km is removed because this seems to increase the sidelobe effects in the continuum map.The complex gain errors of the data were minimized using the “self-calibration” method in CASA.The “self-calibration” method give us to obtain a high dynamic range in the continuum map. The angular resolution using “natural weighting” is , which is almost the same as that of the channel maps. The sensitivity is Jy beam-1 or 1.3 K in in the emission-free areas. Although the sidelobe effects still remain around Sgr A∗, the dynamic range reaches to in the other areas of the map.
3 Results
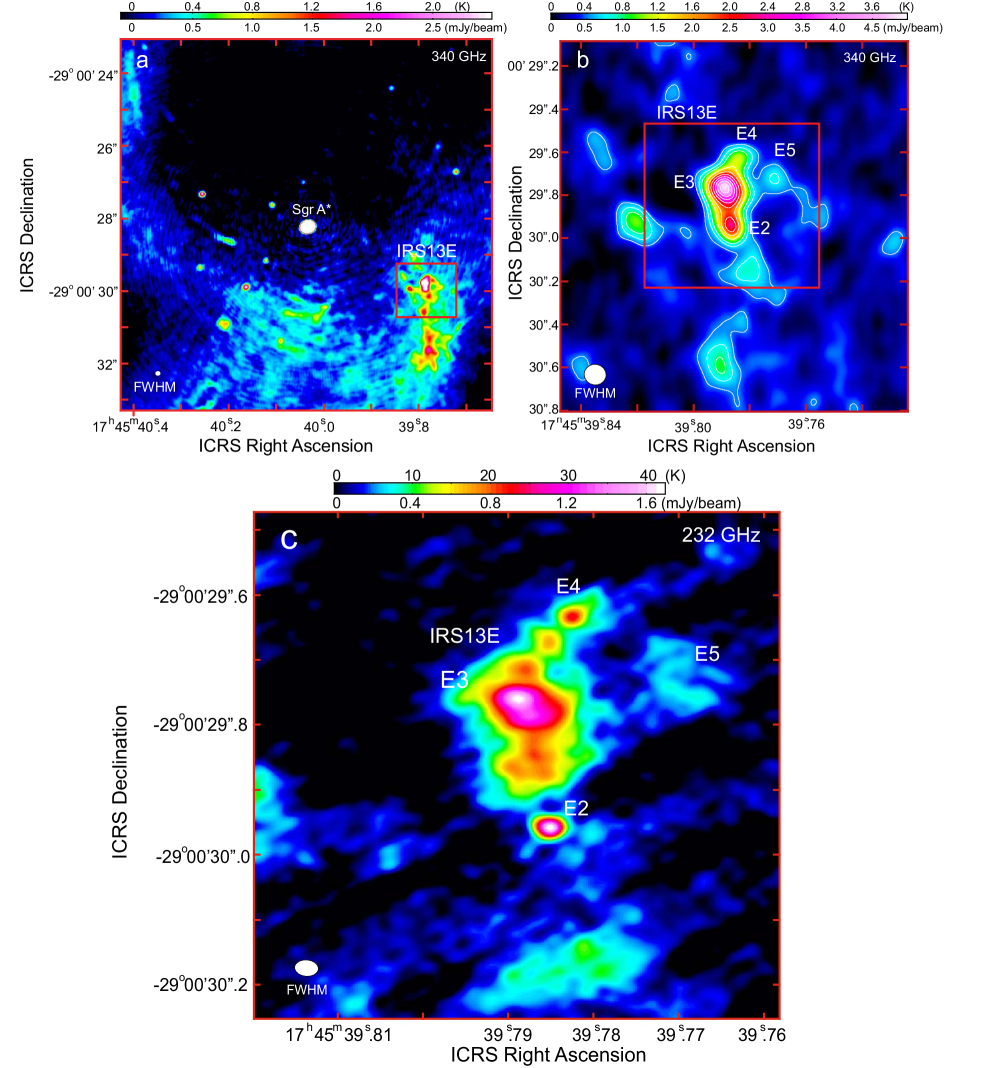
Figure 1a shows the continuum map of the vicinity of Sgr A∗ at 340 GHz (Tsuboi et al., 2017b). Figure 1b shows the close-up view of the GC IRS13E complex at 340 GHz, of which area is shown as the rectangle in Figure 1a. These are finding charts of IRS13E3 in the complex. The angular resolution is in FWHM. The complex is resolved into a group of compact objects in the maps. Most of these objects are the IR objects identified in the previous observations (e.g. Maillard et al. (2004), Schödel et al. (2005), Paumard et al. (2006)). The strongest component is IRS13E3. Figure 1c shows the continuum map at 232 GHz of the IRS13E complex by this observation. The map area is shown as the rectangle in Figure 1b. The angular resolution is in FWHM, which is shown as the oval at the lower left corner. IRS13E3 is clearly resolved into an inclined oval-like structure which is elongated in the direction of northeast to southwest. The angular source size of the structure is derived to be , by the two-dimensional Gaussian fit including beamsize correction. These correspond to cm cm at the the Galactic center distance. The total flux density of the oval-like structure is mJy. The flat spectrum in mm wavelength suggests that the emission is an optically thin free-free emission (Tsuboi et al., 2017b). Moreover, finer structures are identified in the oval-like structure. The intensity peak of IRS13E3 at 232 GHz is located around the northeast side of the oval-like structure. The position is , . The peak flux density is mJy beam-1.
A ridge-like structure extending from south to north crossing the oval-like structure is also identified in Figure 1c. This is probably a counter part of the ionized gas flow orbiting on a Keplerian orbit around IRS13E3, which has been identified in the previous observation (Tsuboi et al., 2017b). The major axis of the oval-like structure is not parallel to the central axis of the extended gas flow and the crossing angle is about . The total flux density of the extended gas flow is mJy. There are also the components corresponding to the famous Wolf-Rayet stars, IRS13E2 and IRS13E4, which have no spread larger than the beam size.
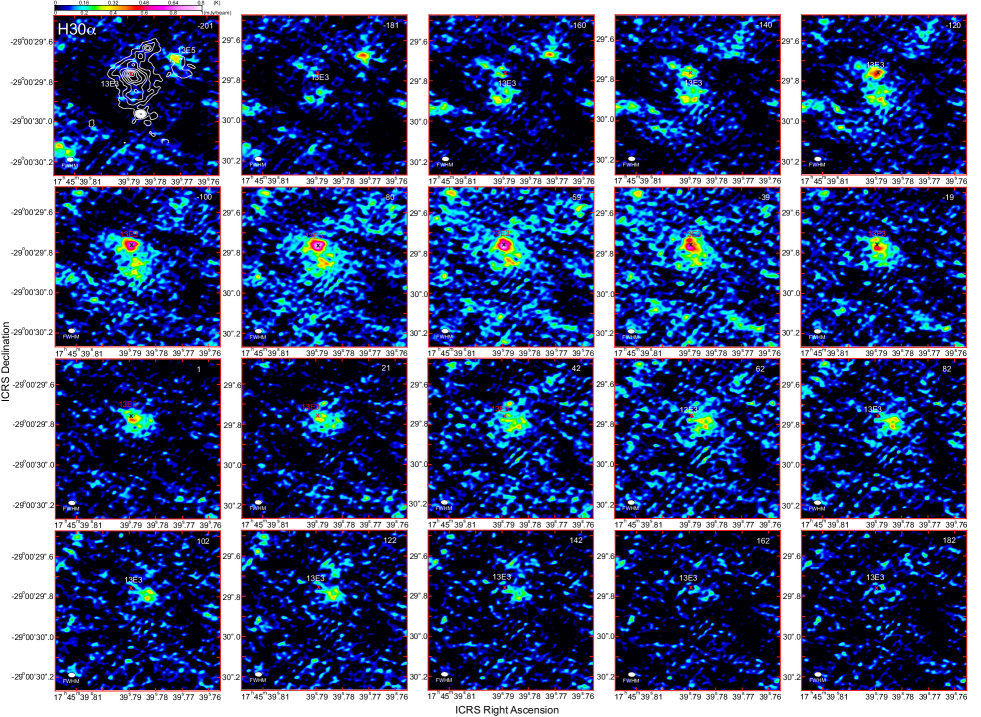
Figure 2 shows the channel map of the vicinity of IRS13E3 in the H30 recombination line with the central velocities ranging from to km s-1. The map area is the same as Figure 1c. The angular resolution of these maps is in FWHM. The velocity width of the channel maps is km s-1. The contours in Figure 2 (the upper-right panel) shows the continuum emission of IRS13E3 at 232 GHz for comparison (see Figure 1c). Ionized gas components corresponding to the oval-like structure of IRS13E3 are identified in these maps. The components positionally shift from northeast to southwest along the major axis of the oval-like structure with increasing velocity. The component with negative velocity of to 1 km s-1 is brighter than that with positive velocity of to 182 km s-1.
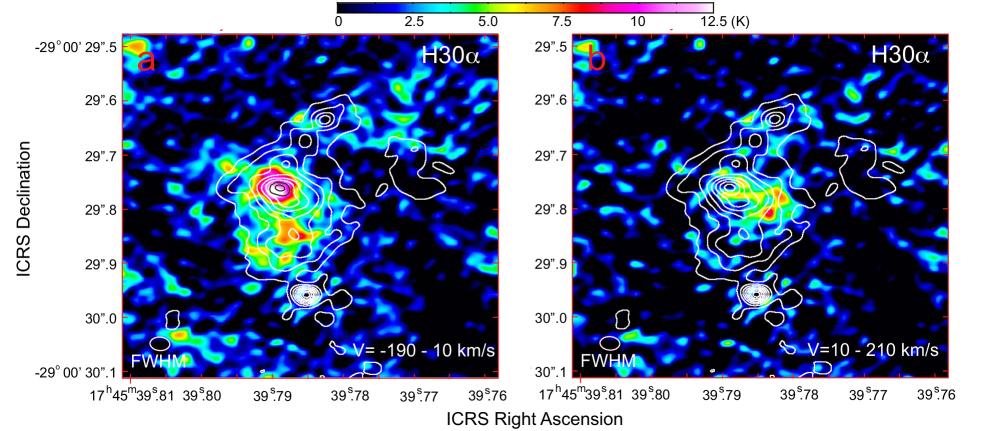
Figure 3 shows the integrated intensity maps with the velocity ranges of to km s-1 (left) and to km s-1 (right). These show the components with negative and positive velocities mentioned above, respectively. The angular resolution of these maps is the same as that of Figure 2. The contours in Figure 3 also shows the continuum emission at 232 GHz for comparison. The whole distribution of the ionized gas is oval-like but biased on the western side of the continuum peak. As seen in Figure 3a, the peak positionin the H30 recombination line is , . The integrated intensity peak position of the H30 recombination line is slightly shifted from that of the continuum emission.
Another component, which is located south of the oval-like structure, is identified in the channel maps with to km s-1. This component positionally shift from south to north with increasing velocity. The component is also identified in the integrated intensity map (see Figure 3a). This is a counter part of the component extending to the south seen in the continuum map, Figure 1c. Many faint components are widely distributed in the panels with , , and km s-1. These would belong to “Bar” of the GCMS which is extended widely (e.g. Figure 3 in Tsuboi et al. (2017b)). The major part of “Bar” is probably resolved out at the high resolution in this observation. In addition, the extended component corresponding to IRS13E5 is also identified in the panels with to km s-1. However, the components corresponding to IRS13E2 and IRS13E4 are not clearly found.
4 Discussion
4.1 Enclosed Mass of IRS13E3
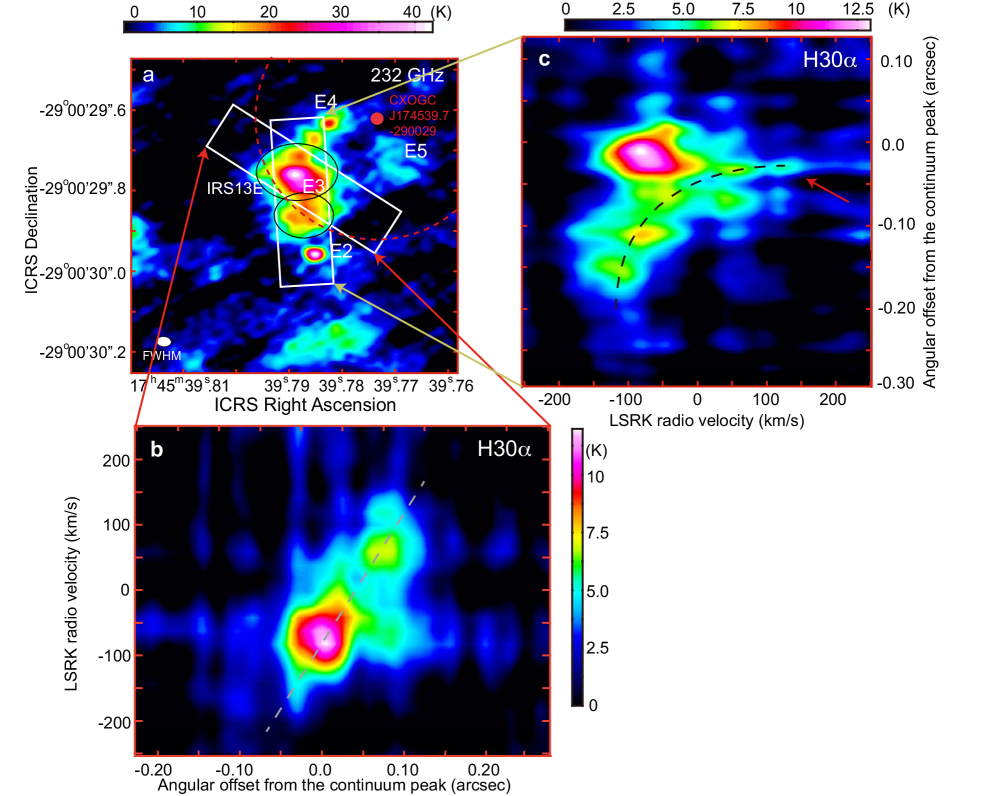
Figure 4b shows the position-velocity (PV) diagram in the H30 recombination line along the major axis of the oval-like structure of IRS13E3. The integration area is shown as the red rectangle in Figure 4a which is the continuum map at 232 GHz shown in figure 1c. The oval-like structure is seen as an inclined linear feature in Figure 4b. Generally, such a feature in a PV map indicates a ring like structure rotating around a massive object. The observed feature may be a part of an ionized gas ring rotating around IRS13E3. The rotating velocity of the structure is derived to be km/s from the difference between the positive and negative ends of the linear feature after correction of thermal broadening. Here is the inclination angle of the structure ( for edge-on). The inclination angle is derived to be from the aspect ratio of the Gaussian-fit angular size mentioned in Results. Then the rotating velocity is estimated to be km s-1. While the radius of the orbit is derived to be cm from the semi-major axis of the angular size. Assuming that the ionized gas obeys a single circular orbit simply, the enclosed mass is estimated to be from the above parameters using the formula; . Although the mass is smaller than the enclosed mass based on the analysis for the Keplerian orbit of the larger extended gas flow (Tsuboi et al., 2017b), it is still in the mass range for IMBH. This mass is within the upper limit mass of the object adjacent to Sgr A∗, which had been derived from the astrometry of Sgr A∗ using VLBA (Reid&Brunthaler, 2004). Of course, massive compact objects do not uniquely imply BHs and the alternate may be a compact cluster of star or star remnant and so on. From the derived mass and orbit radius, the lower limit of the mass density is estimated to be . According to the previous estimations (e.g. Maoz (1998)), the cluster with such mass density and such mass would be collapsed within less than years and form a BH eventually. Moreover, IRS13E3 is located within the error circle () of the X-ray point source detected by CHANDRA; CXOGCJ174539.7-290029 (Muno et al., 2009). The position and the error circle are shown in Figure 4a. The X-ray flux at keV of the source is reported to ph cm-2 s-1, which is as large as about half that of SgrA∗, ph cm-2 s-1. If a modest amount of gas accretes onto an IMBH, strong X-ray emission is expected to be produced. IRS13E3 has such a X-ray counterpart. Therefore this enclosed mass would be the convincing evidence that the IMBH exists in the complex.
On the other hand, figure 4c shows the PV diagram along the the south-extended gas flow. The integration area is shown as the white rectangle in figure 4a. The gas flow is seen as a curved feature in the PV diagram (a broken line curve), which is clearly distinguished from the gas ring mentioned above. This gas flow may correspond to a part of the Keplerian orbit around IRS13E3 identified by our previous observation (Tsuboi et al., 2017b). There is a faint component from the continuum peak in the PV diagram (an arrow), which is the positive velocity end of the curved feature. The physical distance is cm. The radial velocity of the component is km s-1. Although, the north extension of the major axis of the gas flow does not coincide with the continuum peak position of IRS13E3 exactly (see figure 1c), we assume here that the gas flow is now falling toward IRS13E3 freely. We suppose that the gas flow had been nearly at rest in the far distance and the rest radial velocity was km s-1 from Figure 4c. Thus the gain in velocity during falling is km s-1. The mass is estimated to be using the formula; . Here is the angle between the moving direction of the gas flow and the line-of-sight ( for the accord of the directions). This is roughly consistent with the enclosed mass mentioned above. The observed continuum image of IRS13E3 has inner structures as mentioned in the previous section (see figure 1c). These should show that the ionized gas does not occupy the orbit homogeneously. Because the orbital period is estimated to be yr, the morphology of the observed ionized gas is expected to change significantly in the next several decades.
4.2 Physical Properties of the Rotating Ionized Gas Ring around IRS13E3
The LTE electron temperature, , of the ionized gas ring around IRS13E3 is estimated from the ratio between the integrated recombination line intensity, , and the continuum flux density, , assuming that the line and continuum emissions are optically thin. The well-known formula of the LTE electron temperature is given by
| (1) |
The correction factor, , at GHz is calculated to be for K (Mezger & Henderson, 1967). We assume that the number ratio of He+ to H+ is , a typical value in the Galactic center region (e.g. Tsuboi et al. (2017a)). The LTE electron temperature is obtained by iteratively solving the formula for . The total flux densities at 232 GHz of the ionized gas ring around IRS13E3 and the extended gas flow are mJy and mJy, respectively. The integration areas are shown in Figure 4a as the two ovals. Meanwhile the total integrated intensity of the H30 recombination line emission in these areas are Jy km s-1 and Jy km s-1, respectively. The mean electron temperatures of the ionized gas ring and the extended gas flow are estimated to be K and K, respectively.
Using the observed brightness temperature of the continuum emission and the derived electron temperature, the electron density, , of the ionized gas ring around IRS13E3 is estimated by the following well-known formula;
| (2) |
(Altenhoff et al., 1960). The mean electron density is cm-3 assuming that the ionized gas in IRS13E3 has a spherical shape with a diameter of cm or the path length is cm (see Results). The mass of the ionized gas ring is .
5 Conclusions
We obtained the spatially resolved images of the compact ionized gas associated with IRS13E3 in the continuum emission at 232 GHz and H30 recombination line using ALMA, which is an IMBH candidate in the Galactic Center. The continuum emission image shows that IRS13E3 is surrounded by an oval-like structure. The angular size of the structure is ( cm cm). The structure is seen as an inclined linear feature in the H30 position-velocity diagram. We consider that the ionized gas is a ring-like structure rotating around IRS13E3 with the rotating velocity of km s-1 and the orbit radius of cm. From these orbit parameters, the enclosed mass is estimated to be . The mass is within the astrometric upper limit mass of the object adjacent to Sgr A∗. Considering IRS13E3 has an X-ray counterpart, the large enclosed mass would be supporting evidence that IRS13E3 is an IMBH. Even if a dense cluster corresponds to IRS13E3, the cluster would collapse into an IMBH within years due to the very high mass density of . Because the orbital period is estimated to be yr, the morphology of the observed structure is expected to change in the next several decades. The mean electron temperature and density of the ionized gas ring are K and cm-3, respectively. Then the mass of the ionized gas ring is .
This work is supported in part by the Grant-in-Aid from the Ministry of Eduction, Sports, Science and Technology (MEXT) of Japan, No.19K03939. The National Radio Astronomy Observatory (NRAO) is a facility of the National Science Foundation operated under cooperative agreement by Associated Universities, Inc. USA. ALMA is a partnership of ESO (representing its member states), NSF (USA) and NINS (Japan), together with NRC (Canada), NSC and ASIAA (Taiwan), and KASI (Republic of Korea), in cooperation with the Republic of Chile. The Joint ALMA Observatory (JAO) is operated by ESO, AUI/NRAO and NAOJ. This paper makes use of the following ALMA data: ADS/JAO.ALMA#2015.1. 01080.S and ALMA#2017.1.00503.S.
References
- Abuter et al. (2018) Abuter, R. et al. 2018, A&A, 615, L15
- Agol (2000) Agol, E. 2000, ApJ, 538, L121
- Altenhoff et al. (1960) Altenhoff, W., et al. 1960, Veröff. d. Sternw. Bonn Nr.59
- Boehle et al. (2016) Boehle, A. et al. 2016, ApJ, 830, 17
- Genzel et al. (2010) Genzel, R., Eisenhauer, F., & Stefan Gillessen, S. 2010, Rev. Mod. Phys, 82, 3121
- Ghez et al. (2008) Ghez, A. M., et al. 2008, ApJ, 689, 1044
- Gillessen et al. (2009) Gillessen, S., Eisenhauer, F., Trippe, S., Alexander, T., Genzel, R., Martins, F.,& Ott, T. 2009, ApJ, 692, 1075
- Hailey et al. (2018) Hailey, C. J., Mori, K., Bauer, F. E., Berkowitz, M. E., Hong, J., Hord, B. J. 2018, Nature, 556, 70
- Maillard et al. (2004) Maillard, J. P., Paumard, T., Stolovy, S. R., Rigaut, F. 2004, A&A, 423, 155
- Maoz (1998) Maoz, E. 1998, ApJ, 494, L181
- McMullin et al. (2007) McMullin, J. P., Waters, B., Schiebel, D., Young, W., & Golap, K. 2007, Astronomical Data Analysis Software and Systems XVI (ASP Conf. Ser. 376), ed. R. A. Shaw, F. Hill, & D. J. Bell (San Francisco, CA: ASP), 127
- Mezger & Henderson (1967) Mezger, P. G.& Henderson, A. P. 1967, ApJ, 147, 471
- Miyazaki, Tsutsumi & Tsuboi (2004) Miyazaki, A., Tsutsumi, T. & Tsuboi, M. 2004, ApJ, 611, L97
- Moser et al. (2017) Moser, L., et al. 2017, A&A, 603, id A68
- Muno et al. (2009) Muno, M.P., Bauer, F.E., Baganoff, F.K. et al. 2009, ApJS, 181, 110
- Quataert & Gruzinov (2000) Quataert , E.& Gruzinov, A., 2000, ApJ, 542, 842
- Oka et al. (2016) Oka, T., Mizuno, R., Miura, K., & Takekawa, S. 2016, ApJ, 816, id.L7
- Paumard et al. (2006) Paumard, T., et al. 2006, ApJ, 643, 1011
- Reid&Brunthaler (2004) Reid, M. J. &Brunthaler, A. 2004, ApJ, 616, 872
- Schödel et al. (2005) Schödel, R., Eckart, A.,Iserlohe, C., Genzel, R.,& Ott, T., 2005, ApJ, 625, L111
- Schödel, Merritt,& Eckart (2009) Schödel, R., Merritt, D.& Eckart, A., 2009, A&A, 502, 91
- Su, Slatyer,& Finkbeiner (2010) Su,M., Slatyer, T. R.& Finkbeiner, D.P. 2010, ApJ, 724, 1044
- Tsuboi et al. (2017a) Tsuboi, M., Kitamura, Y., Uehara, K., Miyawaki, R., Tsutsumi, T., Miyazaki, A., & Miyoshi, M., 2017a, ApJ, 824, id. 94
- Tsuboi et al. (2017b) Tsuboi, M., Kitamura, Y., Tsutsumi, T., Uehara, K., Miyoshi, M., Miyawaki, R., & Miyazaki, A., 2017b, ApJ, 850, id L5
- Yusef-Zadeh et al. (2017a) Yusef-Zadeh, F. et al. 2017a, MNRAS, 470, 4209
- Yusef-Zadeh et al. (2017b) Yusef-Zadeh, F., Wardle, M., Kunneriath, D., Royster, M., Wootten, A., & Roberts, D. A., 2017b, ApJ, 850, id L30.