Updating and Optimizing Error PDFs in the Hessian Approach. Part II
Abstract
In an earlier publication, we introduced the software package, ePump (error PDF Updating Method Package), that can be used to update or optimize a set of parton distribution functions (PDFs), including the best-fit PDF set and Hessian eigenvector pairs of PDF sets (i.e., error PDFs), and to update any other set of observables, in the Hessian approach. Here, we validate the ePump program with a detailed comparison against a full global analysis, and we demonstrate the potential of ePump by presenting selected phenomenological applications relevant to the Large Hadron Collider. For example, we use the package to estimate the impact of the recent LHC data of the measurements of , boson and top quark pair differential distributions on the CT14HERA2 PDFs.
I Introduction
An understanding of uncertainties due to parton distribution functions (PDFs) is crucial to precision studies of the standard model, as well as to searches for new physics beyond the standard model at hadron colliders, such as the CERN Large Hadron Collider (LHC). As extensively discussed in Ref. Schmidt:2018hvu , a technique for estimating the impact of new data on the PDFs, without performing a full global analysis, is extremely useful. (See also Refs. Paukkunen:2014zia ; Paukkunen:2013grz ; Camarda:2015zba .) For this purpose, we have developed a software package, ePump (error PDF Updating Method Package), which can be used to obtain both the updated best-fit PDF and updated eigenvector PDFs from an earlier global analysis. The package can also directly update the predictions for experimental observables and their PDF uncertainties without requiring the use of the updated PDFs to re-calculate the theory predictions. Finally, an alternative use of the package is to optimize a given set of Hessian PDFs for a particular set of observables, so that a reduced number of error PDFs can be used, while maintaining the PDF uncertainty on the observables to any desired precision.
In Ref. Schmidt:2018hvu some examples were given comparing the results of ePump with a full global analysis, as well as several phenomenological analyses using ePump. In addition, an exercise using ePump was performed in Ref. Willis:2018yln to show how to assess the potential of precision measurement of triple differential distributions of high-mass (up to sub-TeV) Drell-Yan pairs to reduce the PDF induced errors in predicting the cross section of an extra boson with mass greater than a few TeVs produced at the LHC. In this work we provide further checks and more details of the validation of ePump against the full global analysis machinery, and we provide more examples of using ePump to update current PDFs with new LHC data.
In a global analysis of experimental data, the PDFs are defined as a function of a number of fitting parameters, and in turn, the global and the theoretical prediction for any observable are also functions of the parameters. The crucial approximations used by ePump are these: 1) The global is a quadratic function of the parameters around its global minimum. 2) All other relevant quantities (including theoretical predictions of new observables used in the update, as well as the PDFs themselves) are linear functions of the parameters. It is these simplifying assumptions that allow ePump to obtain updated best-fit PDFs and error PDFs, and to update the predictions and uncertainties for any other observable, in just a few seconds of CPU time. Note that these approximations are the exact same as those used to calculate the PDF uncertainty for any observable in the Hessian method. However, the impact of these approximations must still be considered when interpreting the results from ePump. In addition, subtleties in the calculations of PDF uncertainties, such as the use of dynamical tolerances and Tier-2 penalties, could potentially induce further discrepancies between the predictions of ePump versus a full global analysis. Thus, it is useful to validate ePump against a full global analysis in as many distinct applications as possible.
The paper is structured as follows. In Sec. II, we perform the aforementioned validation of ePump. To do this we start with a base best-fit and error PDF set, obtained from a global analysis using the CT14HERA2 parametrization. The data included is the CT14HERA2 data sets minus some subset of the data. We then use ePump to update the PDFs by adding back the excluded data sets, and we compare with the standard CT14HERA2 PDFs. If the Hessian approximations were exact, we should find that the ePump predictions reproduce exactly the CT14HERA2 PDFs. Thus, we can test how well the approximations work for different classes of data sets. In Ref. Schmidt:2018hvu results were shown for this exercise where the jet data was included by ePump. In this paper we present more details of this check with jet data, and also present additional checks with Deeply-Inelastic Scattering (DIS) and Drell-Yan data. In each of these cases, we will see that the updated PDFs obtained from ePump are very close to the global-fit results, i.e., CT14HERA2 PDFs in this case. Furthermore, in Sec. II.3, we show, as an example, how to use ePump to directly update the theoretical predictions of the Higgs boson production cross section from gluon fusion in proton-proton collider, including its uncertainties induced by the updated error PDFs.
The speed of ePump makes it very useful to perform analyses to investigate the influence of multiple data sets on the PDFs that otherwise might require many different time-consuming global fittings. In Sec. III, we demonstrate how to use ePump to quickly identify the experimental data sets that constrain the CT14HERA2 PDFs most stringently. We find that among all of the 33 data sets included in the CT14HERA2 fits, less than half of them are necessary to effectively constrain the CT14HERA2 PDF errors. Detailed information on the impact of those individual data sets to constrain the CT14HERA2 PDFs, such as which parton flavors and at which values, will also be discussed.
Of course, one of the main uses for a tool such as ePump is to quickly assess the impact of new data sets prior to updating with a full global analysis. In Sec. IV we provide two detailed examples of this by using ePump to update the CT14HERA2 PDFs with some recent LHC data. First, we examine the impact from the LHC top quark pair () production data provided by ATLAS and CMS Collaborations. Second, we examine the impact from the ATLAS 7 TeV data on and productions Aad:2011dm . We find that while the data can provide potential constraints on the -PDF, its impact is quite minimal after we have included the inclusive high transverse momentum () jet production data from the Tevatron and the LHC in the same fit. On the other hand, we find a large impact on the quark PDFs, particularly in the small- region, when updated by adding the ATLAS 7 TeV and data Aad:2011dm . This large deviation of the updated PDFs from the original CT14HERA2 PDFs suggests that the ePump result should only be trusted qualitatively in this case, and for quantitative results with this data set a full global fit is required. This conclusion is further supported by examining the magnitude of the two measures and , introduced in Ref. Schmidt:2018hvu , which give the distance between the original and updated PDFs in the parameter space, relative to the updated and original errors, respectively. For the ATLAS 7 TeV and data the value of indicates that the original best-fit PDF was far outside the error band for the updated PDFs, so that the new best fit obtained by ePump is more likely to be affected by nonlinearities in the dependence of the observables and the PDFs on the fitting parameters. This, in turn, could produce results that differ from the true global fit.
Finally, concluding remarks are given in Sec. V.
II Validation of ePump using data sets in CT14HERA2
The data sets used for PDF global fitting in CT14HERA2 Hou:2016nqm consist of the HERA Run I+II combined data Abramowicz:2015mha , 15 other sets of DIS data, 14 sets of Drell-Yan data, and 4 sets of jet production data, as listed in Table I and II of Ref. Dulat:2015mca . Here, we will take the CT14HERA2 PDFs, including the best-fit and error sets, as the full global fit result to compare against the results of ePump. We shall see how well ePump reproduces the best-fit PDFs and uncertainty of CT14HERA2 for different classes of experimental data. The test goes as follows. First, we perform a full global analysis with the CT14HERA2 parametrization, using all of the CT14HERA2 data except for a particular subset of data. For instance, when we perform the global analysis with the jet data excluded, we obtain a new set of best-fit and error PDFs, called CT14HERA2mJ. We then use ePump to update CT14HERA2mJ by treating the excluded jet data as “new” data, with the updated PDFs called CT14mJeAll. A comparison between the CT14mJeAll and the CT14HERA2 best-fit and error PDFs can then be used to show how well ePump reproduces the full global analysis for this subset of data. Note that since ePump depends on quadratic and linear approximations, we should not expect perfect agreement. In addition, in the ePump prediction, there are assumptions in how the Tier-2 penalties from the new data affect the updated error PDFs, and therefore the uncertainties in the updated PDFs. However, as we shall see, the updated best-fit PDFs and their uncertainties from ePump are pretty close to those from the full global analysis.
We shall perform this analysis three times by removing different subsets of data from CT14HERA2: 1) excluding all of the DIS data except the HERA I+II combined data (CT14HERA2mD), 2) excluding all Drell-Yan data (CT14HERA2mY), and 3) excluding all Jet data (CT14HERA2mJ). We then add the excluded data back with ePump and compare the updated PDFs with the CT14HERA2 PDFs. To be precise, for the CT14HERA2 parametrization there are 27 parameters, corresponding to 54 error PDFs. In addition, two gluon extreme sets (i.e., eigen-PDF sets 55 and 56) were introduced via the Lagrangian Multiplier method in the CT14HERA2 fit to enlarge the uncertainty in the -PDF in the small- region. For our CT14HERA2mD, CT14HERA2mY, and CT14HERA2mJ fits, we did not produce these extra gluon extreme sets. Thus, everywhere in this section we shall exclude the two gluon extreme sets also in the CT14HERA2 PDF errors, in order to have a truer comparison. For convenience we summarize our notations in this paper here:
-
•
CT14HERA2mD, CT14HERA2mY, and CT14HERA2mJ are the base sets as described above, to be used by ePump.
-
•
The letter “e” followed by a data set name indicates that the PDFs are obtained from ePump by adding the given data set as “new” data to the base set. For example, in Sec. III.1 the PDFs CT14mJeCDF are obtained from ePump by adding the CDF inclusive jet data to the base set CT14HERA2mJ.
-
•
The letters “eAll” indicate that PDFs are obtained from ePump by adding back all of data that was excluded in the base set as “new” data. Thus, these sets are the ePump approximation to be compared with the full CT14HERA2 PDF set.
-
•
The suffixes “.54” or “.52” (as for example, in CT14HERA2.54) are used to indicate that the error bands are obtained with 54 or 52 eigen-PDFs, respectively, rather than with the full 56 eigen-PDFs.
Finally, we note that we always show symmetric error bands in this paper. As described in Ref. Schmidt:2018hvu , the symmetric Hessian error bands are invariant under a change of the eigen-PDF basis (unlike the asymmetric errors) and therefore are more reliable when assessing the impact of new data on the PDF errors when using ePump.
II.1 CT14HERA2 excluding all DIS data (except HERA Run I+II combined): CT14HERA2mD
There are 3287 data points in total in the CT14HERA2 fit Dulat:2015mca ; Hou:2016nqm . Among these, the DIS experiments contribute 2381 data points, of which 1120 data points are from the precision HERA Run I+II combined neutral current and charged current data. If we remove all of the DIS data from the CT14HERA2 fit, this only leaves 906 data points for the reduced (non-DIS) global fit, with the 2381 DIS data points to be added in by ePump as “new” data. In this instance, we may not expect ePump to reproduce the full CT14HERA2 fit results well, since there are more data points (2381) in the “new” data than in the “old” data (906). As a consequence, in many regions of PDF parameter space the “new” DIS data constrain the PDFs much more than the “old” non-DIS data. As discussed in Ref. Schmidt:2018hvu , if the updated fit moves too far from the original one in the parameter space, the linear and quadratic approximations used in ePump may break down. Furthermore, it is difficult to obtain a well-converged global fit if all of the DIS data is removed, because too many fitting parameters are left unconstrained. If one insists on removing all of the DIS data (including HERA Run I+II), some of the 27 (without extreme sets) or 28 (with extreme sets) parameters must be fixed before doing the fit. Then one can get a set of global-fit PDFs with fewer parameters than CT14HERA2, and can still use ePump to update them. However, since some parameters that should be constrained by DIS data are already fixed, the update obtained by adding the DIS data using ePump will not fully reflect the impact of the new data, and the comparison with CT14HERA2 becomes less meaningful.
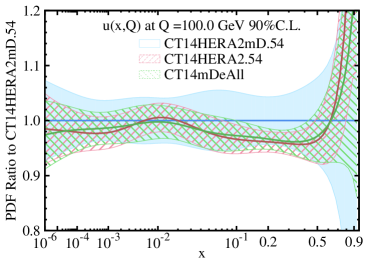
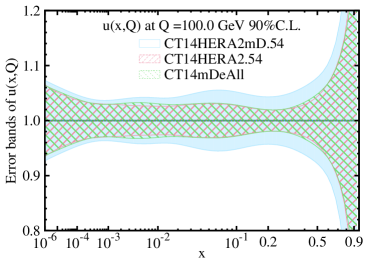
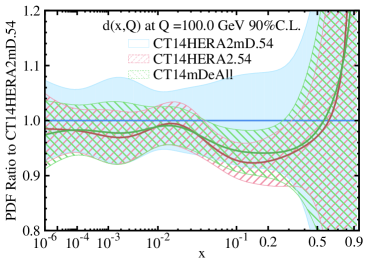
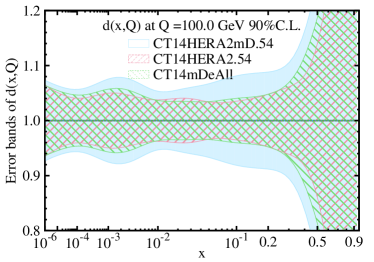
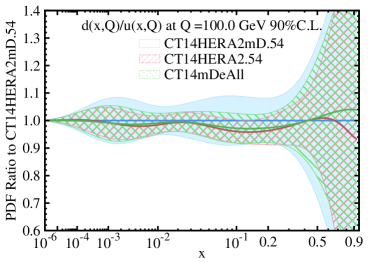
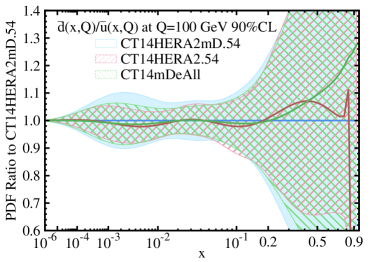
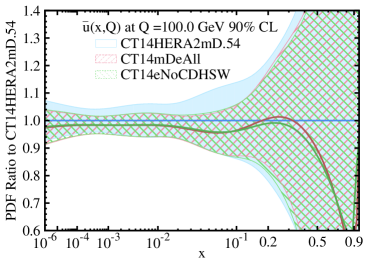
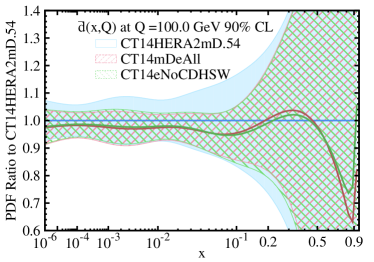
Therefore, in the present analysis we choose to keep the HERA Run I+II combined data in the original base fit, allowing us to use the full 27 free parameters. These data provide important information on the decomposition of parton flavors inside the proton, and therefore provide sufficient constraints on the PDFs for a reasonable base set to update with ePump. Our base fit, CT14HERA2mD, is then obtained from a global fit to a total of 2026 data points, which include all non-DIS data and the HERA I+II combined data, and exclude all other DIS data. The remaining DIS data contains 1261 data points, which will be taken as “new” data to update the CT14HERA2mD PDFs by ePump. The updated PDFs, named CT14mDeAll, can then be compared to the CT14HERA2 PDFs.
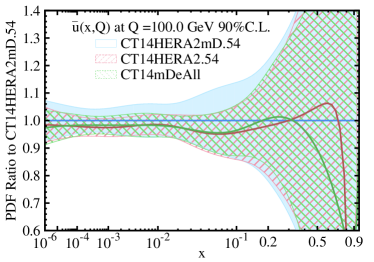
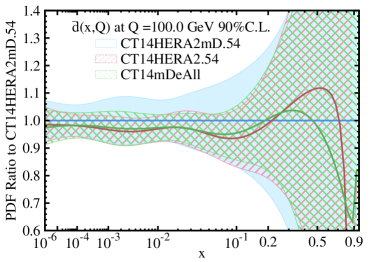
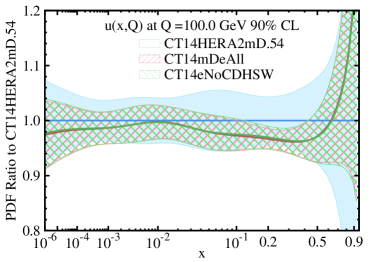
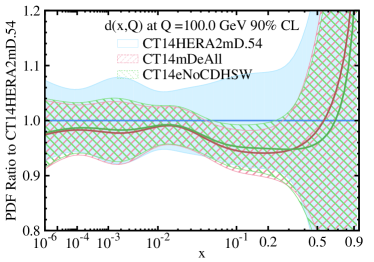
In Fig. 1, we compare the ePump-updated PDFs (CT14mDeAll) to the base PDFs (CT14HERA2mD) and the true global-fit PDFs (CT14HERA2). It can be seen that the update with ePump yields very similar results as the true global fit. Given the quadratic and linear approximations in ePump, and the number of “new” data points (1261) compared to the number of “old” data points (2026), the results are extremely satisfactory. Moreover, these well-approximated updated PDFs were calculated in just a few seconds of CPU time. So, prior to a full global fit, one can quickly obtain a first look at the impact of the new data using ePump. As is expected, the DIS data provide important information on the and PDFs, whose error bands have shrunk by almost one half with the inclusion of the non-HERA DIS data. It is also evident that the quark PDF is constrained more than the quark PDF. This is easily understood by the fact that the electric charge of the quark is twice that of the quark, and so it contributes more to the cross section in low energy DIS neutral current processes.
II.2 CT14HERA2 excluding all Drell-Yan data: CT14HERA2mY
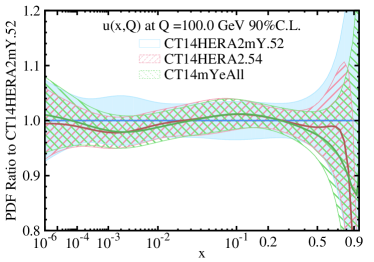
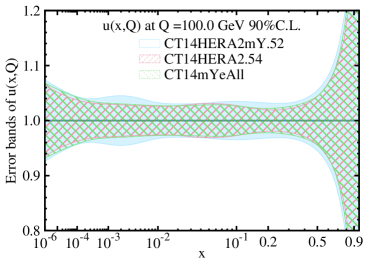
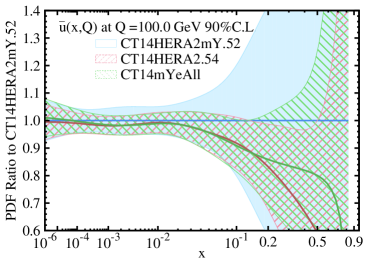
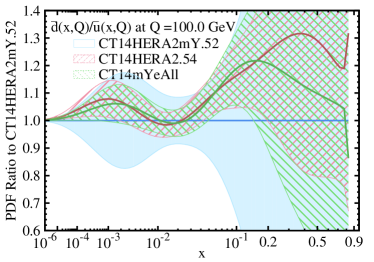
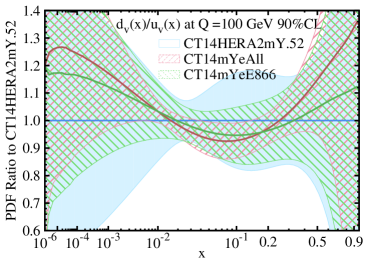
Here we perform a similar study for the Drell-Yan data in CT14HERA2. The global fit to all the DIS and jet data, and excluding the Drell-Yan data, is named CT14HERA2mY, which contains 2786 data points. It is worth mentioning that the global fit for CT14HERA2mY with 27 parameters are not very well converged, for the same reason explained in Sec. II.1. Fortunately, we only need to fix one parameter to get a good fit. Thus we are left with enough (26) free parameters to test ePump and the results are still meaningful, as we will see in the following. The ePump-updated PDFs, obtained by adding back all the Drell-Yan data, which contains 501 data points, to the CT14HERA2mY fit, are shown in Fig. 2, together with CT14HERA2 (after removing the two extreme -PDF sets). Again, we see that ePump yields a result very similar to the true global fit CT14HERA2, with only a small difference for less than about 0.4, which is negligible compared to the size of the error band. In the large region, the PDFs are small and there is little experimental data to constrain them, so they are determined by analytic extrapolation and depend strongly on the non-perturbative parameterization forms assumed at the PDF initial scale (which is 1.3 GeV in the CT14HERA2 fit). Therefore, we are not concerned by the differences in the best-fit PDFs at greater than about 0.4, which are nevertheless still well within the error bands.
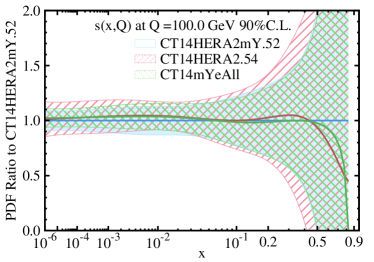
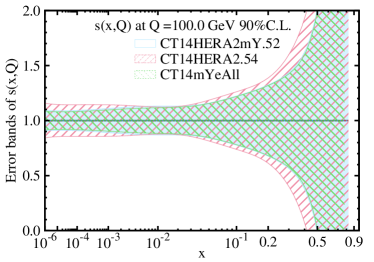
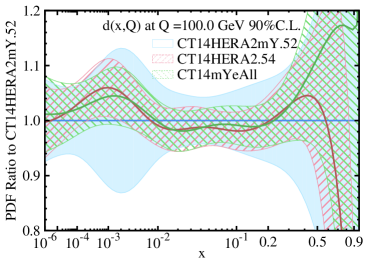
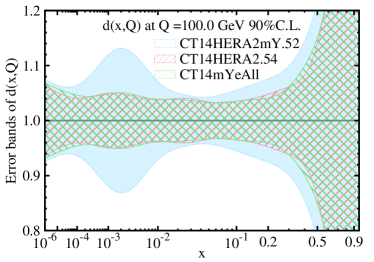
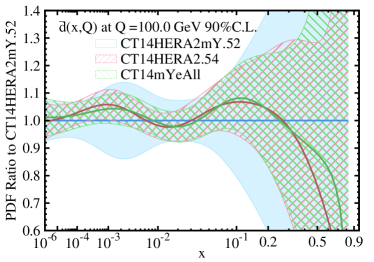
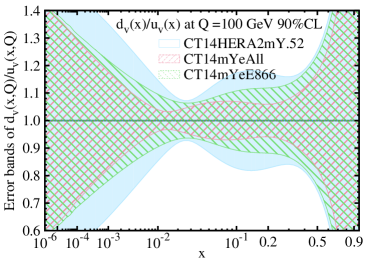
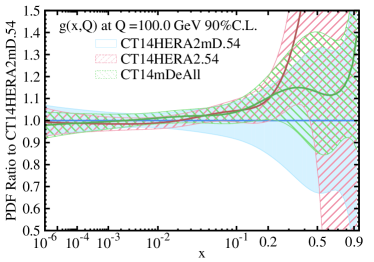
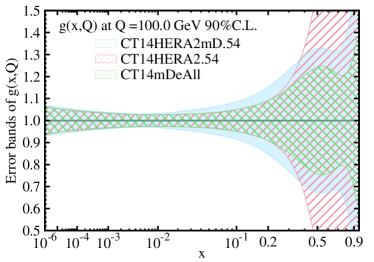
The updated -PDF is shown in Fig. 3, where one finds a dramatic difference in the -PDF uncertainty between ePump and the global-fit. The CT14HERA2 error band of the -PDF increases for almost all values when the Drell-Yan data is added, while the ePump-updated CT14mYeAll error band stays the same as the base CT14HERA2mY. An increase in the PDF error band found in a global fit usually indicates the presence of some tension between the new and the old data. Due to the quadratic approximation in ePump, it can never produce an increase in the size of the error band, but rather in most cases it will reduce the error. This can be inferred directly from Eq. (20) in Ref. Schmidt:2018hvu by the positivity of . Thus, we find that when there is strong tension between the new and old data sets, it will not be revealed by an enlargement of the ePump-updated PDF error bands, in contrast to that of a true global fit. We shall discuss other methods to explore possible tension between different data sets with ePump later.
II.3 CT14HERA2 excluding all jet data: CT14HERA2mJ
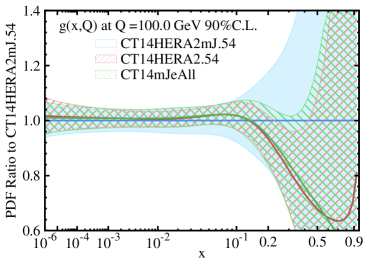
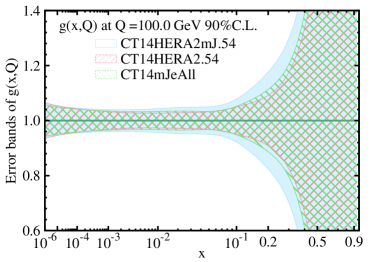
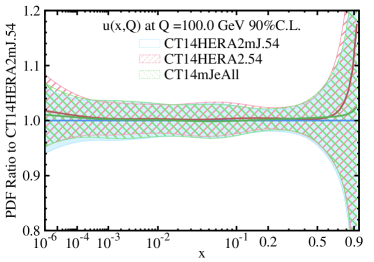
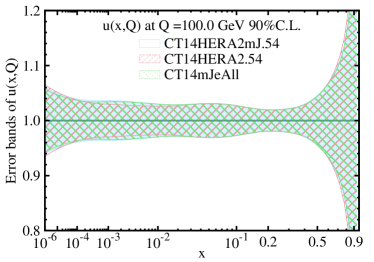
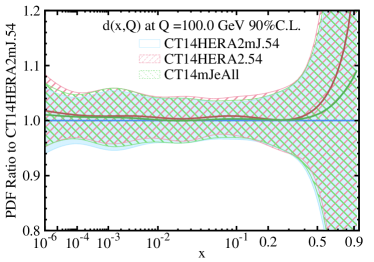
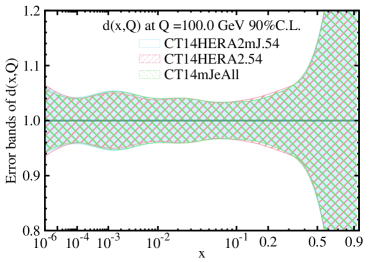
CT14HERA2 contains four sets of inclusive jet production data: CDF Aaltonen:2008eq and D Abazov:2008ae at the Tevatron Run-2, and ATLAS 7 TeV Aad:2011fc and CMS 7 TeV Chatrchyan:2012bja at the LHC. We denote the global fit to all the CT14HERA2 data, minus the four jet data sets, as CT14HERA2mJ, which contains 2882 data points.111CT14HERA2mJ contains 27 free parameters. We do not need to fix any parameters. The ePump-updated PDFs, obtained by adding back the four jet data sets as “new” data, which contain 405 data points, are designated as CT14mJeAll. As shown in Fig. 4, the jet data mainly constrain the -PDF, with little effect on the and PDFs, cf. Fig. 5. The agreement between the ePump-updated PDF and the CT14HERA2 global fit is quite satisfactory. The -PDF is modified and the error band is increasingly reduced as grows from 0.01 to 0.3. At large values, the difference in the best-fit PDFs is not significant due to the large error band size. Again, the somewhat larger CT14HERA2 PDF error band of PDF at in the range from 0.1 to 0.4, as compared to CT14mJeAll, indicates some tension caused by adding the jet data to the rest of the CT14HERA2 data in the global fit, which ePump is unable to see.
The Higgs boson cross section is strongly dependent on the -PDF, so an interesting question to ask is: What is the impact of the jet data included in the CT14HERA2 fit on the prediction of the Higgs boson production cross section at the LHC? As explained in Section II.D of Ref. Schmidt:2018hvu , ePump can not only update the PDFs but also physical observables within a few seconds of CPU time. Table 1 shows the result of the comparison between the ePump-updated prediction and the CT14HERA2 prediction for various LHC center-of-mass energies. After adding jet data into the fits, the central values of become slightly larger and the errors become smaller. Using ePump, the jet data reduce the error of by about 20%, while the true global fit results in about a 30% reduction. This difference may be due to the linear and quadratic approximations in ePump, or it could be due to the effect of the new data on the Tier-2 penalty, which is only treated on average in ePump. Nevertheless, one can use ePump to quickly estimate the impact of some “new” data to updated PDFs and physical observables. For instance, in this case, we could conclude from ePump updating that including jet data in the fit will lead to a more precise result of with its uncertainty reduced by about 20%.
| (TeV) | CT14HERA2mJ | CT14mJeAll | CT14HERA2 |
|---|---|---|---|
| 7 | 14.52 0.62 | 14.68 0.50 | 14.60 0.43 |
| 8 | 18.37 0.80 | 18.59 0.63 | 18.49 0.53 |
| 13 | 42.1 2.0 | 42.7 1.5 | 42.5 1.2 |
| 14 | 47.5 2.3 | 48.2 1.8 | 48.0 1.4 |
III Impact of individual CT14HERA2 data sets on PDFs
ePump can be used to quickly assess the impact of individual data sets on constraining the PDFs in a global analysis. In this section, we will demonstrate this by using ePump to assess the data sets used in the CT14HERA2 global analysis.
III.1 The impact of jet data in the CT14HERA2 fit
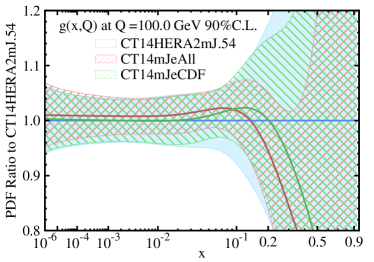


As already noted in Sec. II.3, the jet data mainly constrain the -PDF and have little effect on other flavors. From Fig. 4, we see that the jet data prefer a larger -PDF at and smaller -PDF at . The error band is reduced by a fairly large amount in the range of , by about 1/4 to 1/3.
In order to see the impact of individual jet data in the CT14HERA2 fit, we use ePump to add each jet data set individually to CT14HERA2mJ. The results are shown in Fig. 6, with CT14mJeAll shown together in the same graph for comparison. It can be seen that the four jet data sets produce the same qualitative effects on the -PDF, but quantitatively the CMS 7 TeV jet data Chatrchyan:2012bja yields the result that is most similar to CT14mJeAll. It increases the -PDF slightly at small , with maximum pull upward around , but pulls it downward sharply above . While all of the jet data sets reduce the error band, the CMS 7 TeV jet data reduces it the most and is the closest to the all-jet result. The others reduce the errors by a distinctly smaller amount. From this we can draw the conclusion that the CMS jet data has the dominant impact on the -PDF, among all the jet data included in CT14HERA2. It is worth noting that in the range of , the CDF Run-2 inclusive jet data set leads to a harder -PDF than the others, while the D Run-2, ATLAS 7 TeV and CMS 7 TeV jet data yield similar results for the -PDF.
III.2 The impact of Drell-Yan data in the CT14HERA2 fit
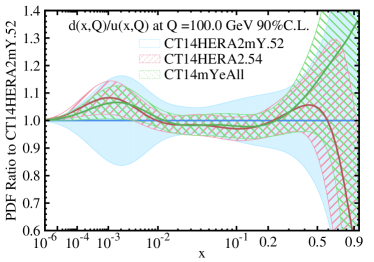
The impact of Drell-Yan data on , and -PDFs has been shown in Figs. 2 and 3 in Sec. II.2. The impact on other flavor PDFs can be found in Figs. 7 and 8. It is found that Drell-Yan data mainly constrain , , and PDFs, with little effect on and -PDFs. Drell-Yan data not only reduce the uncertainties of , , and a lot, but also change the best-fit PDFs dramatically. It is worth noting that for most values of , the Drell-Yan data pulls the and PDFs in opposite directions, cf. Fig. 2. Around , the PDF is decreased while the PDF is increased, and at , becomes larger while becomes smaller. This feature is also visible for the and PDFs and is a characteristic of Drell-Yan data.
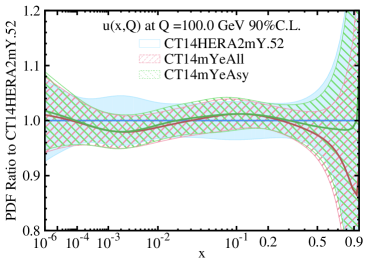
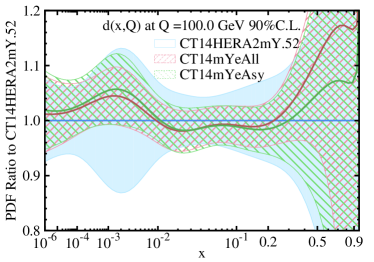
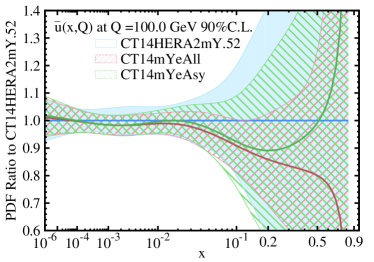

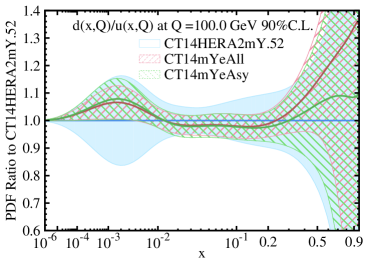
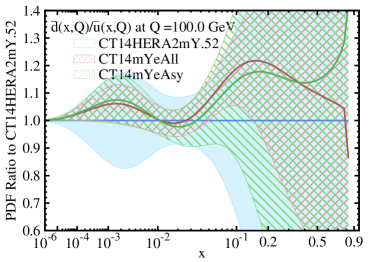
The fact that the and PDFs or the and PDFs get pulled in opposite directions indicates that the fitting program is directly modifying the differences between them. Namely, it is and , or rather, the ratios and that are directly probed by the Drell-Yan data. A reasonable conjecture is that this is due to charge asymmetry data measured at the Tevatron and the LHC. To check this, we use ePump to add each Drell-Yan data set individually to CT14HERA2mY, and compare with CT14mYeAll, which we have already shown is very close to CT14HERA2. We find that although most data sets give a similar trend, only the CMS 7 TeV asymmetry data Chatrchyan:2013mza , the CMS 7 TeV electron asymmetry data Chatrchyan:2012xt , the ATLAS 7 TeV data Aad:2011dm and the D Run2 asymmetry data Abazov:2007pm have an appreciable impact. This result is as expected, since most of them are lepton charge asymmetry data. We can use ePump to add just these four charge asymmetry data sets to CT14HERA2mY. The result, called CT14mYeAsy, is shown in Figs. 9, 10 and 11, compared with CT14mYeAll. The results from just including the lepton charge asymmetry data are pretty close except in the large region, where the relative PDF errors are large and the approximations used by ePump are unreliable Schmidt:2018hvu .
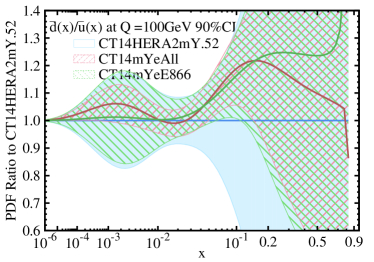
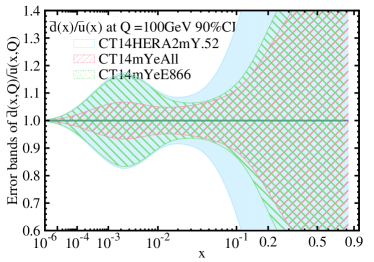
Another important Drell-Yan data set is the E866 data Towell:2001nh which measures the ratio of Drell-Yan production in proton-deuteron and proton-hydrogen collisions, . These data impose important constraints on the PDF ratios and at larger values of . Using ePump to update CT14HERA2mY PDFs by taking the E866 data as “new” data, we obtained the CT14mYeE866 PDFs, which are compared to the CT14HERA2 PDFs in Fig. 12. This figure shows that at , the anti-quark PDF ratios, , and the valence quark ratios, , and their error bands are greatly constrained and are very close to the CT14mYeAll fit. Comparing Figs. 10, 11 and 12, we conclude that both the lepton charge asymmetry data (from the Tevatron and the LHC) and the E866 data are needed to closely reproduce the CT14HERA2 fit result for the , , and PDFs.
III.3 The impact of DIS data in the CT14HERA2 fit

The DIS data sets provide important information on the and PDFs, even when the HERA run I+II combined data have already been included, as shown in Fig. 1. In contrast to the Drell-Yan case, the DIS data pulls the and PDFs in the same direction. This feature also holds for the and PDFs, as shown in Fig. 13. The implication is that precision DIS data are more sensitive to the sum (or, rather, the weighted sum) than the difference or ratio between the and PDFs (or and PDFs). This is because most of the precision DIS data measured the structure function. Only a few experiments provided precision measurements of the structure function, which probes the difference between and or and . In Fig. 14, we show the impact of DIS data (excluding HERA I+II) on and in the CT14HERA2 fit, which is seen to be relatively small.
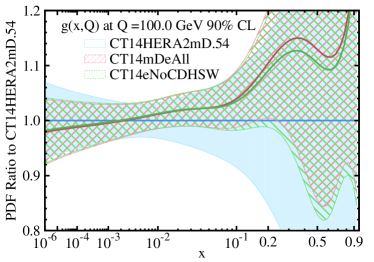
The impact of DIS data on the -PDF is shown in Fig. 15. It is interesting to note that the DIS data prefer a harder gluon in the region. This is opposite to the effect of the jet data, which prefer a softer gluon at , cf. Fig. 4. The tension between these two kinds of data on the -PDF can be seen by noting that the error band of the true global fit CT14HERA2 is wider than that obtained by the ePump updating, cf. Fig. 15.
| ID | Experimental data set | Most prominent effects | |
|---|---|---|---|
| 101 | BCDMS | Benvenuti:1989rh | Reduce and uncertainties at |
| 102 | BCDMS | Benvenuti:1989fm | Reduce uncertainty at and at |
| 104 | NMC | Arneodo:1996qe | Reduce , and uncertainties for all |
| 108 | CDHSW | Berge:1989hr | Almost all the PDFs |
| 109 | CDHSW | Berge:1989hr | and central fits for all |
| 110 | CCFR | Yang:2000ju | Almost all the PDFs |
| 111 | CCFR | Seligman:1997mc | and central fits for all |
| 124 | NuTeV SIDIS | Mason:2006qa | -PDF at |
| 125 | NuTeV SIDIS | Mason:2006qa | -PDF at |
| 126 | CCFR SIDIS | Goncharov:2001qe | Reduce -PDF uncertainty at |
| 127 | CCFR SIDIS | Goncharov:2001qe | Reduce -PDF uncertainty slightly at |
| 145 | H1 | Aktas:2004az | Not much effect |
| 147 | Combined HERA charm production | Abramowicz:1900rp | Not much effect |
| 169 | H1 | Collaboration:2010ry | Not much effect |
| ID | Experimental data set | Most prominent effects | |
| 201 | E605 Drell-Yan process | Moreno:1990sf | Pull down and PDFs at |
| 203 | E866 Drell-Yan process, | Towell:2001nh | and at |
| 204 | E866 Drell-Yan process, | Webb:2003ps | at and at |
| 225 | CDF Run-1 electron | Abe:1996us | Reduce errors of , at and at all x |
| 227 | CDF Run-2 electron | Acosta:2005ud | Reduce by a little at |
| 234 | DØ Run-2 muon | Abazov:2007pm | Reduce , , and |
| uncertainties at | |||
| 240 | LHCb 7 TeV | Aaij:2012vn | Not much effect |
| 241 | LHCb 7 TeV | Aaij:2012vn | Reduce , , uncertainties |
| slightly at | |||
| 260 | DØ Run-2 rapidity | Abazov:2006gs | Not much effect |
| 261 | CDF Run-2 rapidity | Aaltonen:2010zza | Not much effect |
| 266 | CMS 7 TeV , muon GeV | Chatrchyan:2013mza | Almost all the quark PDFs |
| 267 | CMS 7 TeV , electron GeV | Chatrchyan:2012xt | Almost all the quark PDFs |
| 268 | ATLAS 7 TeV cross sec., | Aad:2011dm | Almost all the quark PDFs |
| 281 | DØ Run-2 electron | D0:2014kma | Reduce , and |
| uncertainties at |
| ID | Experimental data set | Most prominent effects | |
|---|---|---|---|
| 504 | CDF Run-2 inclusive jet production | Aaltonen:2008eq | -PDF at |
| 514 | DØ Run-2 inclusive jet production | Abazov:2008ae | -PDF at |
| 535 | ATLAS 7 TeV incl. jet production | Aad:2011fc | -PDF at |
| 538 | CMS 7 TeV incl. jet production | Chatrchyan:2012bja | -PDF at |

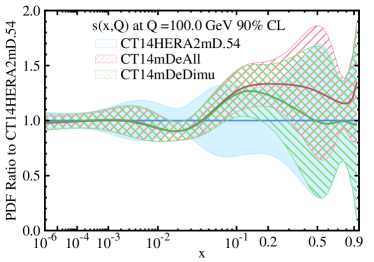
DIS data are also expected to constrain the strange quark () PDF. For most of the DIS data, however, the contribution to the -PDF is much smaller than to the and PDFs, except for the DIS charged current dimuon production experiments Mason:2006qa Goncharov:2001qe , where the strange quark gives the dominant contribution. Thus, it is interesting to see how much the dimuon data alone can constrain the -PDF among all the DIS data. This can be quickly investigated with ePump. In Fig. 16, we compare the updated -PDF, by including only these dimuon data, to the one with the full DIS data included. Although dimuon data sets are not the only ones responsible for determining the -PDF, they do fully constrain the -PDF over a wide region, from to , for both the central PDF and its error band. Furthermore we will see that the effects mostly come from NuTeV dimuon data Mason:2006qa , and only a little from CCFR dimuon data Goncharov:2001qe .
As before, we can use the ePump updating code to investigate the effect from individual DIS data set on the CT14HERA2 PDFs. We find the bulk of the DIS data contributions comes from CCFR Yang:2000ju , Seligman:1997mc , CDHSW and Berge:1989hr , NuTeV SIDIS, and NuTeV SIDIS Mason:2006qa data sets. As discussed above, NuTeV dimuon data are almost solely responsible for constraints on the -PDF, with the stronger constraint coming from NuTeV SIDIS data. CCFR and CDHSW data produce the biggest changes to and , and together with CCFR and CDHSW , they give the biggest change to and . However, the error band on is not reduced until we also add in NMC data Arneodo:1996qe . Although the other DIS data do not have as large of an impact as the above mentioned 7 data sets, they are still responsible for some “fine structure” of the PDFs. For example, BCDMS Benvenuti:1989rh and Benvenuti:1989fm data measured the structure functions of protons and deuterons, and cover the large region . Hence, these two data sets constrain and quarks and -PDFs in the large region. Due to limited space, we shall not show all the corresponding plots in this paper, but instead will post them on the website of the ePump project ePumpwebsite . For completeness, we summarize our findings in Tables 2, 3 and 4, where we list the most prominent effects of each data set in CT14HERA2. We note that such a study by ePump must start from a base set of global-fit PDFs, and the effects of the data listed in the tables refer to their “net” impact when added, one at a time, to the particular base PDF set. For example, for the DIS data in Table 2, the base PDF set is CT14HERA2mD, which includes the Drell-Yan and jet data and the HERA Run I+II data Abramowicz:2015mha . Thus it may happen that the effects of some DIS data are similar to those of the HERA Run I+II data, with the result that an individual data set, such as H1 data Aktas:2004az , appears to have little or no impact to the updated central set PDFs.
Finally, before leaving this section, we would like to investigate the impact of the CDHSW and data in the CT14HERA2 fit. It has long been argued that these data sets were not analyzed properly and therefore should not be used in a global fit Barone:1999yv . Therefore, one may wonder how the CT14HERA2 PDFs would change if we exclude these two CDHSW data sets from the original CT14HERA2 fit. Instead of redoing the whole global fit, we use ePump to quickly answer this question. The procedure is to use ePump to update the CT14HERA2mD PDFs by taking all but the CDHSW DIS data as “new”data. The resulting PDFs, CT14eNoCDHSW, are shown in Fig. 17 to be compared with CT14mDeAll, in which all DIS data were included. From these figures, we immediately note that they do not differ very much. This is because the CCFR and data have similar effects to the CDHSW data on CT14HERA2 PDFs. Furthermore, from Fig. 17 we can extract the consequences of removing the CDHSW data from the CT14HERA2 fit. Removing the CDHSW data leads to slightly softer , , , PDFs at , and harder and PDFs at . Recall that the Tevatron and LHC jet data also prefer a softer -PDF at , cf. Fig. 6. Thus, removing the CDHSW data is more consistent with jet data.
IV Using ePump to study the impact of new data
In the previous sections, we have validated ePump against the CT14HERA2 global fit by updating the PDFs with some subset of the CT14HERA2 data sets. We have also used ePump to investigate the impact of individual data sets on the CT14HERA2 PDFs. In this section, we will use ePump to study the potential impact of some new LHC data on improving the CT14HERA2 PDFs. An example was already given in Schmidt:2018hvu , where we analyzed the impact of the CMS inclusive jet production data at Khachatryan:2016mlc . Here, we consider two more examples of the new LHC data: the LHC 8 TeV differential cross section data, and the ATLAS 7 TeV and data.
IV.1 data at the LHC
| ID | data | of CT14HERA2 | of CT14HERA2mJ |
|---|---|---|---|
| 561 | CMS 8 TeV Normalized | 0.14 | 0.27 |
| 562 | CMS 8 TeV Normalized | 0.06 | 0.23 |
| 563 | CMS 8 TeV Normalized | 0.17 | 0.32 |
| 564 | CMS 8 TeV Normalized | 0.25 | 0.64 |
| 565 | ATLAS 8 TeV Absolute | 0.01 | 0.02 |
| 566 | ATLAS 8 TeV Absolute | 0.09 | 0.31 |
| 567 | ATLAS 8 TeV Absolute | 0.03 | 0.01 |
| 568 | ATLAS 8TeV Absolute | 0.17 | 0.47 |
| ID | data | of CT14HERA2 | of CT14HERA2mJ |
|---|---|---|---|
| 561 | CMS 8 TeV Normalized | 4.35 | 5.68 |
| 562 | CMS 8 TeV Normalized | 2.63 | 3.06 |
| 563 | CMS 8 TeV Normalized | 6.07 | 7.71 |
| 564 | CMS 8 TeV Normalized | 2.19 | 3.24 |
| 565 | ATLAS 8 TeV Absolute | 0.49 | 0.52 |
| 566 | ATLAS 8 TeV Absolute | 2.89 | 6.09 |
| 567 | ATLAS 8 TeV Absolute | 1.19 | 1.00 |
| 568 | ATLAS 8TeV Absolute | 5.09 | 9.10 |
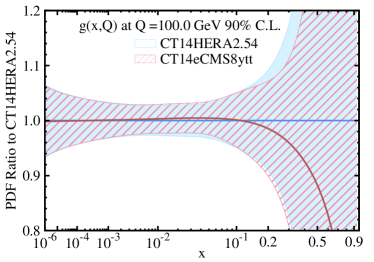
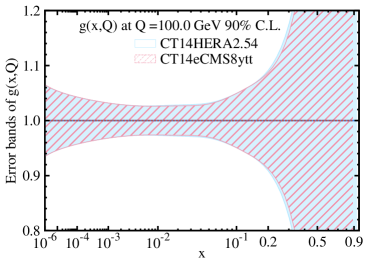
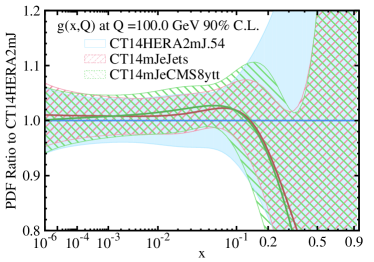
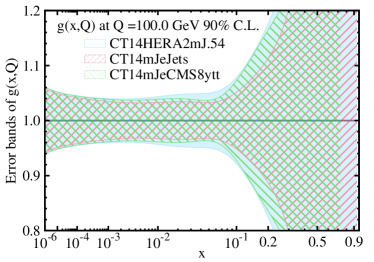
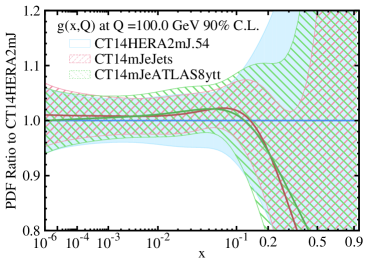
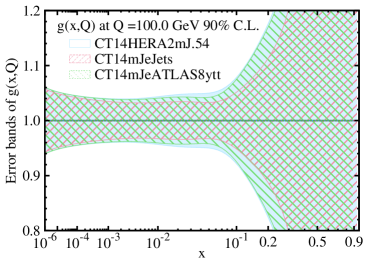
We shall consider eight data sets presented by the CMS Khachatryan:2015oqa and ALTAS Aad:2015mbv collaborations, as listed in Table 5. They are the absolute and normalized one-dimensional differential cross sections of the transverse momentum () and rapidity () of top quark, and invariant mass () and rapidity () of pair. The dominant production of pairs at the LHC is through the gluon-gluon fusion process. Thus, data can potentially constrain the -PDF, especially at large values of , due to the large invariant mass. We also display in the third column of Table 5 the measure , introduced in Ref. Schmidt:2018hvu , which summarizes in a single value the change in the best-fit PDFs after the new data has been added to the original CT14HERA2 fit. To be precise, is the length of the shift of the best-fit point in parameter space, relative to the 90% confidence level (C.L.) boundary of the original PDFs. Thus, means that the new best-fit touches the 90% C.L. boundary, while a value of implies a very small change to the best-fit PDFs.222One should note that only reflects the change in the best-fit PDFs, so that it is still possible for the new data to produce a significant reduction in the PDF error bands, even if is small. From Table 5 we can see that most of the new data have a minimal effect on the best-fit CT14HERA2 PDFs, with the CMS 8 TeV normalized data set having the biggest impact. The -PDF, updated for this data set, is shown in Fig. 18. One can see that the updated best-fit -PDF slightly decreases at , with slightly reduced error band at , as compared to the CT14HERA2 PDFs. Hence, this data set prefers a softer -PDF in the large region.
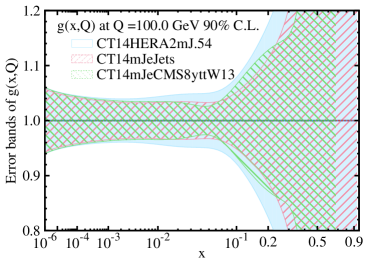
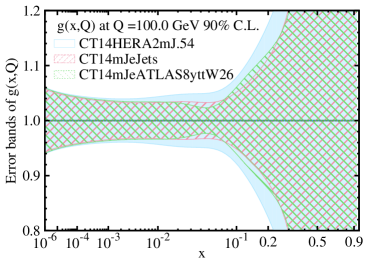
Given the dependence of the distributions on the -PDF, it is interesting to compare the impact of each of the new LHC data sets with that of the four jet data sets already included in the CT14HERA2 fit. To do this, we use ePump to add each of the individual data sets as new data to update the CT14HERA2mJ PDFs. Recall that the CT14HERA2mJ PDFs, introduced in Sec. II.3, were obtained from a global fit to all of the CT14HERA2 data sets, except the four Tevatron and LHC jet data. The resulting values, after updating from CT14HERA2mJ, are listed in the fourth column of Table 5. Comparing to the comparable values in the third column, obtained from updating CT14HERA2, we find that the new data sets have a much larger effect in the absence of the jet data. In this case, the CMS 8 TeV normalized and ATLAS 8 TeV absolute data have the largest impact, for which the updated -PDFs are shown in Fig. 19. It can be seen that the distributions measured at both CMS and ATLAS have comparable effects, and they modify the -PDF similarly to that of the jet data. But the data has less power to reduce the uncertainties of -PDFs, especially in the range . This is consistent with our finding that in the presence of jet data, the new data sets have little effect on PDFs, because the data produces the same change on the central -PDFs, but provides less constraining power on the error band. The reason for this can be traced to the simple fact that there are far fewer data points than jet data points, due to a smaller production cross section. Thus, the statistical power of is smaller.
We can test this interpretation using ePump by increasing the weight of the data in the ePump updating. A weight larger than 1 is equivalent to having more data points with the same experimental uncertainties or, alternatively, to reducing the experiment uncertainties by a factor of the square root of the weight. Of course, increasing the weight is not exactly the same as increasing the luminosity, since it does not change the central values of the data, which presumably have fluctuations described by the original experimental uncertainties. Nevertheless, one can get some estimate of the potential impact of the data as the integrated luminosity is increased. To compare with the effect of the jet data, we multiply the contribution of the new data set to by a weight equal to the ratio of the number of jet data points to the number of individual data points. We have seen in Sec. III.1 that the CMS 7 TeV jet data Chatrchyan:2012bja , with 133 data points, has the dominant effect among all the jet data in CT14HERA2, so we multiply by the weights for the CMS, and for the ATLAS distributions, respectively. The -PDFs, obtained by updating the CT14HERA2mJ fit with the weighted distributions using ePump, are shown in Fig. 20. The general shapes of the updated -PDFs are similar to that obtained by including all four jet data in the CT14HERA2 fit. However, the error band of the -PDFs is not reduced as much as the CT14HERA2 fit for . Hence, we conclude that the jet data will probably impose a stronger constraint on the -PDF than the data, even with more integrated luminosity collected at a higher center-of-mass energy of the LHC.
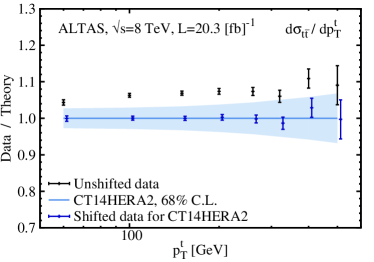
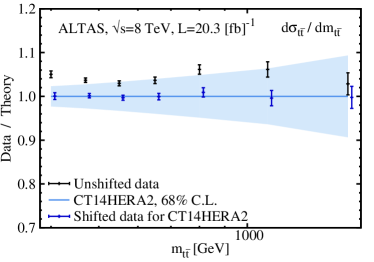
Before leaving this section, we comment on the impact of the ATLAS 8 TeV and data. Given the small values of in Table 5, we expect little change in the best-fit PDFs when only including these data to update either the CT14HERA2 or CT14HERA2mJ PDFs. This can happen when the theory prediction is in good agreement with the data even before updating. Fig. 21 shows that this is indeed the case for CT14HERA2, and similar results were found for CT14HERA2mJ. This is also demonstrated by the small per data point for these two data sets in Table 6. Therefore, the best-fit -PDF, updated by the or distribution, does not need to move far from their original position to have a good fit to the data. Another feature we observed from Table 6 is that the impact of the data to -PDF is consistent with the jet data included in the CT14HERA2 fit such that the values updated from CT14HERA2mJ are larger than those from CT14HERA2.
IV.2 ATLAS 7 TeV data
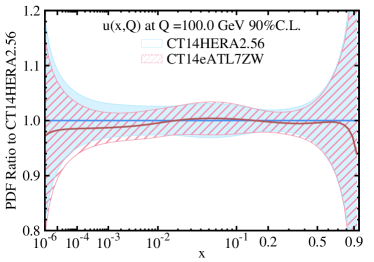
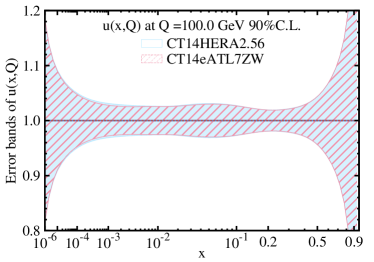


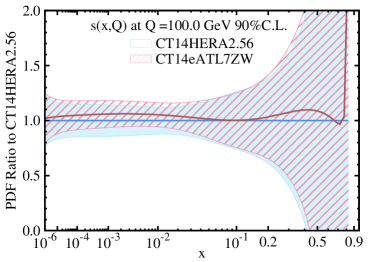
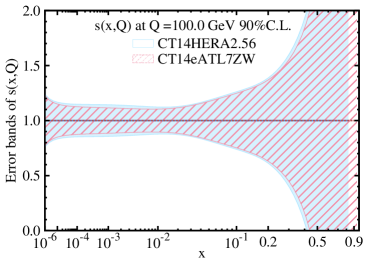
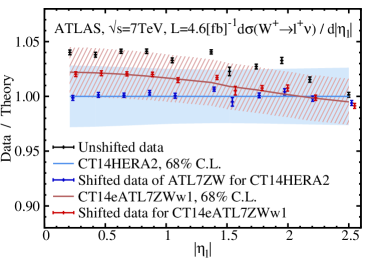
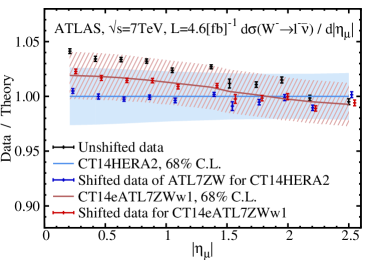
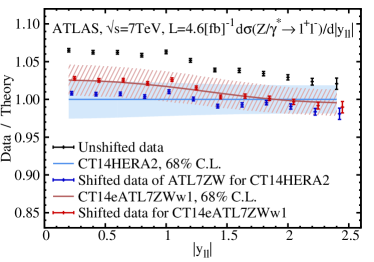
After observing the constraints of new LHC jet data Schmidt:2018hvu and data on the -PDFs, we would also like to see how new LHC Drell-Yan data could modify the quark PDFs. The low luminosity () ATLAS 7 TeV and cross section data Aad:2011dm were included in the CT14HERA2 fit. Since then, ATLAS has published the more precise ATLAS 7 TeV data with an integrated luminosity of Aaboud:2016btc . Here, we will study the impact of this more precise data on further constraining the CT14HERA2 PDFs. Strictly speaking, we should first remove the old ATLAS 7 TeV data from the CT14HERA2 global fit and then add the new ATLAS 7 TeV data with ePump, so as not to double count the ATLAS 7 TeV data contributions. However, since the two data sets are consistent and the new one has about 100 times the integrated luminosity as the old one, the impact of the double counting should be negligible. Therefore, we shall simply add the new ATLAS 7 TeV data to update the CT14HERA2 PDFs using ePump. Fig. 22 shows the updated PDFs. One can see that the new ATLAS 7 TeV and data have a sizable impact on the quark PDFs and their uncertainties, particularly for ranging from to a few times . On the one hand, this is understandable, because these data are very precise, with uncertainties less than the percent level. On the other hand, such a large difference between the updated PDFs and the original CT14HERA2 PDFs calls for further investigation.
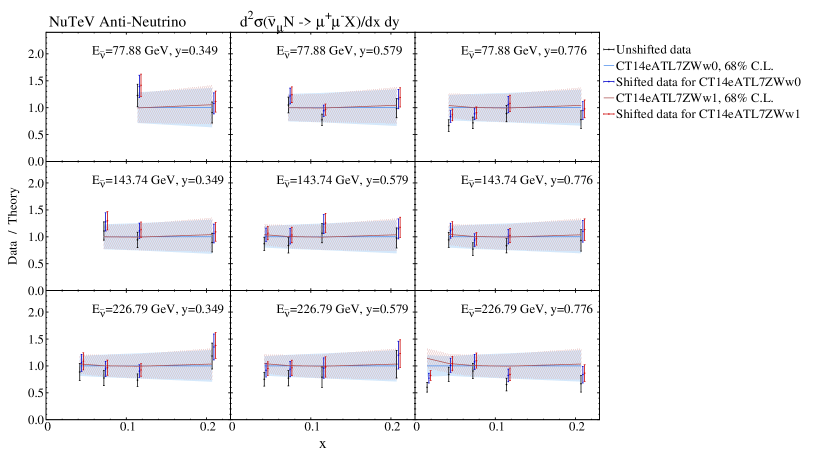
We note that the new ATLAS 7 TeV and data, to be denoted as “ATL7ZW” data from now on, with a total of 34 data points, cannot be fit well. Its per data point after the fit by ePump is found to be around 2.7, which is much larger than that found for the full CT14HERA2 global fit (about 1.25) with a total of 3287 data points. Let us consider the two measures, and , introduced in Ref. Schmidt:2018hvu to assess the quality of the fit given by ePump. Recall that these two measures are the length of the shift in the parameter space of the best-fit PDFs, relative to the original and to the updated 90% C.L. boundaries, respectively. The ePump output file gives after adding these data, which indicates that the shift of the best-fit parameters nearly touches the 90% C.L. boundary of the original CT14HERA2 fit. Furthermore, we find a value of , which implies that the original best-fit parameter point falls outside of the 90% C.L. region of the updated fit. This latter result, in particular, suggests that the points in the parameter space used to evaluate the new data may (though not necessarily) be outside the region of validity of the Hessian approximations. Thus, in this case, the result from ePump should be taken with caution, and the shift in the best-fit PDFs found in a true global fit may likely be larger than that given by the ePump program. With that said, we find from ePump updating that adding the ATLAS 7 TeV data to CT14HERA2 fit would decrease the and quark PDFs and increase the quark PDF at , and increase the PDF at around and . Also, the error band of the PDF is reduced significantly around , and the error band of the -PDF is reduced for nearly all values of .
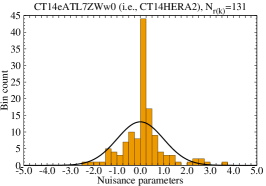
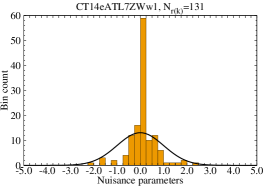
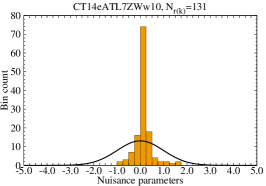
In addition to the single-value criteria, one can also compare the data and theory predictions point-by-point to reveal some more details about the quality of fit, as shown in Fig. 23. First, we find that there is an overall shift for all the raw data points. This means that the correlated systematic errors, weighted by their corresponding nuisance parameters, play an important role in the fitting. Fig. 24 shows the distributions of nuisance parameters, before and after updating with ePump. The solid curve in the figure shows a standard normal distribution with a mean value of 0 and standard deviation of 1. It shows that there are some large nuisance parameters before the updating. Given the large difference between data and theory for CT14HERA2 in Fig. 23, we conclude that ATLAS 7 TeV and data are not described well by the CT14HERA2 PDFs, so we expect a large impact of this data set to update the CT14HERA2 PDFs. Second, one can see that the ATLAS 7 TeV and data are more precise than the theory predictions, with PDF induced uncertainty included, and even after ePump updating the precision data still cannot be described well by the theory. This, together with the large contributions from the nuisance parameters, leads to the large for this data set.
Given the above discussion, we might expect some tension between the new ATLAS 7 TeV and data and the old data sets included in the CT14HERA2 fit. To examine this, we increase the weight of the ATLAS 7 TeV data while updating the CT14HERA2 PDFs using the ePump program. We can simultaneously obtain the updated predictions for all of the other CT14HERA2 data sets, by including them in ePump as new data, but with zero weight. In this fashion we can see how the fit to the original data sets change as the the new data is added, in order to investigate for possible tensions. Increasing the weight of the ATLAS data forces ePump to fit this data better; however, if some of the original CT14HERA2 data sets have tension with the data, they will be fitted worse as the weight of this data increases. As discussed in Ref. Dulat:2013hea , the goodness of fit to individual data set can be quantified by the variable “spartyness” , an equivalent Gaussian variable. A well-fitted data set should have between and 1. An smaller than means the data set is fitted “too” well and an larger than 1 indicates poor fitting.
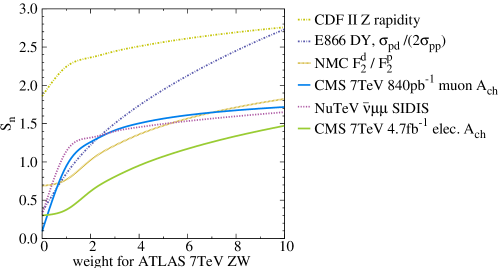
We find that most of the data sets in CT14HERA2 do not show appreciable tension with the ATLAS data. However, some data sets do exhibit tension, as shown in Fig. 25, which displays the change of spartyness for these affected data sets as the weight of the ATLAS data is increased from 0 to 10. Some of these data sets were not well-fitted before (weight=0) and become worse as the weight is increased, e.g., the CDF Run-2 rapidity data. Other of these data sets were well-fitted before, but become poorly fitted after the weight is increased, the most significant ones being the NuTeV SIDIS, the E866 data sets and the CMS 7 TeV and electron asymmetry data.
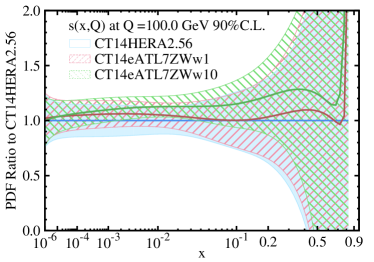
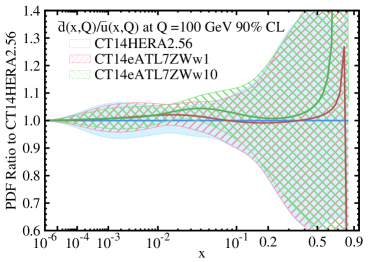
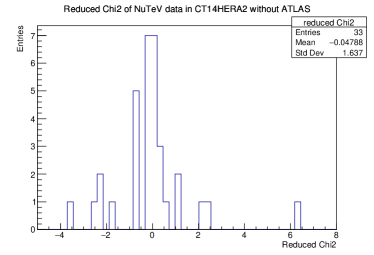
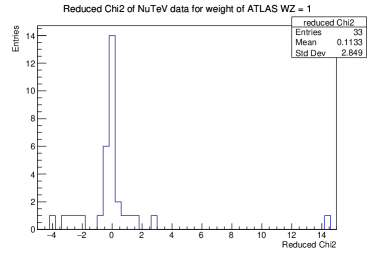
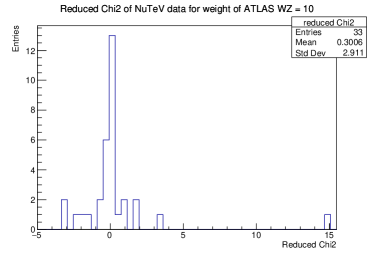
As discussed in Sec. III.3, the -PDF is mainly constrained by the (anti-)neutrino DIS charged current di-muon data, cf. Fig. 16, and the NuTeV SIDIS data impose the strongest constraint on -PDF among those four data sets. Fig. 26 shows the ePump updated -PDF with weights of 1 and 10 on the ATLAS data. We see that the ATLAS data prefer larger values of the -PDF, while the NuTeV data prefer smaller values at around a few times . When the weight of the ATLAS 7 TeV and data increases, the reduced of the NuTeV data point with and increases dramatically, as shown in Figs. 27 and 28, which indicates the tension between the ATLAS 7 TeV data and the NuTeV data.
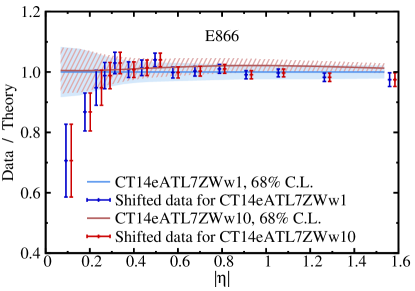
In Fig. 26, we also show the updated PDF ratio plot with weights of 1 and 10 on the ATLAS data. We find that the ATLAS data prefer a larger value of ratio at around to . This is to be compared with what we concluded in Sec. III that E866 data set is crucial for constraining and at around to , cf. Fig. 12. Therefore, increasing the weight of ATLAS 7 TeV data contradicts the fit of E866 data and leads to the tension. This can also be illustrated by the comparison between data and theory before and after ATLAS 7 TeV data set is included, see Fig. 29, where we find a deviation the theory predictions from the data for large rapidity when the weight of ATLAS 7 TeV data is increased from 1 to 10 .
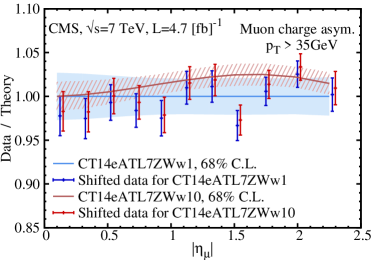
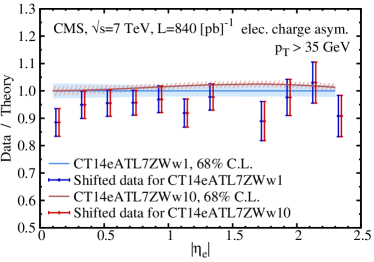
For the CMS asymmetry data, the tension with the ATLAS data can be demonstrated in the same way, by comparing theory with data for each data point, as the weight of ATLAS 7 TeV data is increased. In Figs. 30, the comparison are shown for CMS and electron asymmetry data. It is apparent that as the weight of ATLAS 7 TeV data is increased from 1 to 10, both the theory predictions of CMS and electron asymmetry have an overall upward shift compared to the data for almost all of the data points. Given the precision of the CMS data, this leads to a large , which is reflected by the rapid increase of spartyness in Fig. 25.
V Summary and Prospects
A fast and efficient tool for estimating the impact of new data on the PDFs is essential in this high precision era of the LHC. In this paper we have tested just such a tool, ePump, both as to its effectiveness and its validity.
We have validated ePump in three trials, where we started with a base PDF set obtained from a global fit with some subset of the CT14HERA2 data removed. We used ePump to update these base PDFs with the missing data sets, and then compared with the CT14HERA2 PDFs. In all three trials (updating with DIS, Drell-Yan, or jet data sets) the ePump results are very close to the CT14HERA2 global-fit results. This is important, because the goal is to have the best approximation to the full global fit as possible. Of course, there are some differences, but they are either small compared to the error bands, or happen in very small or large regions, where the PDFs depend strongly on the parameterization forms. Another case where the ePump approximations break down is when there are strong tensions between the new and old data. As we have seen, the global fit may increase the error bands, but this will never happen with ePump. Again, we emphasize that ePump is not meant to replace the global fit. However, even in situations with tensions between new and old data, it still gives qualitatively correct results, and therefore provides a useful tool for judging the impact of new data. In addition to updating PDFs, ePump can also update the observables at the same time without the need for recalculating. An example of this use of ePump was given for the predictions of .
A big advantage of ePump is that it can run very fast. This was exploited to study the impact of different data sets in the CT14HERA2 fit. Summaries of the impact of each of the data sets were given in Tables. 2, 3, and 4. The impact of each data set is strongest for some particular flavors and for its relevant region of . But it also depends on the precision of the data and its agreement with the current PDFs. Therefore, even for two data sets that that are sensitive to the same kinematic range and flavor content, they do not necessarily have the same effect on the PDFs. One remarkable thing we found is that among the 33 data sets in CT14HERA2, only 1 jet, 5 Drell-Yan and 8 DIS data sets333This includes HERA I+II data as well. have the dominant effects. Just by including these data sets, we can reproduce the bulk part of the CT14HERA2 fit. The other data sets are only responsible for some fine structures of the PDFs.
It is incredible that we can fit thousands of data points with only 27 or 28 parameters. This triumph strongly shows the effectiveness of the QCD improved parton model. In such an era of precision, it has become an important and indispensable task to reduce the uncertainties of PDFs. So the natural question is: “What kinds of observables can reduce the PDF uncertainties?” The purpose of ePump is to help answer this question. The “new” data to be investigated by ePump can be new experimental data, or it can be simulated pseudo-data, whose impact one might be interested to see. An example of this second scenario was presented in Ref. Willis:2018yln , where ePump was used to show that with increased precision and optimal choice of kinematic variables, the high-invariant-mass Drell-Yan processes can greatly reduce the PDF uncertainties. In this paper, we examined the impact of the latest data and and data at the LHC on the CT14HERA2 PDFs. We found that the data has the potential to reduce -PDF uncertainties given increased luminosity and that the high-precision and data also can provide strong constraints on the quark PDFs. Of course, these results will be refined quantitatively by a full global fit, but ePump can quickly assess the qualitative . Similar studies can also be done for other processes. We expect ePump to play an important role in the study of PDFs, and to assist in the understanding and reduction of theoretical errors in the current era of the high-luminosity LHC. The complete ePump package, together with detailed instructions for installing and file formatting, and additional output files relevant to this study, can be found at the website http://hep.pa.msu.edu/epump/.
Before closing this section, we would like to make two additional remarks. First, we note that the comparison made in this paper between the ePump and global fit analyses hold at any given fixed order, either next-to leading order or next-to-next-to leading order (NNLO), of theory calculations. Second, we note that the default xFitter profiling analysis Camarda:2015zba can be reproduced by ePump, but using a global tolerance set to 1. However, as discussed in the Appendix, setting tolerance to be 1 will greatly overestimate the impact of a given new data set when updating the existing PDFs in the CT PDF global analysis framework.
Acknowledgements.
We thank our CTEQ-TEA colleagues for support and discussions. This work was supported by the U.S. National Science Foundation under Grant No. PHY-1719914. C.-P. Yuan is also grateful for the support from the Wu-Ki Tung endowed chair in particle physics. The work of S. Dulat was supported by the National Natural Science Foundation of China under the Grant No. 11965020.Appendix A The role of the tolerance in updating of PDFs
When constructing Hessian eigenvector PDFs for error estimation, different PDF groups have made different choices for defining the PDF errors. This includes the choice of 68% versus 90% confidence levels (C.L.), the inclusion of a global tolerance , or the imposition of dynamical tolerances along different eigenvector directions. This has caused some confusion when the eigenvector PDFs are then used in the updating of PDFs with new data. We shall clarify this issue here in the context of ePump.
The basic premise of the Hessian approximation is that, near its global minimum, can be written as a quadratic function of the PDF parameters . For CT14HERA2 fit, or 27, depending on whether the gluon extreme sets are included or not. By shifting, rotating, and rescaling the PDF parameters, we can write for the original data sets as
| (1) |
The parameters have been chosen here so that (for all ) for the best-fit PDF set , while for the eigenvector PDFs . In this way, each of the eigenvector PDF sets correspond to a , where is an overall global tolerance parameter. If the various data sets were all internally consistent and satisfied Gaussian statistics, then one should use at the 68% C.L. or at the 90% C.L. However, due to inconsistencies between the various data sets, as well as uncertainties arising from the initial choice of PDF parametrization forms, the CTEQ-TEA group has historically chosen a larger value of at the 90% C.L.
Another variation in defining the Hessian PDF errors is in the imposition of dynamical tolerances, which have been used in recent CT Dulat:2015mca ; Hou:2016nqm and MMHT Harland-Lang:2014zoa PDF sets. The idea here is that if the constraints on a given PDF eigenvector direction comes dominantly from a single data set (or several self-consistent sets), then the overall global tolerance produces too large of a PDF error. By incorporating separate constraints from individual experiments one determines that a in the particular eigenvector direction should correspond to the given C.L. Keeping Eq. (1) unchanged, this implies that the Hessian eigenvector PDFs now must correspond to . (It can easily be seen that in the presence of dynamical tolerances, the global parameter scales out of all calculated observables.)
We emphasize here that, although the different choices of tolerance parameters (including whether global or dynamical), as well as the choice of 68% or 90% C.L, give different results and/or interpretations for the PDF errors, they all give a self-consistent description of around the global minimum.
The next step in updating the PDFs in the Hessian approach is to add the contribution of the new data set (or sets) to , yielding
| (2) |
where is the number of new data points, are the experimental data values, are the theoretical predictions, and is the experimental inverse covariance matrix. We have also included a weight factor that may be assigned to the new set of data, which by default is set to be 1. To linear order in the PDF parameters (assuming that a global tolerance is used), we can express the theoretical predictions as
| (3) |
where is the theoretical prediction of calculated with the error PDFs . We emphasize that Eq. (3) is valid only when corresponds to the error PDFs . At this stage, can now be minimized to obtain the new value of the best-fit parameters, which can be used to obtain updated best-fit PDFs. The generalization of Eq. (3) for dynamical tolerances, as well as the extension of this equation to include diagonal quadratic terms are given in Ref. Schmidt:2018hvu , and are implemented in ePump. In addition, ePump produces an updated set of error PDFs, under the same tolerance and confidence level assumptions of the original error PDFs.
Although these results were given previously in Ref. Schmidt:2018hvu , our purpose for restating them here is to make it clear that the choice of the global tolerance or the use of dynamical tolerances in the updating of the PDFs should not be chosen freely, but rather is determined by the original Hessian error PDF sets. In particular, if the error PDFs were determined using a global tolerance of , then the use of Eq. (3) is only consistent if the value is used in Eq. (2). It is straightforward to show that if the tolerance were set to in Eq. (2) while using such error PDFs, it is equivalent to weighting the new data by a factor in the update.
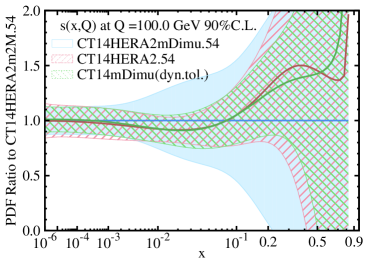
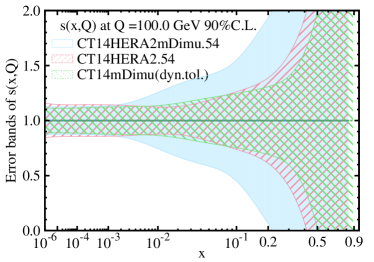
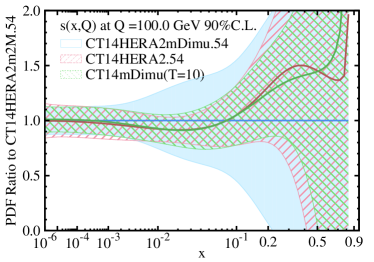
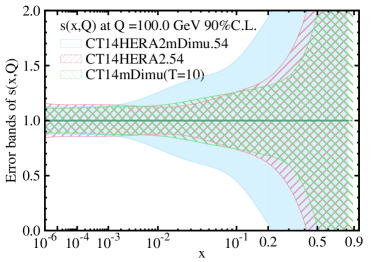
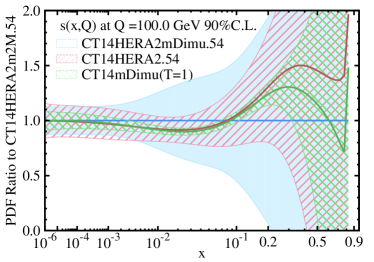
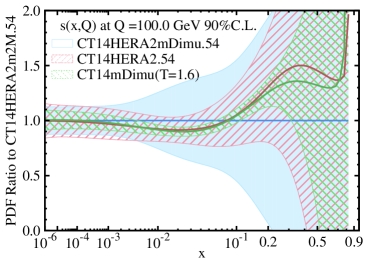
We exemplify this by performing the following exercise. As demonstrated in Section. III.3, the dimuon data are almost entirely responsible for constraining the -PDF. Therefore, we remove the dimuon data from the CT14HERA2 data sets and perform a new global fit, named CT14HERA2mDimu. Then we use ePump to add back the dimuon data. If everything works perfectly, we should expect that the ePump-updated -PDF will agree with CT14HERA2. Also, based on the present discussion, we should perform the update using the dynamical tolerances, but we shall also try other choices for the tolerance to see the results.
We first compare the update using dynamical tolerances with that using a global tolerance of . The results are shown in Fig. 31. In this case we find that these two updates give very similar predictions and reproduce CT14HERA2 very well. On checking the dynamical tolerance values for CT14HERA2mDimu, we discovered that the eigenvector directions that are most sensitive to the dimuon data have , which explains why the update is not much different when using a global .
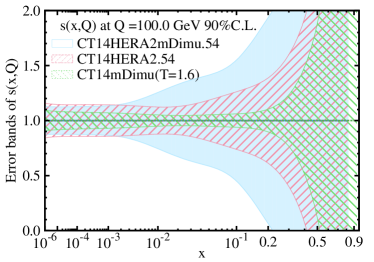
Next we display the results using global tolerance-squares of and . These correspond to the naive use of Gaussian statistics at the 68% and 90% C.L.’s, respectively, but are inconsistent with the error PDFs used in this update. As explained above, using these small values of with the given error PDFs is equivalent to overweighting this data by a large value. The -PDFs after these updates are shown in Fig. 32. Interestingly, the agreement of the best-fit updates are not too bad when compared with CT14HERA2 (though not as good as when using dynamical tolerances). This can be understood by the fact that the strange quark PDF is mostly determined by the dimuon data, so overweighting this data does not shift the central value by much. However, one can see that the -PDF error bands for these two values of the tolerance are much smaller than that of CT14HERA2, so that using or would greatly overestimate the effect of this data on reducing the PDF errors.

In conclusion, in order to best reproduce CT14HERA2 global fit, one should use dynamical tolerance in ePump. Setting tolerance to be 1 will greatly overestimate the impact of a given new data set when updating the existing PDFs in the CT PDF global analysis framework. This conclusion also holds for using MMHT2014 Harland-Lang:2014zoa and PDF4LHC15 Butterworth:2015oua PDFs in profiling analysis to study the impact of a new (pseudo-) data on updating the existing PDFs.
References
- (1) C. Schmidt, J. Pumplin, C. P. Yuan and P. Yuan, Phys. Rev. D 98, no. 9, 094005 (2018) doi:10.1103/PhysRevD.98.094005 [arXiv:1806.07950 [hep-ph]].
- (2) H. Paukkunen and P. Zurita, JHEP 1412, 100 (2014) doi:10.1007/JHEP12(2014)100 [arXiv:1402.6623 [hep-ph]].
- (3) H. Paukkunen and C. A. Salgado, Phys. Rev. Lett. 110, no. 21, 212301 (2013) doi:10.1103/PhysRevLett.110.212301 [arXiv:1302.2001 [hep-ph]].
- (4) S. Camarda et al. [HERAFitter developers’ Team], Eur. Phys. J. C 75, no. 9, 458 (2015) doi:10.1140/epjc/s10052-015-3655-7 [arXiv:1503.05221 [hep-ph]].
- (5) C. Willis, R. Brock, D. Hayden, T. J. Hou, J. Isaacson, C. Schmidt and C. P. Yuan, Phys. Rev. D 99, no. 5, 054004 (2019) doi:10.1103/PhysRevD.99.054004 [arXiv:1809.09481 [hep-ex]].
- (6) G. Aad et al. [ATLAS Collaboration], Phys. Rev. D 85, 072004 (2012) doi:10.1103/PhysRevD.85.072004 [arXiv:1109.5141 [hep-ex]].
- (7) T. J. Hou et al., Phys. Rev. D 95, no. 3, 034003 (2017) doi:10.1103/PhysRevD.95.034003 [arXiv:1609.07968 [hep-ph]].
- (8) H. Abramowicz et al. [H1 and ZEUS Collaborations], Eur. Phys. J. C 75, no. 12, 580 (2015) doi:10.1140/epjc/s10052-015-3710-4 [arXiv:1506.06042 [hep-ex]].
- (9) S. Dulat et al., Phys. Rev. D 93, no. 3, 033006 (2016) doi:10.1103/PhysRevD.93.033006 [arXiv:1506.07443 [hep-ph]].
- (10) T. Aaltonen et al. [CDF Collaboration], Phys. Rev. D 78, 052006 (2008) Erratum: [Phys. Rev. D 79, 119902 (2009)] doi:10.1103/PhysRevD.79.119902, 10.1103/PhysRevD.78.052006 [arXiv:0807.2204 [hep-ex]].
- (11) V. M. Abazov et al. [D0 Collaboration], Phys. Rev. Lett. 101, 062001 (2008) doi:10.1103/PhysRevLett.101.062001 [arXiv:0802.2400 [hep-ex]].
- (12) G. Aad et al. [ATLAS Collaboration], Phys. Rev. D 86, 014022 (2012) doi:10.1103/PhysRevD.86.014022 [arXiv:1112.6297 [hep-ex]].
- (13) S. Chatrchyan et al. [CMS Collaboration], Phys. Rev. D 87, no. 11, 112002 (2013) Erratum: [Phys. Rev. D 87, no. 11, 119902 (2013)] doi:10.1103/PhysRevD.87.112002, 10.1103/PhysRevD.87.119902 [arXiv:1212.6660 [hep-ex]].
- (14) S. Chatrchyan et al. [CMS Collaboration], Phys. Rev. D 90, no. 3, 032004 (2014) doi:10.1103/PhysRevD.90.032004 [arXiv:1312.6283 [hep-ex]].
- (15) S. Chatrchyan et al. [CMS Collaboration], Phys. Rev. Lett. 109, 111806 (2012) doi:10.1103/PhysRevLett.109.111806 [arXiv:1206.2598 [hep-ex]].
- (16) V. M. Abazov et al. [D0 Collaboration], Phys. Rev. D 77, 011106 (2008) doi:10.1103/PhysRevD.77.011106 [arXiv:0709.4254 [hep-ex]].
- (17) R. S. Towell et al. [NuSea Collaboration], Phys. Rev. D 64, 052002 (2001) doi:10.1103/PhysRevD.64.052002 [hep-ex/0103030].
- (18) D. A. Mason, doi:10.2172/879078
- (19) M. Goncharov et al. [NuTeV Collaboration], Phys. Rev. D 64, 112006 (2001) doi:10.1103/PhysRevD.64.112006 [hep-ex/0102049].
- (20) A. C. Benvenuti et al. [BCDMS Collaboration], Phys. Lett. B 223, 485 (1989). doi:10.1016/0370-2693(89)91637-7
- (21) A. C. Benvenuti et al. [BCDMS Collaboration], Phys. Lett. B 237, 592 (1990). doi:10.1016/0370-2693(90)91231-Y
- (22) M. Arneodo et al. [New Muon Collaboration], Nucl. Phys. B 483, 3 (1997) doi:10.1016/S0550-3213(96)00538-X [hep-ph/9610231].
- (23) J. P. Berge et al., Z. Phys. C 49, 187 (1991). doi:10.1007/BF01555493
- (24) U. K. Yang et al. [CCFR/NuTeV Collaboration], Phys. Rev. Lett. 86, 2742 (2001) doi:10.1103/PhysRevLett.86.2742 [hep-ex/0009041].
- (25) W. G. Seligman et al., Phys. Rev. Lett. 79, 1213 (1997) doi:10.1103/PhysRevLett.79.1213 [hep-ex/9701017].
- (26) A. Aktas et al. [H1 Collaboration], Eur. Phys. J. C 40, 349 (2005) doi:10.1140/epjc/s2005-02154-8 [hep-ex/0411046].
- (27) H. Abramowicz et al. [H1 and ZEUS Collaborations], Eur. Phys. J. C 73, no. 2, 2311 (2013) doi:10.1140/epjc/s10052-013-2311-3 [arXiv:1211.1182 [hep-ex]].
- (28) F. D. Aaron et al. [H1 Collaboration], Eur. Phys. J. C 71, 1579 (2011) doi:10.1140/epjc/s10052-011-1579-4 [arXiv:1012.4355 [hep-ex]].
- (29) G. Moreno et al., Phys. Rev. D 43, 2815 (1991). doi:10.1103/PhysRevD.43.2815
- (30) J. C. Webb et al. [NuSea Collaboration], hep-ex/0302019.
- (31) F. Abe et al. [CDF Collaboration], Phys. Rev. Lett. 77, 2616 (1996). doi:10.1103/PhysRevLett.77.2616
- (32) D. Acosta et al. [CDF Collaboration], Phys. Rev. D 71, 051104 (2005) doi:10.1103/PhysRevD.71.051104 [hep-ex/0501023].
- (33) R. Aaij et al. [LHCb Collaboration], JHEP 1206, 058 (2012) doi:10.1007/JHEP06(2012)058 [arXiv:1204.1620 [hep-ex]].
- (34) V. M. Abazov et al. [D0 Collaboration], Phys. Lett. B 658, 112 (2008) doi:10.1016/j.physletb.2007.10.046 [hep-ex/0608052].
- (35) T. A. Aaltonen et al. [CDF Collaboration], Phys. Lett. B 692, 232 (2010) doi:10.1016/j.physletb.2010.06.043 [arXiv:0908.3914 [hep-ex]].
- (36) V. M. Abazov et al. [D0 Collaboration], Phys. Rev. D 91, no. 3, 032007 (2015) Erratum: [Phys. Rev. D 91, no. 7, 079901 (2015)] doi:10.1103/PhysRevD.91.032007, 10.1103/PhysRevD.91.079901 [arXiv:1412.2862 [hep-ex]].
- (37) url = “http://hep.pa.msu.edu/epump/”
- (38) V. Barone, C. Pascaud and F. Zomer, Eur. Phys. J. C 12, 243 (2000) doi:10.1007/s100529900198 [hep-ph/9907512].
- (39) V. Khachatryan et al. [CMS Collaboration], JHEP 1703, 156 (2017) doi:10.1007/JHEP03(2017)156 [arXiv:1609.05331 [hep-ex]].
- (40) V. Khachatryan et al. [CMS Collaboration], Eur. Phys. J. C 75, no. 11, 542 (2015) doi:10.1140/epjc/s10052-015-3709-x [arXiv:1505.04480 [hep-ex]].
- (41) G. Aad et al. [ATLAS Collaboration], Eur. Phys. J. C 76, no. 10, 538 (2016) doi:10.1140/epjc/s10052-016-4366-4 [arXiv:1511.04716 [hep-ex]].
- (42) M. Aaboud et al. [ATLAS Collaboration], Eur. Phys. J. C 77, no. 6, 367 (2017) doi:10.1140/epjc/s10052-017-4911-9 [arXiv:1612.03016 [hep-ex]].
- (43) S. Dulat, T. J. Hou, J. Gao, J. Huston, J. Pumplin, C. Schmidt, D. Stump and C.-P. Yuan, Phys. Rev. D 89, no. 7, 073004 (2014) doi:10.1103/PhysRevD.89.073004 [arXiv:1309.0025 [hep-ph]].
- (44) L. A. Harland-Lang, A. D. Martin, P. Motylinski and R. S. Thorne, Eur. Phys. J. C 75, no. 5, 204 (2015) doi:10.1140/epjc/s10052-015-3397-6 [arXiv:1412.3989 [hep-ph]].
- (45) J. Butterworth et al., J. Phys. G 43, 023001 (2016) doi:10.1088/0954-3899/43/2/023001 [arXiv:1510.03865 [hep-ph]].