Mathematical Modeling as a Means to Capacity Building in 21st Century STEM Careers
Abstract
Mathematicians have traditionally been a select group of academics that produce high-impact ideas allowing substantial results in several fields of science. Throughout the past 35 years, undergraduates enrolling in mathematics or statistics have represented a nearly constant rate of approximately 1% of bachelor degrees awarded in the United States. Even within STEM majors, mathematics or statistics only constitute about 6% of undergraduate degrees awarded nationally. However, the need for STEM professionals continues to grow and the list of needed occupational skills rests heavily in foundational concepts of mathematical modeling curricula, where the interplay of measurements, computer simulation and underlying theoretical frameworks takes center stage. It is not viable to expect a majority of these STEM undergraduates would pursue a double-major that includes mathematics. Here we present our solution, some early results of implementation, and a plan for nationwide adoption.
Keywords: Modeling, STEM Education, Mathematical Modeling, Mathematics Minor, Data-Driven Science, Big Data, Data Science.
Funding: Portions of this work were funded by grant number DUE-1356397, from the National Science Foundation, and index number E21454, from the Department of Mathematics & Statistics of East Tennessee State University.
AMS subject classifications: 97D10, 97M10, 97M20, 97M40, 97M50, 97M60, 97Q10, 62P99, 90B99, 92F99, 97R20, 97R30.
1 Introduction
A period of three decades is short within the timeline of a modern society. Yet, from 1990 to date we have witnessed scientific and technological innovations evolve to become mainstream. A succinct summary of examples selected by the authors is illustrated in Figure 1. A common factor across these accomplishments is the ever growing interdisciplinary collaboration. In the latter part of the 20th century, one of the worst communicable diseases that circulated as a global epidemic was caused by the human immunodeficiency virus (HIV). From the mid 1980’s through the mid 1990’s, interdisciplinary teams of immunologists, virologists, applied mathematicians and statisticians eventually succeeded in finding the means to interrupt the life cycle of HIV while extending the life expectancy of infected patients. An important breakthrough came in 1996 from the Theoretical Biology and Biophysics group at Los Alamos National Laboratory, a facility created by the United States Department of Energy with an original emphasis on nuclear physics during the era of the Manhattan project, when mathematical models describing the interaction between infected cells and virus particles were fitted to viral load measurements [20]. The first estimates from patient data of the viral life cycle duration were incredibly insightful in re-designing clinical trials that eventually evolved into successful HIV treatment.
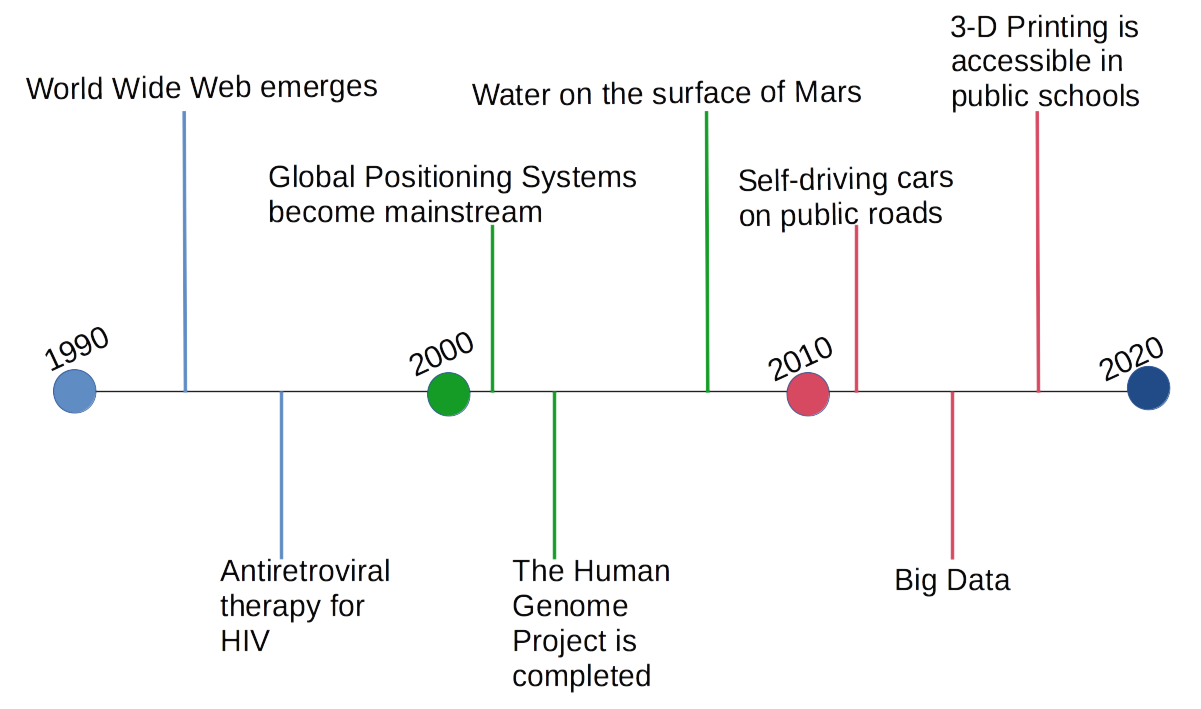
One could argue that two contributing factors of the Big Data revolution in the early 21st century include the establishment of the World Wide Web and the completion of the Human Genome Project during the 1990’s and the 2000’s, respectively. More and more, professionals in Science, Technology, Engineering, and Mathematics (STEM) benefit from extended workforce preparation that includes proficiencies in areas related but outside of their primary specialty field. Examples would include: an immunologist who is well-versed in statistical experimental design; an engineer who is seasoned in data visualization; and a computer programmer who is competent in molecular biology. Integrated STEM is the key to success; the shift from silos in STEM (i.e., the four areas taught and learned separately) to integrated STEM [28] is the paradigm variation that we believe is fundamental to tackle the next generation of societal problems.
This article is organized as follows. We discuss the nationwide production of STEM professionals in section 2, followed by career profiles in section 3 as established from federal government databases. Employment forecasts at national and regional levels are addressed in section 4. Section 5 conveys how the modeling process relates to the process of science (or scientific method). Our proposed minor in mathematical modeling is discussed in section 6, followed by preliminary results, in section 7, of a pilot implementation held at East Tennessee State University (home institution of the authors). Section 8 summarizes some concluding remarks.
2 STEM Undergraduate Degrees Awarded
We argue here that undergraduate mathematics programs across the country are not at capacity in terms of enrollment and graduation rates. However, substantial growth can be sustained in applied mathematics instruction, if suitable target populations are brought together with a common foundation, such as mathematical modeling.
Longitudinal measurements for the number of Bachelor’s degrees in STEM are displayed in Figure 2, with five-year steps from 1971 through 2006 and then in annual steps afterwards. The counts in Figure 2 were collected by the United States (U.S.) Department of Education [14] from institutions with Title IV federal financial aid programs.
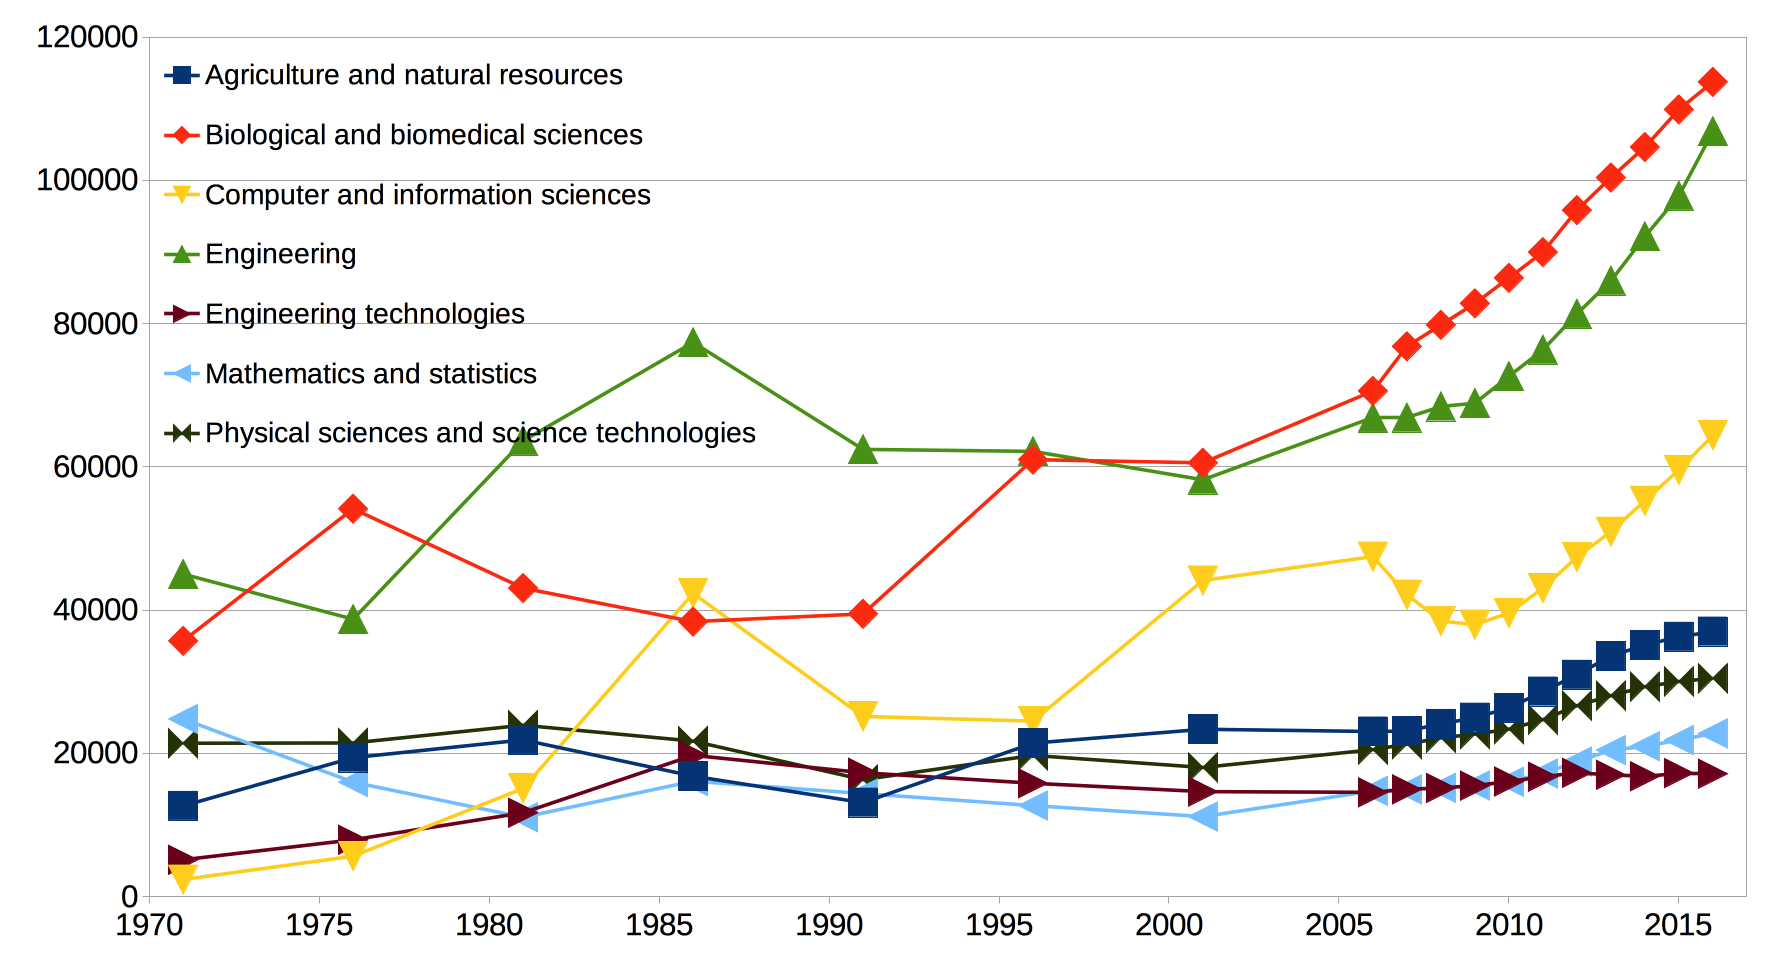
In 1971, the total number of people earning undergraduate degrees, across all disciplines in the U.S., added up to approximately eight hundred thousand. By 2016, this total was just under two million [14]. On average, 18% of undergraduate degrees nationwide are awarded in STEM disciplines. The degrees quantified in Figure 2 are classified in seven areas (see caption), where Agriculture and natural resources include agriculture, agriculture operations & related sciences, and natural resources & conservation. Additionally, Engineering technologies comprise engineering technologies & engineering-related fields, construction trades, and mechanic & repair technologies. Moreover, Physical sciences and science technologies encompass chemistry, physics, astronomy, earth sciences, ocean sciences, and atmospheric sciences.
In Figure 1 we considered selected innovations during 1990–2020. Figure 2 includes data, in the preceding period 1971–1986, as baseline. It is observed that most STEM areas undergo growth (i.e., positive average rate of change) during 1990–2016. Specifically, in 1990 through 2000 there were three (out of seven) STEM areas experiencing growth, while throughout 2000–2010 there were five areas, followed by six areas from 2010 to 2016. Clearly, biology, engineering, and computing underwent substantial growth half-way through the second decade of the 21st century.
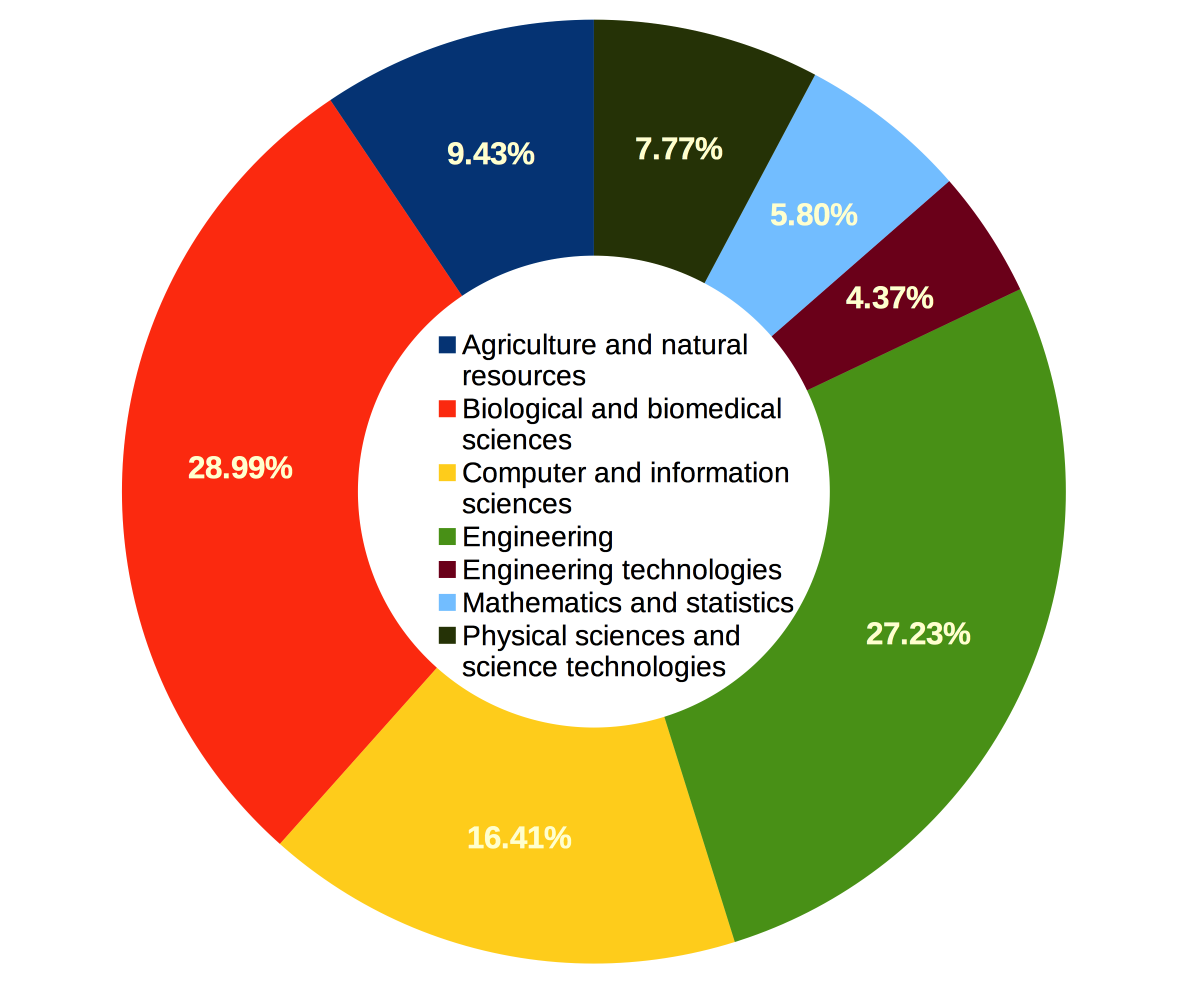
At each time point in Figure 2 there is a distribution of Bachelor’s degrees. Figure 3, in the bottom panel, depicts such distribution corresponding to 2016. Most STEM graduates (nearly 73%) fall within the areas with greatest growth, as seen in Figure 2 during 2011–2016. But where are the “quants”? The latter are often referred to as “the rocket scientists” of the financial world, they are people prone to mathematical abstraction with substantial understanding of complex mathematical models, who easily blend probabilistic and mathematical skills with computing. Nearly 6% of undergraduate degrees in all STEM areas are in mathematics and/or statistics, which would naturally supply a pipeline of quants.
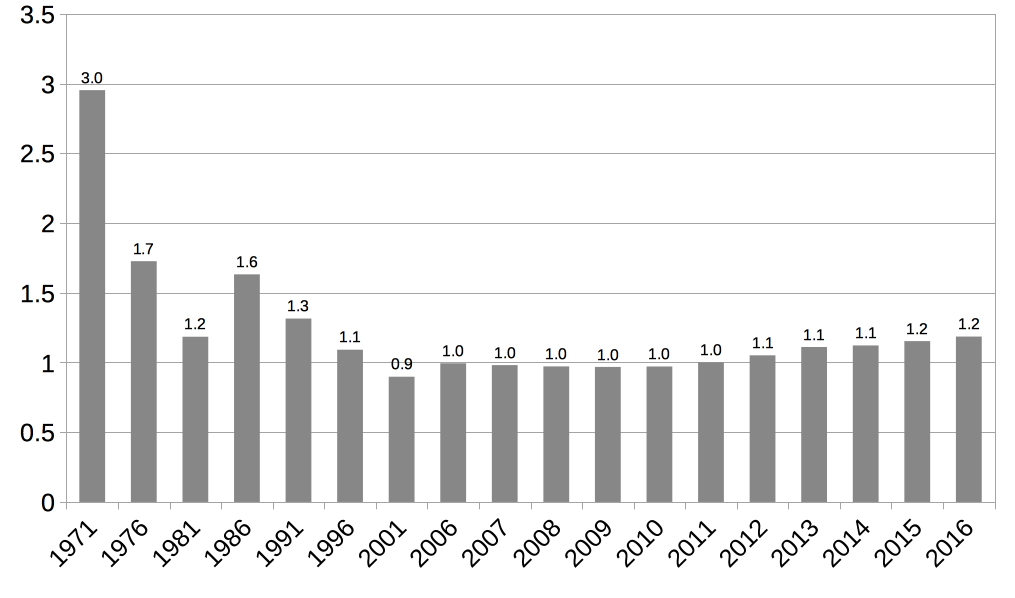
Across all disciplines in the U.S., quants are one-percenters. This is documented in the upper panel of Figure 3, where the percentage of individuals earning undergraduate degrees in mathematics and/or statistics is displayed versus time, with the same scale as in Figure 2. For the better part of 35 years, between 1981 and 2016, a steady state (or horizontal asymptote) is observed, ranging from 0.9% to 1.6% with a 5-year average by 2016 equal to 1.1%. According to the U.S. Department of Labor [19], members of this one percent join the workforce with some of the following job titles: Psychometric Consultant; Demographer; Trend Investigator; Agent-Based Modeler; Cryptographic Vulnerability Analyst; Emerging Solutions Executive; and Simulation Modeling Engineer.
Increasing the number of students majoring in either mathematics or statistics remains a supreme challenge. Even though such gains would alter the 1% across all disciplines nationwide and the 6% within STEM, they are expected to be modest or nominal at best, thus implying not sufficient room for growth. On the other hand, efforts to increase the number of mathematics minors have favorable odds, with target pools of 99% across all disciplines and 94% within STEM areas. In the next section, we review some facts about a sample of STEM occupations as reported by the U.S. Department of Labor [5, 19].
3 STEM Career Profiles
We selected eight STEM occupations, in part because commonly their undergraduate curricula would require Calculus I & II. Later in section 6, we propose a mathematical modeling minor that has these two courses as part of the foundational or required coursework. The sample of occupations is specified in upper part of Table 1 with a color-code. It must be noted that we assume both occupations Biologist and Biological Scientist are analogous.
The facts we discuss in this section were obtained from the Occupational Information Network [19], which is maintained by the U.S. Department of Labor. This comprehensive database of worker attributes and job characteristics, for nearly one thousand occupations, covers the entire U.S. economy. Furthermore, the Occupational Information Network describes occupations in terms of the knowledge, skills, and required abilities, along with how the work is performed with reference to tasks, work activities, and other descriptors. Codes of the Standard Occupational Classification system are available in the appendix A, they can be used to search career profiles in [5, 19].
| Science | Technology | Engineering | Mathematics | |
| Biologists | Computer Programmers | Biomedical Engineers | Mathematicians | |
| Chemists | Industrial Engineers | Statisticians | ||
| Physicists | ||||
| Common Soft Skills | ||||
| Analytical thinking | ||||
| Attention to detail | ||||
| Occupation-Specific Soft Skills | ||||
| Integrity | Biologists | Computer Programmers | Biomedical Engineers | Statisticians |
| Chemists | Industrial Engineers | |||
| Physicists | ||||
| Cooperation | Biologists | Computer Programmers | Biomedical Engineers | |
| Chemists | ||||
| Dependability | Chemists | Industrial Engineers | Statisticians | |
| Initiative | Biologists | Industrial Engineers | ||
| Physicists | ||||
| Persistence | Physicists | Biomedical Engineers | Mathematicians | |
| Independence | Computer Programmers | Statisticians | ||
| Innovation | Mathematicians | |||
Table 1 provides a summary of soft skills for eight occupations representing STEM areas. Information about soft skills is gathered utilizing a two-stage design with standardized questionnaires [19], where: (1) a statistically random sample of businesses expected to employ workers in the targeted occupations is identified and; (2) a random sample of workers in those occupations within those businesses is selected.
For every occupation listed in Table 1 the U.S. Department of Labor records 16 soft skills (see appendix B) with a ranking determined by questionnaire responses. In other words, for each occupation one may learn which skills rank at the top, middle, and bottom. After examining the top five soft skills across eight occupations, we found out that two are common to all occupations, namely: Analytical Thinking, and Attention to Detail. The former involves analyzing information and using logic to address work-related issues, while the latter requires carefulness and thoroughness in work tasks completion.
Integrity is almost a common soft skill, missing only one of the eight occupations. On the other hand, Cooperation, Dependability, and Persistence, represent three of the four STEM areas with at least three occupations per skill. Furthermore, Initiative is typical in three occupations split into two STEM areas. Lastly, Independence features in only two occupations, while Innovation is found in just one.
In Table 3 we summarize hard skills as determined by technology proficiencies. We used the following four main fields, identified by the U.S. Department of Labor as hot technologies [19] because they are requirements frequently included in employer job postings: (i) data base user interface and query software (e.g. SQL); (ii) object or component oriented development software (e.g. C++, Python, R); (iii) operating system software (e.g. Linux); (iv) analytical or scientific software (including MATLAB, SAS, Minitab).
STEM occupations listed in Table 3 are ranked by the number of hot technologies, where those with most are at top, while those with fewer hard skills appear downward. By reading Table 3 row-by-row we would learn that hot technologies are relevant to all areas of STEM, since six (out of eight) occupations record at least 5 hard skills, and even the occupations with just 3-to-4 hard skills cover databases, object oriented programming and data analysis. On the other hand, by reading Table 3 vertically or columnwise we find that the structured query language, commonly known as SQL, is featured by almost all of the STEM occupations, with Biomedical Engineers being the exception. Moreover, component oriented programming as evidenced by C++ proficiency is pertinent to all eight occupations, whereas seven occupations (excluding Chemists) learn either Python or R or both. Furthermore, software packages for data analysis (e.g., either R, SAS, or Minitab) are only not recorded for Physicists, thus involving seven occupations. Lastly, in an era of fast evolving cloud computing, competency about the Linux operating system is relevant because it is the internet backbone, and most of the fastest supercomputers run on Linux. Table 3 suggests that six occupations have Linux as a hot technology.
Hard (technology) skills in selected STEM occupations [19]. Occupation SQL C++ Python R Linux MATLAB SAS Minitab Mathematicians ✓ ✓ ✓ ✓ ✓ ✓ ✓ ✓ Statisticians ✓ ✓ ✓ ✓ ✓ ✓ ✓ Industrial Engineers ✓ ✓ ✓ ✓ ✓ ✓ ✓ Biologists ✓ ✓ ✓ ✓ ✓ ✓ Computer Programmers ✓ ✓ ✓ ✓ ✓ ✓ Physicists ✓ ✓ ✓ ✓ ✓ Biomedical Engineers ✓ ✓ ✓ ✓ Chemists ✓ ✓ ✓
Industries with the highest levels of employment for eight STEM occupations (color-code as in Table 1). No. Occ. denotes the number of employed occupations (out of eight) per industry [5]. Industry No. Occ. S T E M Scientific Research and Development Services 6 Federal Executive Branch 5 Colleges, Universities, and Professional Schools 5 Architectural, Engineering, and Related Services 3 Management, Scientific, and Technical Consulting Services 3 Pharmaceutical and Medicine Manufacturing 3 General Medical and Surgical Hospitals 2 State Government 2
The Bureau of Labor Statistics [5] reports the five top employing industries per occupation. Table 3 lists industries that employ two or more occupations, ranking them such that those appearing at top employ the most. Moreover, STEM areas are depicted with the same color-code of Table 1. The industry that hires professionals from all areas of STEM (with five out of eight occupations) is academia, that is, higher education. Scientific research and development services employ six occupations, leaving out Industrial Engineers and Computer Programmers, while representing three STEM areas. Federal and state governments are employers of two STEM areas each: Science and Mathematics at the federal level versus Technology and Mathematics at the state level. Moreover, the federal executive branch recruits five occupations that include Biological Scientists, Chemists, Physicists, Mathematicians, and Statisticians, whereas state governments (excluding schools and hospitals) take on Computer Programmers and Statisticians.
In appendix C the educational levels observed in job markets (based on responses collected by the U.S. Department of Labor [19]) are summarized in Table 9. The levels of education or formal training are widespread for the eight STEM occupations, ranging from Some College all the way through Postdoctoral Training. The former includes post-secondary certificates awarded for completed training after high school, e.g. in agriculture, computer services, engineering technologies, or healthcare, to mention a few. Four occupations are recorded with formal training up to a Doctoral degree, namely: Physicists, Biomedical Engineers, Mathematicians, Statisticians. On the other hand, two occupations have formal training up to a Bachelor’s degree: Computer Programmers, Industrial Engineers.
Estimates of annual wages reported by the Bureau of Labor Statistics (see appendix C) imply three brackets while examining the median across all eight occupations, specifically: from $75,000 to $77,000; from $84,000 to $88,000; and from $100,000 to $121,000. On one hand, occupations with more advanced formal training, such as Physicists and Mathematicians, fall within the bracket with highest wages. On the other hand, occupations with modest formal training (e.g., Industrial Engineers and Computer Programmers) do not have the lowest wages, in fact, they fall within the second bracket.
Institutions of higher education play a pivotal role in supplying job markets with professionals that have hard skills, which at times are considered in high-demand. In the next section we review employment projections, by the U.S. Department of Labor [19], for eight STEM occupations.
4 Projected Employment in National versus Regional Job Markets
Table 2 summarizes employment forecasts in the U.S. corresponding to the decade 2016–2026 [19]. The second column specifies lower and upper bounds for the workforce size per STEM occupation, where the lower bound is the measurement in 2016 while the upper bound is a projection for 2026. The relative percent change, in the third column, is computed using these bounds. The expected number of job openings per year is reported in the last column.
STEM occupations in Table 2 are ranked by the employment relative percent change at the national level, which quantifies projected employment growth. All heavily quantitative STEM occupations have projected employment growth between 15% and 34%, and thus are considered by the U.S. Department of Labor as growing much faster than average. Industrial Engineers have a job market growing faster than average, with a 10% employment relative percent change. Occupations with average projected employment growth (from 5% to 9%) include Biological Scientists, Biomedical Engineers, and Chemists. Lastly, at the national level, Computer Programmers have an expected decline in employment with a relative percent change equal to .
| STEM | Employment | Employment Relative | Projected Annual |
| Occupation | from 2016 to 2026 | Percent Change | Job Openings |
| Statisticians | 37200 to 49800 | 34% | 4400 |
| Mathematicians | 3100 to 4000 | 29% | 300 |
| Physicists | 17900 to 20500 | 15% | 1700 |
| Industrial Engineers | 257900 to 283000 | 10% | 19700 |
| Biological Scientists | 38700 to 41800 | 8% | 3700 |
| Biomedical Engineers | 21300 to 22800 | 7% | 1600 |
| Chemists | 88300 to 94000 | 6% | 8600 |
| Computer Programmers | 294900 to 273600 | 15500 |
Examining the size of the workforce across all occupations one finds that there are under five thousand Mathematicians employed in the U.S. Moreover, most occupations (five out of eight) have sizes in the tens of thousands and only two occupations have sizes in the hundreds of thousands. In fact, while Computer Programmers have an expected employment decline in 2016 – 2026, there are nearly three hundred thousand people employed under this occupation. The two occupations with the largest workforce sizes coincide with those having a modest level of education or formal training, while earning median annual wages above $84,000 (see appendix C).
Next, we have chosen to contrast the nationwide employment trends with analogous statistics at regional scales. As a case study, we focus on the Appalachian Region with two main motivations: (i) East Tennessee State University is located within this part of the U.S.; (ii) we the authors have an aggregate professional experience in higher education exceeding half a century, which has been enhanced by working closely (e.g. undergraduate research, career readiness, etc.) with undergraduate students who completed their K–12 education in several locations across the Appalachian Region.
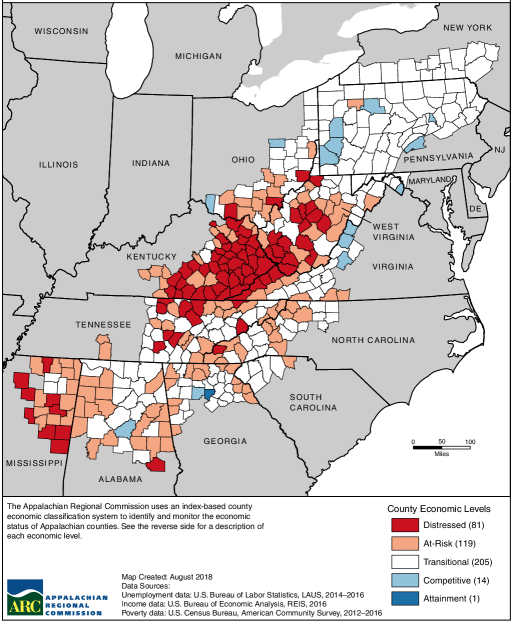
The Appalachian Mountains extend from northern Mississippi through southern New York [2]. Areas along a vicinity of this mountain system define the Appalachian Region, which covers a 205,000-square-mile section of land. Approximately, 42% of the Appalachian Region’s population is rural, in contrast to 20% of the United States population. The Appalachian Region includes 420 counties in 13 states, namely: Alabama; Georgia; Kentucky; Maryland; Mississippi; New York; North Carolina; Ohio; Pennsylvania; South Carolina; Tennessee; Virginia; and West Virginia.
The economy in the Appalachian Region was traditionally dependent on mining, forestry, agriculture, chemical industries, and heavy industry [2]. More recently, this economy has expanded to include manufacturing and professional service industries. Opportunities for economic growth still remain a challenge. Case in-point: as of 2012 – 2016 there are 93 high-poverty counties in the Appalachian Region, where the poverty rates exceed more than 1.5 times the U.S. average [2].
Post-secondary education basically correlates with economic status (see appendix D) within the Appalachian counties. Figure 4 depicts college completion rates at the county level, where such rate was measured as the percentage of people who are 25 years old (or older) having a minimum educational level determined by a Bachelor’s degree. The national average is a college completion rate of 30.3%, while the average across Appalachian counties equals 23.2%. There are three Appalachian states that coincide in sustaining high incidence of economic distress, together with college completion rates below regional and national averages, specifically: Kentucky; Tennessee; and West Virginia. Several counties neighboring the border between Kentucky and Tennessee have college completion rates between 5.2% and 14.6%. Moreover, nine Appalachian counties along the eastern state line of Tennessee have the following college completion rates: 5.2–14.6% (five counties); 14.7–21.4% (three counties); and 21.5–31.8% (one county). The state of West Virginia is unique in the sense that all of its counties are part of the Appalachian Region. In West Virginia, most counties have college completion rates ranging from 5.2% to 21.4%.
Employment trends, analogous to those summarized in Table 2, were examined for each of the 13 states in the Appalachian Region (see Tables 11 – 23 in appendix E). We contrast here two states: Pennsylvania where there is a sizable number of Appalachian counties with college completion rates between 14.7% and 31.8%; versus Tennessee with a considerable prevalence of completion rates at a lower range, that is, over 5.2% and under 21.4%. More specifically, Pennsylvania has a midpoint college completion rate of 23.2%, which nearly doubles (by a factor of 1.7) Tennessee’s 13.3%.
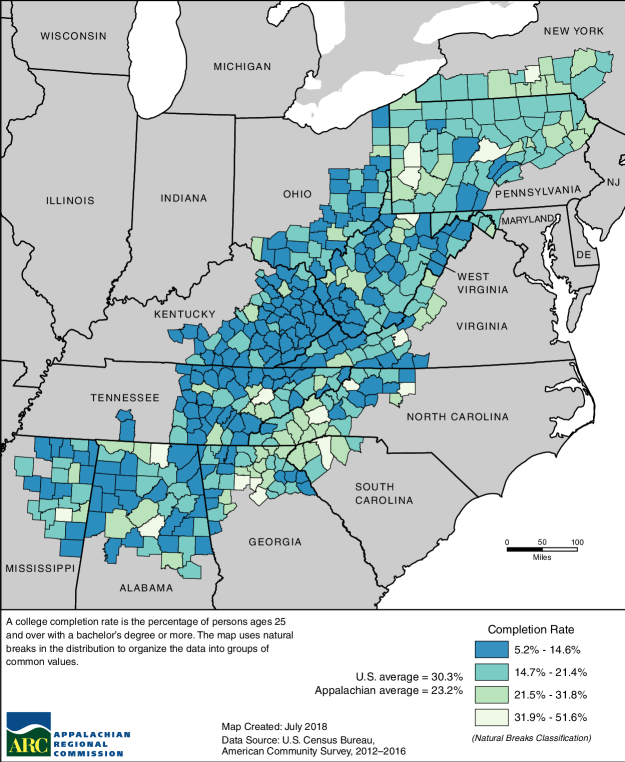
Table 3 displays employment projections for eight STEM occupations in Tennessee and Pennsylvania, in analogy to Table 2. For each state, the STEM occupations are ranked by the employment relative percent change. At the state level, some occupations do not have available data (see appendix E), this is indicated with the abbreviation N/A (e.g., Mathematicians in Tennessee).
| STEM | Employment | Employment Relative | Projected Annual |
| Occupation | from 2016 to 2026 | Percent Change | Job Openings |
| Tennessee | |||
| Statisticians | 620 to 840 | 36% | 80 |
| Industrial Engineers | 6670 to 8190 | 23% | 620 |
| Physicists | 240 to 280 | 20% | 30 |
| Biomedical Engineers | 300 to 330 | 11% | 20 |
| Computer Programmers | 4430 to 4890 | 10% | 340 |
| Chemists | 1150 to 1250 | 9% | 120 |
| Biological Scientists | 320 to 350 | 8% | 30 |
| Mathematicians | N/A | N/A | N/A |
| Pennsylvania | |||
| Statisticians | 2720 to 3620 | 33% | 320 |
| Mathematicians | 80 to 100 | 30% | 10 |
| Industrial Engineers | 9380 to 10350 | 10% | 720 |
| Biomedical Engineers | 1020 to 1090 | 7% | 80 |
| Physicists | 290 to 310 | 7% | 30 |
| Biological Scientists | 860 to 910 | 6% | 80 |
| Chemists | 5420 to 5600 | 3% | 500 |
| Computer Programmers | 13910 to 12730 | 710 | |
In Tennessee, STEM occupations can be divided into three groups in relation to employment growth as follows: much faster than national average; faster than national average; and commensurate with national average. Quantitative occupations, such as, Statisticians and Physicists, have a favorable expected growth. Although N/A is reported for one occupation, for the rest employment decline is not expected (unlike Computer Programmers at the national level, see Table 2).
Employment trends in Pennsylvania have more similarities with those at the national level, where occupations can be classified into four groups by means of employment relative percent change. That is, the same three groups identified for Tennessee in addition to decline. Computer Programmers are expected to undergo employment reductions both in Pennsylvania, at , and nationwide, at .
After comparing Table 2 and Table 3, it is confirmed that the ranking of STEM occupations is specific to each state. There are, however, features that are common to Tennessee, Pennsylvania, and the U.S. For example, quantitative occupations tend to have a top ranking in all three instances: Statisticians and Physicists are first and third in Tennessee, respectively; Statisticians and Mathematicians are the top two in Pennsylvania; and all three occupations are in the top three nationwide. Furthermore, the size of workforce for the two largest occupations scales accordingly from a national level into a state level. In other words, Computer Programmers and Industrial Engineers maintain, at the state level, workforce sizes that are one or two orders of magnitude larger than the other occupations.
We feel strongly that mathematical modeling can be a tipping point in the job market landscape, that is, it may trigger employment growth in states with college completion rates below national and/or regional averages. In fact, modeling may resonate with occupations that are actively involved with the scientific method (or process of science). In the next section, we elaborate in more detail our claim while including some pertinent literature.
5 Process of Science versus Mathematical Modeling
The process of science, also commonly referred to as “the scientific method”, includes several stages or steps that interactively evolve into what we know as science. For many, such process is a means to do research yielding scientific theories and eventually scientific laws. As explained in [27]: “science is both a body of knowledge and the process for building that knowledge”. The left panel of Figure 5 summarizes the process of science. Testing ideas, including hypotheses, is central for knowledge generation emerging out of experiments and detailed observations.
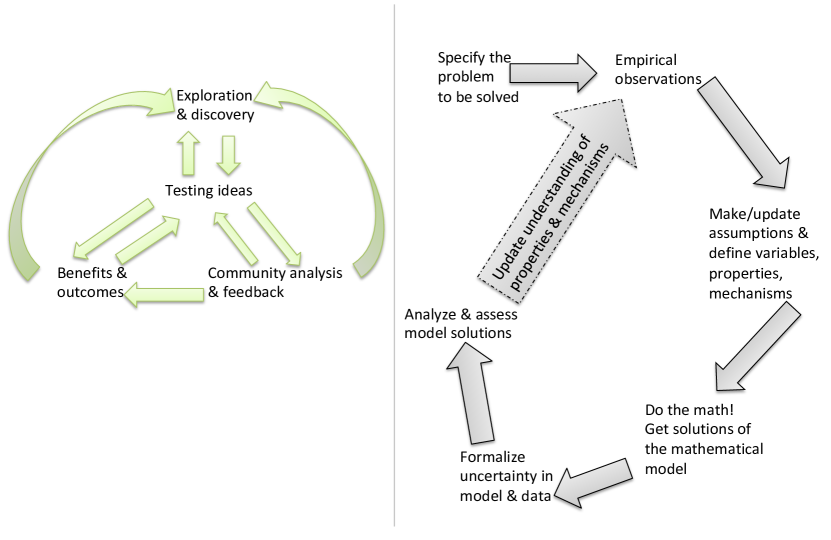
The mathematical modeling process is represented by a schematic in the right panel of Figure 5. Much like the process of science, modeling has various steps that are expected to be iterated repeatedly, as described in [3, 10, 22, 23, 24]. In general, mathematical modeling involves approximations of phenomena in the real-world that enable analysis and predictions to further understanding [10].
We claim that both the process of science and the modeling process resonate well with undergraduate students pursuing majors that relate to the eight occupations discussed in section 3. According to the Society for Industrial and Applied Mathematics [24], most of these students would have had an academic upbringing that included common core state standards promoting applied mathematics and mathematical modeling, namely [6, 23]:
-
1.
Make sense of problems and persevere in solving them.
-
2.
Reason abstractly and quantitatively.
-
3.
Construct viable arguments and critique the reasoning of others.
-
4.
Model with mathematics.
-
5.
Use appropriate tools strategically.
-
6.
Attend to precision.
-
7.
Look for and make use of structure.
-
8.
Look for and express regularity in repeated reasoning.
High-quality STEM education involves an integrated approach [11, 15]. Weaving together science, technology, engineering, and mathematics improves student achievement [4], reflects the integrated nature of STEM professions [28], enables deeper understanding of science [15], and has been observed in successful STEM schools [12]. We discuss next a few efforts implemented in Tennessee, the home state of the authors, within the timeline depicted in Figure 1.
Tennessee adopted a value-added assessment system in 1993, long before other states. In March 2010, using STEM education as a key component of their grant application, Tennessee was awarded Race to the Top Phase 1 funding by the U.S. Department of Education. Then, the Tennessee Department of Education (TDOE), in partnership with the Battelle Memorial Institute, launched the Tennessee STEM Innovation Network (TSIN), committed to developing high-quality STEM curriculum and instruction. Subject to the mantra “Kindergarten to jobs”, TSIN aims to better prepare Tennesseans for the STEM workforce by utilizing regional STEM innovation hubs and STEM designated schools located across the state [25]. Under the direction of the STEM Leadership Council formed in 2014, and in partnership with the TDOE, the Tennessee STEM Strategic Plan was published in 2016 [26]. The plan provides recommendations on full integration of STEM in K-12 education, targeting four priorities to drive the integration of mathematics and science standards with broader STEM-related focuses. In 2017, TDOE and TSIN collaboratively designed the STEM School Designation. Resources were created defining the attributes necessary for a K-12 school to create a comprehensive STEM learning environment. The designation has high standards for integration and collaboration, presenting STEM as integrated, rather than insular disciplines, while preparing students to supply workforce needs in Tennessee. An increasing number of K-12 schools are applying for and receiving this designation, thus reshaping how STEM education is delivered statewide. However, across higher education institutions in Tennessee (and in most of the U.S.), students currently engage in STEM disciplines separately. Their STEM experience is in silos of science, technology, engineering, or mathematics, even though this is very different from how they will experience these fields in the workforce. We claim a mathematical modeling minor, which we propose in the next section, may enact the existing national/state recommendations for integrated teaching/learning of interdisciplinary STEM.
6 Mathematical Modeling Minor
East Tennessee State University (ETSU) offers a Bachelor of Science degree in mathematics with four possible concentrations. Two of them are directly related to mathematical modeling, specifically: Computational Applied Mathematics; and Statistics. Figure 6 illustrates sequences of classes that echo both of these concentrations in the context of a mathematics minor, also offered at ETSU. Each panel in Figure 6 includes seven courses, where those at top are entry-level, followed by four additional classes. Differential Equations and Probability are sophomore-level courses that are pre-requisites of the upper-level classes depicted at the bottom.
We propose a mathematical modeling minor that derives from mixing both sequences displayed in Figure 6. For example, one course sequence is obtained by setting the upper-level coursework to include Statistical Modeling, Mathematical Modeling, and Stochastic Modeling. Thus, providing formal training in the representation of real-world phenomena with the language of mathematics and/or statistics.
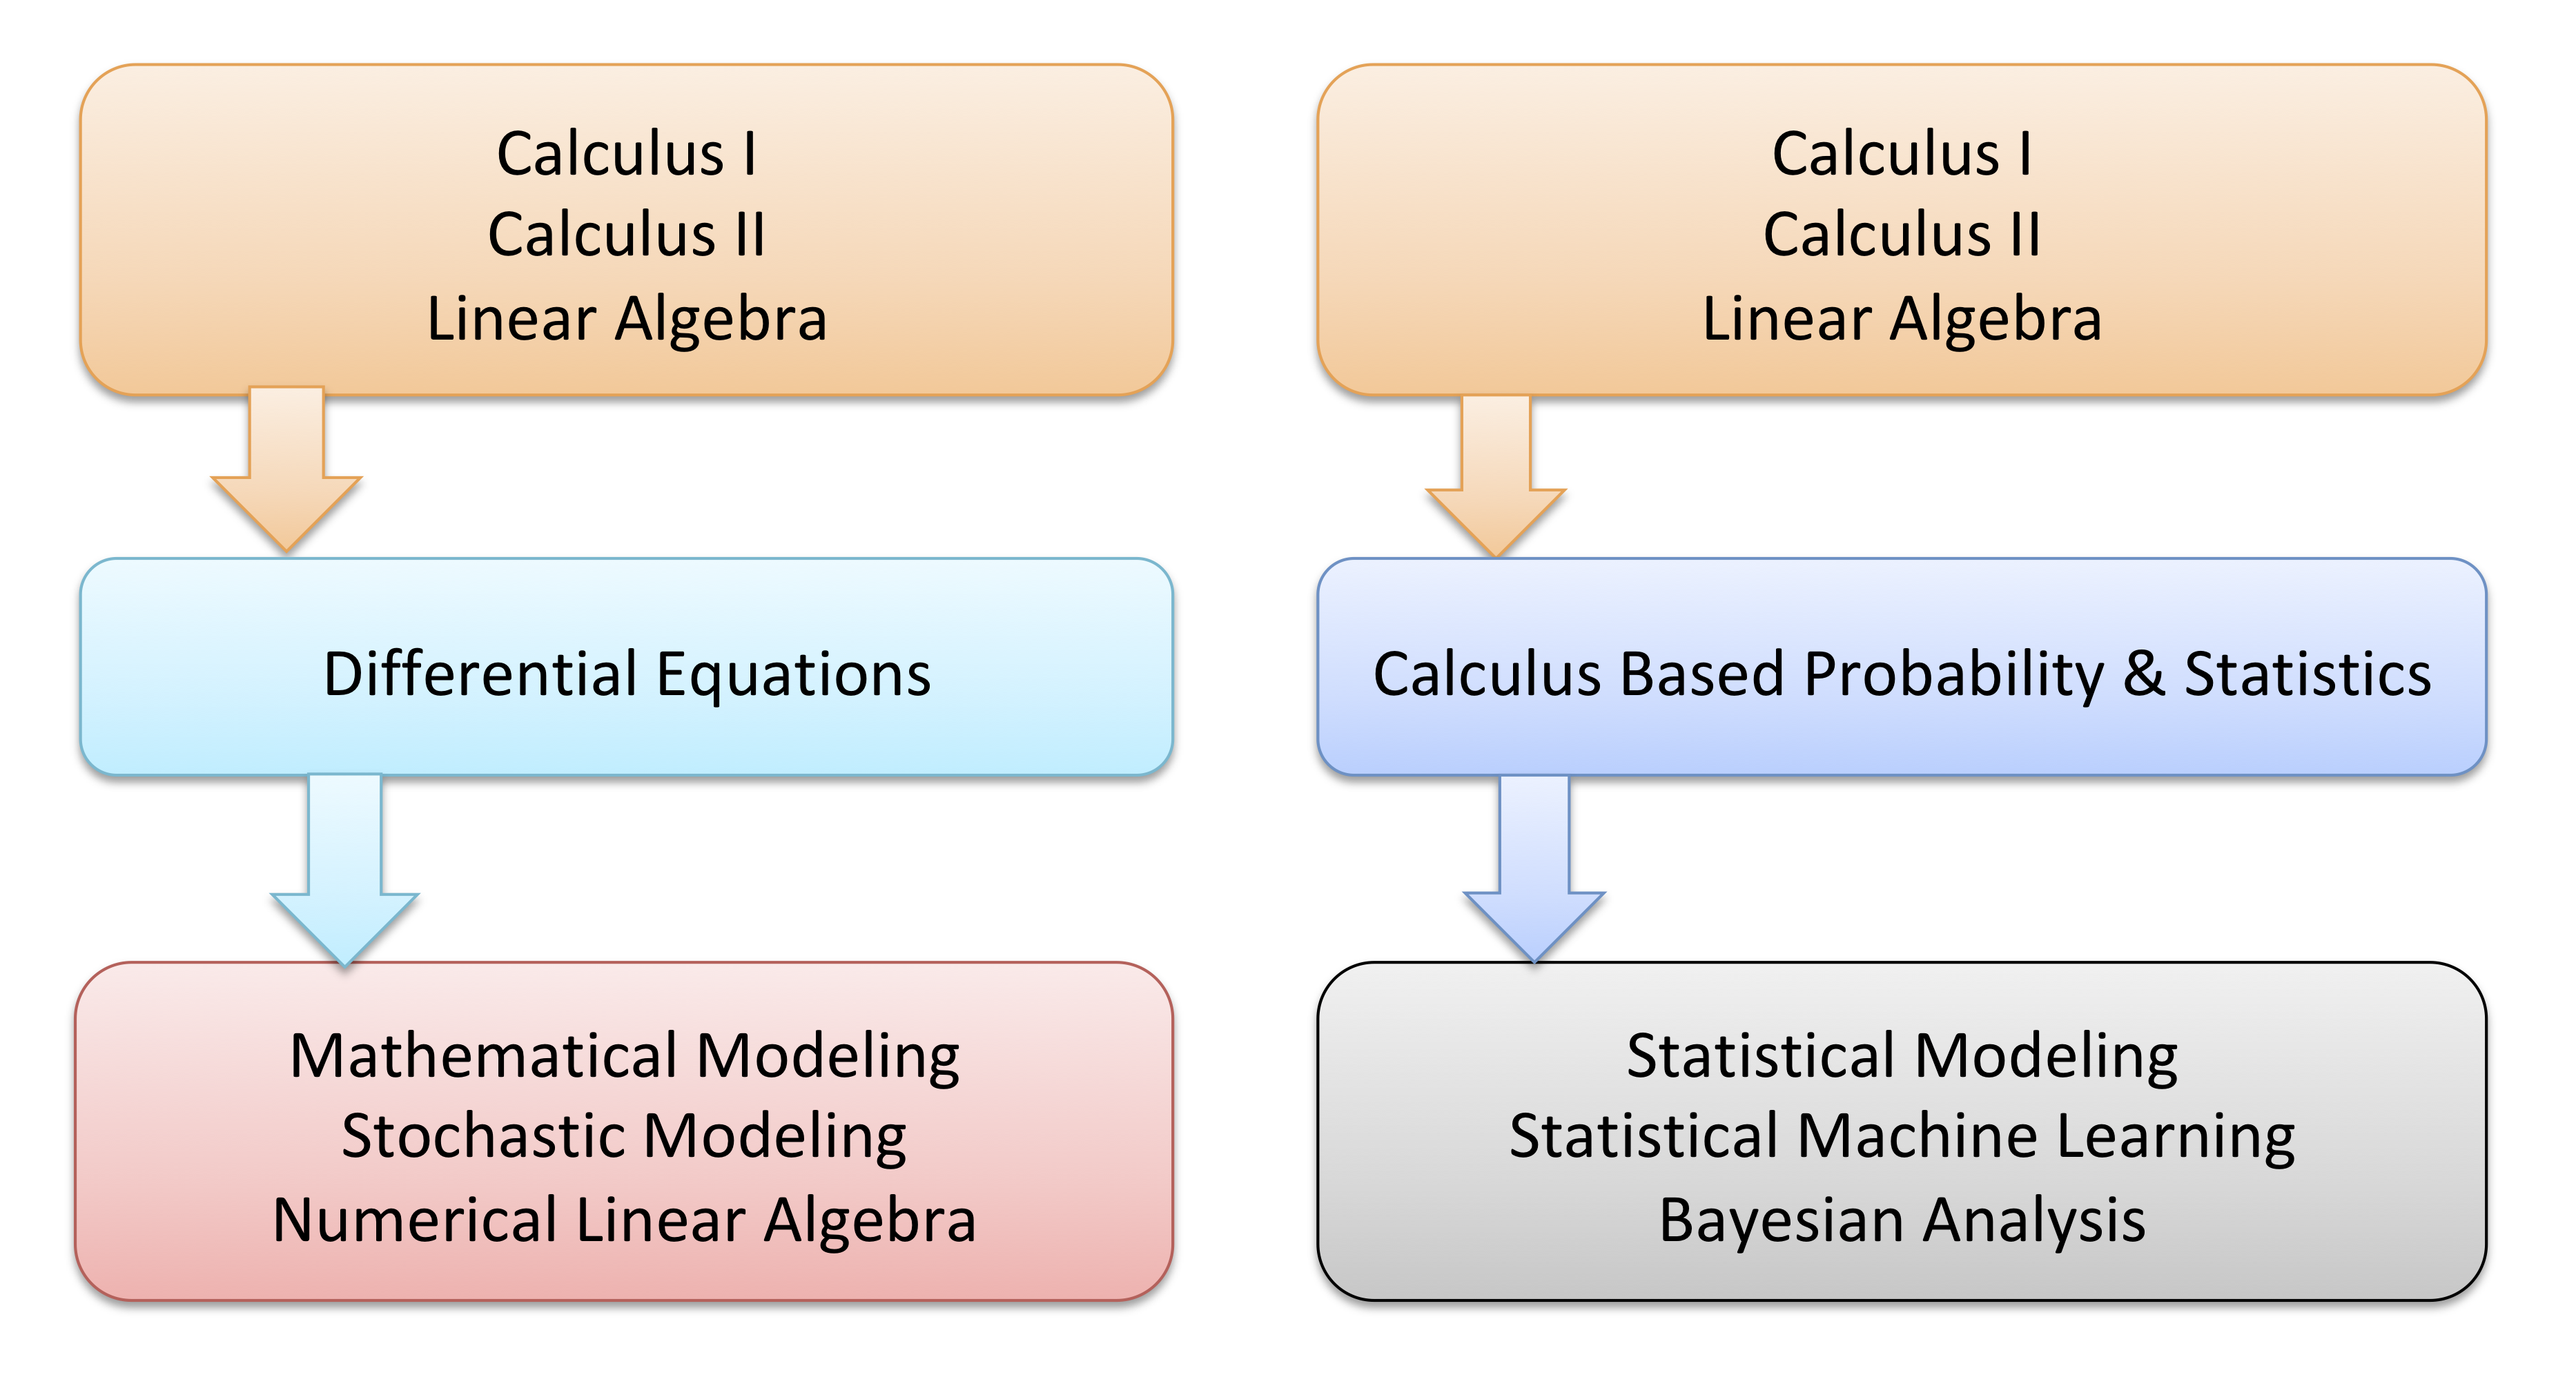
The Society for Industrial and Applied Mathematics (SIAM) Education Committee Report, published in 2014 [24], states curriculum recommendations for a minor that concur with the design we propose here. Furthermore, Calculus I & II, together with Linear Algebra are considered by this committee as required or foundational coursework. Additionally, the report also suggests elective courses to include Numerical Analysis, Modeling, and Operations Research, all of which have analogies with the upper-level classes displayed at the bottom of Figure 6.
An important consideration while designing a minor is to make sure that students can complete the requirements in multiple ways. In certain universities, some courses are only offered once a year or every other year. There should be sufficient options to choose from, so that such scheduling constraints would not interfere with a timely completion of the minor. Generally speaking, a minor in mathematics may require from five to eight courses, which translates to 18–26 credits. Part of the institutional variability comes from standards often dictated by entities that issue accreditation. For example, a class in the Calculus sequence may be worth 3–5 credits, depending on the school and/or its location. At ETSU, a mathematics minor requires seven courses (three of which must be upper-level) adding up to 23 credits, where Calculus I – III are 4 credits each.
The Guidelines for Assessment and Instruction in Mathematical Modeling Education (GAIMME) stipulate: “…Unlike a course on traditional topics in which students may listen to lectures or follow examples to solve a set of problems, students in a mathematical modeling course tackle big, messy, open-ended problems without any textbook examples” [10]. In fact, this principle could be a resonating factor that shifts STEM unengaged students (receiving mathematics instruction that lacks meaningful applications) into individuals who actively engage with components of the modeling process, because they understand how it relates to their career goals [10].
The first column of Table 4 lists career readiness competencies established by the National Association of Colleges and Employers (NACE) [13]. Full descriptions of the NACE competencies are available in the appendix F. Checkmarks in other columns of Table 4 denote congruent transferable (or soft) skills as recommended by the Society for Industrial and Applied Mathematics [24], and the Consortium for Mathematics and its Applications [10], in the second and third columns, respectively. These competencies and transferable skills are all in tune with soft and hard skills identified by the U.S. Department of Labor (see Tables 1–3).
| NACE Career Readiness Competencies | SIAM | GAIMME |
|---|---|---|
| Critical thinking/problem solving | ✓ | ✓ |
| Oral/written communications | ✓ | ✓ |
| Teamwork/collaboration | ✓ | ✓ |
| Digital technology | ||
| Leadership | ||
| Professionalism/work ethic | ||
| Career management | ||
| Global/intercultural fluency | ✓ |
STEM students who are completing a mathematical modeling minor may enjoy added benefits if they participate in undergraduate research. According to [24, 7], undergraduate research is an “…investigation conducted by an undergraduate student that makes an original intellectual or creative contribution to the discipline.” Furthermore, undergraduate research stimulates traits which are compatible with those summarized in Tables 1 and 4, such as: critical thinking; problem solving; intellectual independence; and innovation. There are several federal agencies that provide funding for undergraduate research, here we mention three of them: the U.S Department of Energy [21]; the National Security Agency [17]; and the National Science Foundation [18]. In fact, the latter agency funded a 6-year workforce preparation program (which involved modeling) housed at ETSU and we summarize its accomplishments in the next section.
7 Case Study: Preparation of the Data Driven Mathematical Scientists for the Workforce
A grant from the National Science Foundation to ETSU, under a program in the Division of Undergraduate Education called Scholarships in Science, Technology, Engineering, and Mathematics (S-STEM), has provided substantial funding for modeling immersion by undergraduates.
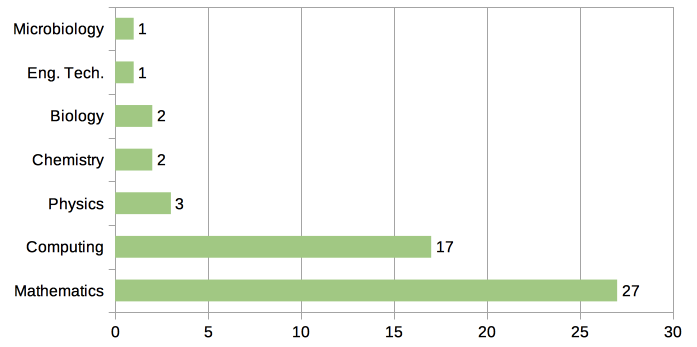
The formal name of this S-STEM program at ETSU is Preparation of the Data Driven Mathematical Scientists for the Workforce, in operation since August 1, 2014 through July 31, 2020. Even though the first goal was to fund as many as 30 students, the gross total of scholars to-date, including students who did not complete the program, equals 58. The distribution of participants by STEM discipline, for 53 out of 58 scholars, is displayed in Figure 7. We had 27 out of 58 (46.55% of the scholars) with a single mathematics major. There were 26 out of 58 (44.83% of participants) with a single non-mathematics STEM major, while 5 students (8.62% of the participants) had a double-major, where mathematics was their common factor. Having less than 10% of scholars with double-majors, albeit from a small sample of S-STEM participants, is evidence that we cannot expect a majority of STEM undergraduates to do so. In other words, capacity building with mathematics double-majors only is not viable.
In Table 7 we summarize some of the hard skills that S-STEM scholars acquired during the program. There is compatibility with the hot technologies mentioned in Table 3. Computing tools, such as, Linux, Python, and R, were first introduced in special topics seminars and were later integrated into some of the ETSU curriculum. Students were introduced to Micro-Array Data Analysis and Predictive Modeling in workshops and tutorials. All other topics in Table 7 were delivered as upper-level 3-credit courses. Modeling was a unifying factor, as noted in the courses Mathematical Modeling, Statistical Modeling, and Stochastic Modeling. Due to the complex task of lining up schedules from different majors, it was not possible for all scholars to take exactly the same sequence of courses. Instead, they would combine coursework from the sequences depicted in Figure 6.
Hard skills developed by S-STEM participants at ETSU. Linux, Python, R Probability & Statistics Micro-Array Data Analysis Mathematical Modeling Statistical Machine Learning Applications of Statistics Numerical Analysis Statistical Modeling Stochastic Modeling Predictive Modeling Numerical Linear Algebra Bayesian Analysis
| Arizona State University |
| Colorado State University |
| East Tennessee State University |
| Eastman Chemical Company |
| Electro-Mechanical Corporation |
| National Security Agency |
| North Carolina State University |
| Oak Ridge National Laboratory |
| OSIsoft LLC Operational Intelligence Data Infrastructure |
| United States Census Bureau |
| University of Connecticut |
| University of Iowa |
Several of the S-STEM scholars were highly motivated to apply for summer programs. Part of the motivation was drawn by direct conversations with guest speakers that visited East Tennessee State University, sponsored by the S-STEM program. Table 5 lists the institutions where scholars obtained paid summer positions either as an internship or as a research experience for undergraduates. We argue that participation in summer programs, outside their home institution for most, did have a positive impact and may have also influenced their graduation rate.
S-STEM graduation rates were computed by using projections: 20 actual graduates between 2014 and 2019, were added to 19 expected graduates by May 2021. Thus, 39 S-STEM participants are expected to graduate out of a total of 58 funded students, implying a gross graduation rate of 67%. On the other hand, the effective graduation rate includes only the number of students that successfully completed the S-STEM program, i.e., 43 instead of 58, giving an effective graduation rate equal to 91%. ETSU’s undergraduate graduation rate oscillates from 20% to 23%[9]. It is measured from the percentage of entering full-time students with plans to get a Bachelor’s degree, and who complete their degree program within four years.
The number of students enrolled in the mathematics minor (in all forms not just restricted to modeling) at ETSU, is subject to strong variability, and it fluctuates from 15 to 33 over Fall 2013 – Spring 2018. The minor completion rate also sustains variability ranging between 30% and 69% per year. During this five-year period the number of completed mathematics minors is 56, including those that were funded by the S-STEM program, versus 41 while excluding the S-STEM participants. Therefore, S-STEM scholarships induced a relative percentage increase of 37%.
S-STEM scholars that did not continue graduate studies upon graduation were successful landing employment, in positions that require skills with an interplay between data, computer simulations, and mathematics and/or statistics. The following are some of their employers in the private sector and federal government:
-
•
Clayton Homes
-
•
Eastman Chemical Company
-
•
National Security Agency
-
•
Riparian LLC
-
•
U.S. Army Materiel Systems Analysis Activity
Having grant funding (award number DUE-1356397) for STEM majors was essential while enhancing enrollment in preliminary versions of a Mathematical Modeling minor at ETSU. It successfully compounded institutional benefits in five areas: recruitment, retention, internships, graduation, and employment. Data driven mathematics were promoted with modeling at the helm, and they inspired the ideas that we humbly convey here. In the next section, we close with some concluding remarks.
8 Conclusion
By Fall 2018 the number undergraduate students in mathematics at ETSU sustained an 18% decline, relative to the previous academic year. This was not a rare event. Instead, it was a trend in size reduction throughout four consecutive years. Between its largest size in Fall 2014 and its lowest level in Fall 2018, the relative percent change in the number of ETSU’s mathematics undergraduates is [8]. Like several undergraduate mathematics programs around the country, ETSU is not at capacity in terms of enrollment. Some of the ideas discussed in this paper may help in boosting enrollment of mathematics majors by recruiting modeling enthusiasts. Moreover, persuading students to complete a Mathematical Modeling minor has exceptional recruitment odds, i.e., 99% across all disciplines and 94% within STEM areas.
We focused on eight STEM occupations, that is: Biologists, Chemists, Physicists, Computer Programmers, Biomedical Engineers, Industrial Engineers, Mathematicians, and Statisticians. More often than not, undergraduate curricula for these careers include Calculus requirements, which could be used as initial conditions for a Mathematical Modeling minor. It is feasible for STEM undergraduates to complete a Calculus I – II sequence within their first year in college. Then, they would have six remaining semesters to fulfill the requirements determined by at least four additional courses. Inclusion of summer sessions can prove extremely useful.
According to the U.S. Department of Labor, three soft skills common to most individuals that are best suited for a Mathematical Modeling minor include: analytical thinking; attention to detail; and integrity. We found great affinity between the NACE competencies [13], the transferable skills in GAIMME [10], the traits mentioned in the SIAM Education Committee Report [24], and the soft skills measured by the U.S. Department of Labor [19].
Hard skills, dubbed as hot technologies [19], are relevant to all areas of STEM because the eight occupations considered here record at least three skills covering databases, object oriented programming, and data analysis. Additionally, it will be important for 21st century STEM modelers to acquire some training in cloud computing as delivered by various tools of Amazon Web Services (AWS). AWS provide distributed computing building blocks, together with a set of primitive abstract technical infrastructure available to individuals, companies, and governments, while deploying virtual clusters of computers (accessible all the time, through the Internet) that emulate most of the attributes of real computers (e.g., hardware central processing units, graphics processing units, local/RAM memory, hard-disk/SSD storage, etc). We encourage the readers to make sure their home institution becomes a member of the AWS Academy [1], which delivers curriculum, hands-on learning experiences, and valuable accredited certificattions.
Envisioning a Mathematical Modeling minor as a tipping point in a dynamic job marketplace, for selected STEM occupations, is not an idea “in a galaxy far, far away”. We argue, for example, that some of the conditions making Appalachian counties economically distressed, at-risk, or transitional are simultaneously contributing factors to also make them cost-effective and prone to innovation. We can think of Virginia’s Technology Corridor, Dulles Technology Corridor, and the Research Triangle Park, as examples of locations displaying the new faces and forms of Silicon Valley in the 21st century, all of which would welcome mathematical modelers. According to data from the U.S. Department of Labor [19], quantitative occupations such as Statisticians, Mathematicians, and Physicists, have a favorable job outlook at the national level. Moreover, at the state level, we find that Statisticians are ranked “number one” in eleven out of thirteen Appalachian states (see appendix E).
We propose the following curriculum for a Mathematical Modeling minor, in compliance with the recommendations made by the SIAM Education Committee Report on Undergraduate Degree Programs in Applied Mathematics [24]. As required courses we suggest: Calculus I; Calculus II; and Linear Algebra. As elective courses we recommend: Probability and Statistics; Differential Equations; Numerical Analysis; Numerical Linear Algebra; Mathematical Modeling; Stochastic Modeling; Statistical Modeling; Statistical Machine Learning; and/or Bayesian Analysis.
The Mathematical Sciences in 2025 [16], a report authored by the National Research Council of the National Academies, promotes substantial innovation for postsecondary mathematics education, while invoking modern practices reflected in content, pathways, and delivery. One of the findings in this report reads as follows: “Mathematical sciences work is becoming an increasingly integral and essential component of a growing array of areas of investigation in biology, medicine, social sciences, business, advanced design, climate, finance, advanced materials, and many more. This work involves the integration of mathematics, statistics, and computation in the broadest sense and the interplay of these areas with areas of potential application. All of these activities are crucial to economic growth, national competitiveness, and national security, and this fact should inform both the nature and scale of funding for the mathematical sciences as a whole. Education in the mathematical sciences should also reflect this new stature of the field.”
Acknowledgments
We dedicate this article to the memory of Professor D.C. Smith.
References
-
[1]
Amazon Web Services, AWS Academy,
https://aws.amazon.com/training/awsacademy/ (24 July 2019). - [2] Appalachian Regional Commission, https://www.arc.gov (1 July 2019).
- [3] H.T. Banks and H.T. Tran, Mathematical and Experimental Modeling of Physical and Biological Processes, 1st ed., CRC Press, Boca Raton, FL, 2009, https://doi.org/10.1201/b17175.
- [4] K. Becker and K. Park, Effects of integrative approaches among science, technology, engineering, and mathematics (STEM) subjects on students’ learning: A preliminary meta-analysis, Journal of STEM Education, 12 (2011), pp. 23–37.
- [5] Bureau of Labor Statistics, United States Department of Labor, https://www.bls.gov (24 June 2019).
- [6] Common Core State Standards Initiative, http://www.corestandards.org (19 July 2019).
- [7] Council on Undergraduate Research, https://www.cur.org (21 July 2019).
- [8] Fact Books, East Tennessee State University, Office of Institutional Research, https://www.etsu.edu/academicaffairs/pds/ir/etsu_facts/fact_books.php (24 July 2019).
- [9] Find your College, Integrated Postsecondary Education Data System, https://nces.ed.gov/ipeds/find-your-college (22 July 2019).
- [10] GAIMME: Guidelines for Assessment and Instruction in Mathematical Modeling Education, Second Edition, S. Garfunkel and M. Montgomery, editors, Consortium For Mathematics And Its Applications (COMAP) and Society for Industrial and Applied Mathematics (SIAM), Philadelphia, 2019. https://www.siam.org/Publications/Reports. Accessed 30 June 2019.
- [11] C. Johnson, Conceptualizing integrated STEM education, Sch. Sci. Math., 113 (2013) , pp. 367–368, https://doi.org/10.1111/ssm.12043.
- [12] M. LaForce, E. Noble, H. King, J. Century, C. Blackwell, S. Holt, A. Ibrahim, and S. Loo, The eight essential elements of inclusive STEM high schools, Int. J. STEM Educ., 3 (2016), pp. 1–11, https://doi.org/10.1186/s40594-016-0054-z.
- [13] National Association of Colleges and Employers, Career Readiness Competencies, https://www.naceweb.org (20 July 2019).
- [14] National Center for Education Statistics, United States Department of Education, Bachelor’s degrees conferred by postsecondary institutions, by field of study: Selected years, 1970-71 through 2015-16, https://nces.ed.gov/programs/digest/d17/tables/dt17_322.10.asp. (3 July 2019).
- [15] National Research Council, Learning and Understanding: Improving Advanced Study of Mathematics and Science in U.S. High Schools, The National Academies Press, Washington, DC, 2002. https://doi.org/10.17226/10129. Accessed 30 June 2019.
- [16] National Research Council, The Mathematical Sciences in 2025, The National Academies Press, Washington, DC, 2013. https://doi.org/10.17226/15269 . Accessed 19 July 2019.
- [17] National Security Agency, NSA Student Programs, https://www.intelligencecareers.gov/nsa/nsastudents.html (21 July 2019).
- [18] National Science Foundation, Research Experience for Undergraduates, https://www.nsf.gov/crssprgm/reu/reu_search.jsp, (21 July 2019).
- [19] O*NET Database of Occupational Information, United States Department of Labor, https://www.onetonline.org (23 June 2019).
- [20] A.S. Perelson, A.U. Neumann, M. Markowitz, J.M. Leonard, and David D. Ho, HIV-1 Dynamics in vivo: virion clearance rate, infected cell life-span, and viral generation time, Science, 271 (1996), pp. 1582–1586, https://doi.org/10.1126/science.271.5255.1582.
- [21] Science Undergraduate Laboratory Internship, U.S. Department of Energy, https://science.osti.gov/wdts/suli (21 July 2019).
- [22] Society for Industrial and Applied Mathematics, Modeling Across the Curriculum. Report on a SIAM-NSF Workshop, August 30–31, 2012, Philadelphia, PA, 2012. https://www.siam.org/Publications/Reports. Accessed 30 June 2019.
- [23] Society for Industrial and Applied Mathematics, Modeling Across the Curriculum II. Report on the second SIAM-NSF Workshop, January 12–14, 2014, Philadelphia, PA, 2014. https://www.siam.org/Publications/Reports. Accessed 30 June 2019.
- [24] Society for Industrial and Applied Mathematics, SIAM Education Committee Report on Undergraduate Degree Programs in Applied Mathematics, Philadelphia, PA, 2014. https://www.siam.org/Publications/Reports. Accessed 30 June 2019.
- [25] Tennessee STEM Innovation Network, https://www.tsin.org (19 July 2019).
- [26] Tennessee STEM Strategic Plan, Tennessee Department of Education, https://www.tn.gov/education.html (21 July 2019).
- [27] Understanding Science, University of California Museum of Paleontology, https://undsci.berkeley.edu (1 July 2019).
- [28] H. Wang, T.J. Moore, G.H. Roehrig, and M.S. Park, STEM Integration: teacher perceptions and practice, Journal of Pre-College Engineering Education Research, 1 (2011), pp. 1–13, https://doi.org/10.5703/1288284314636.
Appendix A Standard Occupational Classification
| Occupation | Code |
|---|---|
| Biological Scientists | 19-1029 |
| Biomedical Engineers | 17-2031 |
| Chemists | 19-2031 |
| Computer Programmers | 15-1131 |
| Industrial Engineers | 17-2112 |
| Mathematicians | 15-2021 |
| Physicists | 19-2012 |
| Statisticians | 15-2041 |
(The rest of this page is left blank intentionally.)
Appendix B Soft Skills in STEM Occupations
| Soft Skill | Description |
|---|---|
| Achievement/effort | Job requires establishing and maintaining personally challenging achievement goals and exerting effort toward mastering tasks. |
| Adaptability/flexibility | Job requires being open to change (positive or negative) and to considerable variety in the workplace. |
| Analytical thinking | Job requires analyzing information and using logic to address work-related issues and problems. |
| Attention to detail | Job requires being careful about detail and thorough in completing work tasks. |
| Concern for others | Job requires being sensitive to others’ needs and feelings and being understanding and helpful on the job. |
| Cooperation | Job requires being pleasant with others on the job and displaying a good-natured, cooperative attitude. |
| Dependability | Job requires being reliable, responsible, and dependable, and fulfilling obligations. |
| Independence | Job requires developing one’s own ways of doing things, guiding oneself with little or no supervision, and depending on oneself to get things done. |
|---|---|
| Initiative | Job requires a willingness to take on responsibilities and challenges. |
| Innovation | Job requires creativity and alternative thinking to develop new ideas for and answers to work-related problems. |
| Integrity | Job requires being honest and ethical. |
| Leadership | Job requires a willingness to lead, take charge, and offer opinions and direction. |
| Persistence | Job requires persistence in the face of obstacles. |
| Self control | Job requires maintaining composure, keeping emotions in check, controlling anger, and avoiding aggressive behavior, even in very difficult situations. |
| Social orientation | Job requires preferring to work with others rather than alone, and being personally connected with others on the job. |
| Stress tolerance | Job requires accepting criticism and dealing calmly and effectively with high stress situations. |
Appendix C STEM Careers Formal Training and Wages
| STEM | Some | Associate’s | Bachelor’s | Post-baccalaureate | Master’s | Doctoral | Post-doctoral |
|---|---|---|---|---|---|---|---|
| Occupation | College | Degree | Degree | Certificate | Degree | Degree | Training |
| Physicists | ✓ | ✓ | ✓ | ||||
| Mathematicians | ✓ | ✓ | ✓ | ||||
| Biomedical Engineers | ✓ | ✓ | ✓ | ||||
| Statisticians | ✓ | ✓ | ✓ | ||||
| Biologists | ✓ | ✓ | ✓ | ||||
| Chemists | ✓ | ✓ | ✓ | ||||
| Industrial Engineers | ✓ | ✓ | ✓ | ||||
| Computer Programmers | ✓ | ✓ | ✓ |
| STEM Occupation | 25th | 50th | 75th |
|---|---|---|---|
| Physicists | $85,090 | $120,950 | $158,350 |
| Mathematicians | $73,490 | $101,900 | $126,070 |
| Biomedical Engineers | $67,540 | $88,040 | $112,990 |
| Industrial Engineers | $68,550 | $85,880 | $106,970 |
| Computer Programmers | $64,410 | $84,280 | $109,120 |
| Statisticians | $64,230 | $84,060 | $108,500 |
| Chemists | $56,290 | $76,890 | $103,820 |
| Biological Scientists | $57,120 | $76,690 | $94,040 |
Appendix D Appalachian Counties Economic Status
Appendix E STEM Employment Trends for Appalachian States
| STEM | Employment | Employment Relative | Projected Annual |
| Occupation | from 2016 to 2026 | Percent Change | Job Openings |
| United States | |||
| Statisticians | 37200 to 49800 | 34% | 4400 |
| Mathematicians | 3100 to 4000 | 30% | 300 |
| Physicists | 17900 to 20500 | 15% | 1700 |
| Industrial Engineers | 257900 to 283000 | 10% | 19700 |
| Biological Scientists | 38700 to 41800 | 8% | 3700 |
| Biomedical Engineers | 21300 to 22800 | 7% | 1600 |
| Chemists | 88300 to 94000 | 7% | 8600 |
| Computer Programmers | 294900 to 273600 | 15500 | |
| Alabama | |||
| Industrial Engineers | 4850 to 63107 | 30% | 500 |
| Statisticians | 210 to 270 | 28% | 20 |
| Physicists | 230 to 260 | 5% | 20 |
| Biological Scientists | 220 to 230 | 5% | 20 |
| Chemists | 680 to 670 | 60 | |
| Computer Programmers | 6790 to 6300 | 360 | |
| Mathematicians | N/A | N/A | N/A |
| Biomedical Engineers | N/A | N/A | N/A |
| STEM | Employment | Employment Relative | Projected Annual |
| Occupation | from 2016 to 2026 | Percent Change | Job Openings |
| United States | |||
| Statisticians | 37200 to 49800 | 34% | 4400 |
| Mathematicians | 3100 to 4000 | 30% | 300 |
| Physicists | 17900 to 20500 | 15% | 1700 |
| Industrial Engineers | 257900 to 283000 | 10% | 19700 |
| Biological Scientists | 38700 to 41800 | 8% | 3700 |
| Biomedical Engineers | 21300 to 22800 | 7% | 1600 |
| Chemists | 88300 to 94000 | 7% | 8600 |
| Computer Programmers | 294900 to 273600 | 15500 | |
| Georgia | |||
| Statisticians | 740 to 1020 | 39% | 90 |
| Industrial Engineers | 6120 to 7470 | 22% | 570 |
| Physicists | 100 to 120 | 15% | 10 |
| Biomedical Engineers | 330 to 380 | 13% | 30 |
| Chemists | 1280 to 1410 | 10% | 130 |
| Biological Scientists | 890 to 970 | 9% | 90 |
| Computer Programmers | 8460 to 7700 | 430 | |
| Mathematicians | N/A | N/A | N/A |
| STEM | Employment | Employment Relative | Projected Annual |
| Occupation | from 2016 to 2026 | Percent Change | Job Openings |
| United States | |||
| Statisticians | 37200 to 49800 | 34% | 4400 |
| Mathematicians | 3100 to 4000 | 30% | 300 |
| Physicists | 17900 to 20500 | 15% | 1700 |
| Industrial Engineers | 257900 to 283000 | 10% | 19700 |
| Biological Scientists | 38700 to 41800 | 8% | 3700 |
| Biomedical Engineers | 21300 to 22800 | 7% | 1600 |
| Chemists | 88300 to 94000 | 7% | 8600 |
| Computer Programmers | 294900 to 273600 | 15500 | |
| Kentucky | |||
| Statisticians | 90 to 130 | 36% | 10 |
| Industrial Engineers | 4590 to 5100 | 11% | 360 |
| Biomedical Engineers | 70 to 80 | 10% | 10 |
| Biological Scientists | 270 to 280 | 6% | 30 |
| Chemists | 940 to 960 | 3% | 90 |
| Computer Programmers | 1360 to 1240 | 70 | |
| Mathematicians | N/A | N/A | N/A |
| Physicists | N/A | N/A | N/A |
| STEM | Employment | Employment Relative | Projected Annual |
| Occupation | from 2016 to 2026 | Percent Change | Job Openings |
| United States | |||
| Statisticians | 37200 to 49800 | 34% | 4400 |
| Mathematicians | 3100 to 4000 | 30% | 300 |
| Physicists | 17900 to 20500 | 15% | 1700 |
| Industrial Engineers | 257900 to 283000 | 10% | 19700 |
| Biological Scientists | 38700 to 41800 | 8% | 3700 |
| Biomedical Engineers | 21300 to 22800 | 7% | 1600 |
| Chemists | 88300 to 94000 | 7% | 8600 |
| Computer Programmers | 294900 to 273600 | 15500 | |
| Maryland | |||
| Computer Programmers | 5960 to 6430 | 8% | 400 |
| Biomedical Engineers | 670 to 700 | 5% | 50 |
| Mathematicians | 350 to 360 | 5% | 30 |
| Industrial Engineers | 2680 to 2780 | 4% | 180 |
| Statisticians | 3130 to 3210 | 3% | 230 |
| Physicists | 1150 to 1180 | 3% | 90 |
| Biological Scientists | 3450 to 3520 | 2% | 300 |
| Chemists | 3070 to 3140 | 2% | 280 |
| STEM | Employment | Employment Relative | Projected Annual |
| Occupation | from 2016 to 2026 | Percent Change | Job Openings |
| United States | |||
| Statisticians | 37200 to 49800 | 34% | 4400 |
| Mathematicians | 3100 to 4000 | 30% | 300 |
| Physicists | 17900 to 20500 | 15% | 1700 |
| Industrial Engineers | 257900 to 283000 | 10% | 19700 |
| Biological Scientists | 38700 to 41800 | 8% | 3700 |
| Biomedical Engineers | 21300 to 22800 | 7% | 1600 |
| Chemists | 88300 to 94000 | 7% | 8600 |
| Computer Programmers | 294900 to 273600 | 15500 | |
| Mississippi | |||
| Statisticians | 50 to 70 | 31% | 10 |
| Industrial Engineers | 1870 to 2220 | 19% | 160 |
| Biological Scientists | 300 to 300 | 1% | 30 |
| Computer Programmers | 870 to 770 | 40 | |
| Biomedical Engineers | N/A | N/A | N/A |
| Chemists | N/A | N/A | N/A |
| Mathematicians | N/A | N/A | N/A |
| Physicists | N/A | N/A | N/A |
| STEM | Employment | Employment Relative | Projected Annual |
| Occupation | from 2016 to 2026 | Percent Change | Job Openings |
| United States | |||
| Statisticians | 37200 to 49800 | 34% | 4400 |
| Mathematicians | 3100 to 4000 | 30% | 300 |
| Physicists | 17900 to 20500 | 15% | 1700 |
| Industrial Engineers | 257900 to 283000 | 10% | 19700 |
| Biological Scientists | 38700 to 41800 | 8% | 3700 |
| Biomedical Engineers | 21300 to 22800 | 7% | 1600 |
| Chemists | 88300 to 94000 | 7% | 8600 |
| Computer Programmers | 294900 to 273600 | 15500 | |
| New York | |||
| Statisticians | 1240 to 1660 | 34% | 150 |
| Physicists | 1320 to 1610 | 23% | 140 |
| Industrial Engineers | 10380 to 11800 | 14% | 850 |
| Chemists | 4300 to 4830 | 13% | 460 |
| Biological Scientists | 750 to 840 | 13% | 80 |
| Biomedical Engineers | 910 to 1030 | 13% | 80 |
| Computer Programmers | 20020 to 18910 | 1100 | |
| Mathematicians | N/A | N/A | N/A |
| STEM | Employment | Employment Relative | Projected Annual |
| Occupation | from 2016 to 2026 | Percent Change | Job Openings |
| United States | |||
| Statisticians | 37200 to 49800 | 34% | 4400 |
| Mathematicians | 3100 to 4000 | 30% | 300 |
| Physicists | 17900 to 20500 | 15% | 1700 |
| Industrial Engineers | 257900 to 283000 | 10% | 19700 |
| Biological Scientists | 38700 to 41800 | 8% | 3700 |
| Biomedical Engineers | 21300 to 22800 | 7% | 1600 |
| Chemists | 88300 to 94000 | 7% | 8600 |
| Computer Programmers | 294900 to 273600 | 15500 | |
| North Carolina | |||
| Statisticians | 1190 to 1690 | 42% | 160 |
| Physicists | 390 to 460 | 17% | 40 |
| Industrial Engineers | 8380 to 9550 | 14% | 690 |
| Chemists | 3750 to 4290 | 14% | 410 |
| Biomedical Engineers | 380 to 430 | 13% | 30 |
| Biological Scientists | 900 to 990 | 10% | 90 |
| Computer Programmers | 7400 to 7240 | 440 | |
| Mathematicians | N/A | N/A | N/A |
| STEM | Employment | Employment Relative | Projected Annual |
| Occupation | from 2016 to 2026 | Percent Change | Job Openings |
| United States | |||
| Statisticians | 37200 to 49800 | 34% | 4400 |
| Mathematicians | 3100 to 4000 | 30% | 300 |
| Physicists | 17900 to 20500 | 15% | 1700 |
| Industrial Engineers | 257900 to 283000 | 10% | 19700 |
| Biological Scientists | 38700 to 41800 | 8% | 3700 |
| Biomedical Engineers | 21300 to 22800 | 7% | 1600 |
| Chemists | 88300 to 94000 | 7% | 8600 |
| Computer Programmers | 294900 to 273600 | 15500 | |
| Ohio | |||
| Statisticians | 710 to 960 | 35% | 90 |
| Mathematicians | 40 to 50 | 26% | N/A |
| Physicists | 510 to 590 | 16% | 50 |
| Industrial Engineers | 14740 to 16010 | 9% | 1100 |
| Biomedical Engineers | 680 to 740 | 9% | 50 |
| Chemists | 4120 to 4330 | 5% | 390 |
| Computer Programmers | 5850 to 4890 | 240 | |
| Biological Scientists | N/A | N/A | N/A |
| STEM | Employment | Employment Relative | Projected Annual |
| Occupation | from 2016 to 2026 | Percent Change | Job Openings |
| United States | |||
| Statisticians | 37200 to 49800 | 34% | 4400 |
| Mathematicians | 3100 to 4000 | 30% | 300 |
| Physicists | 17900 to 20500 | 15% | 1700 |
| Industrial Engineers | 257900 to 283000 | 10% | 19700 |
| Biological Scientists | 38700 to 41800 | 8% | 3700 |
| Biomedical Engineers | 21300 to 22800 | 7% | 1600 |
| Chemists | 88300 to 94000 | 7% | 8600 |
| Computer Programmers | 294900 to 273600 | 15500 | |
| Pennsylvania | |||
| Statisticians | 2720 to 3620 | 33% | 320 |
| Mathematicians | 80 to 100 | 30% | 10 |
| Industrial Engineers | 9380 to 10350 | 10% | 720 |
| Biomedical Engineers | 1020 to 1090 | 7% | 80 |
| Physicists | 290 to 310 | 7% | 30 |
| Biological Scientists | 860 to 910 | 6% | 80 |
| Chemists | 5420 to 5600 | 3% | 500 |
| Computer Programmers | 13910 to 12730 | 710 | |
| STEM | Employment | Employment Relative | Projected Annual |
| Occupation | from 2016 to 2026 | Percent Change | Job Openings |
| United States | |||
| Statisticians | 37200 to 49800 | 34% | 4400 |
| Mathematicians | 3100 to 4000 | 30% | 300 |
| Physicists | 17900 to 20500 | 15% | 1700 |
| Industrial Engineers | 257900 to 283000 | 10% | 19700 |
| Biological Scientists | 38700 to 41800 | 8% | 3700 |
| Biomedical Engineers | 21300 to 22800 | 7% | 1600 |
| Chemists | 88300 to 94000 | 7% | 8600 |
| Computer Programmers | 294900 to 273600 | 15500 | |
| South Carolina | |||
| Statisticians | 410 to 570 | 38% | 50 |
| Industrial Engineers | 6900 to 8580 | 24% | 660 |
| Biomedical Engineers | 70 to 80 | 11% | 10 |
| Physicists | 190 to 210 | 8% | 20 |
| Chemists | 1140 to 1220 | 7% | 110 |
| Biological Scientists | 210 to 230 | 7% | 20 |
| Computer Programmers | 3630 to 3410 | 200 | |
| Mathematicians | N/A | N/A | N/A |
| STEM | Employment | Employment Relative | Projected Annual |
| Occupation | from 2016 to 2026 | Percent Change | Job Openings |
| United States | |||
| Statisticians | 37200 to 49800 | 34% | 4400 |
| Mathematicians | 3100 to 4000 | 30% | 300 |
| Physicists | 17900 to 20500 | 15% | 1700 |
| Industrial Engineers | 257900 to 283000 | 10% | 19700 |
| Biological Scientists | 38700 to 41800 | 8% | 3700 |
| Biomedical Engineers | 21300 to 22800 | 7% | 1600 |
| Chemists | 88300 to 94000 | 7% | 8600 |
| Computer Programmers | 294900 to 273600 | 15500 | |
| Tennessee | |||
| Statisticians | 620 to 840 | 36% | 80 |
| Industrial Engineers | 6670 to 8190 | 23% | 620 |
| Physicists | 240 to 280 | 20% | 30 |
| Biomedical Engineers | 300 to 330 | 11% | 20 |
| Computer Programmers | 4430 to 4890 | 10% | 340 |
| Chemists | 1150 to 1250 | 9% | 120 |
| Biological Scientists | 320 to 350 | 8% | 30 |
| Mathematicians | N/A | N/A | N/A |
| STEM | Employment | Employment Relative | Projected Annual |
| Occupation | from 2016 to 2026 | Percent Change | Job Openings |
| United States | |||
| Statisticians | 37200 to 49800 | 34% | 4400 |
| Mathematicians | 3100 to 4000 | 30% | 300 |
| Physicists | 17900 to 20500 | 15% | 1700 |
| Industrial Engineers | 257900 to 283000 | 10% | 19700 |
| Biological Scientists | 38700 to 41800 | 8% | 3700 |
| Biomedical Engineers | 21300 to 22800 | 7% | 1600 |
| Chemists | 88300 to 94000 | 7% | 8600 |
| Computer Programmers | 294900 to 273600 | 15500 | |
| Virginia | |||
| Statisticians | 1180 to 1700 | 43% | 160 |
| Mathematicians | 500 to 670 | 34% | 60 |
| Physicists | 880 to 1000 | 14% | 80 |
| Biomedical Engineers | 230 to 260 | 13% | 20 |
| Biological Scientists | 620 to 690 | 12% | 60 |
| Industrial Engineers | 3640 to 3970 | 9% | 280 |
| Chemists | 1570 to 1630 | 4% | 150 |
| Computer Programmers | 9370 to 8770 | 500 | |
| STEM | Employment | Employment Relative | Projected Annual |
| Occupation | from 2016 to 2026 | Percent Change | Job Openings |
| United States | |||
| Statisticians | 37200 to 49800 | 34% | 4400 |
| Mathematicians | 3100 to 4000 | 30% | 300 |
| Physicists | 17900 to 20500 | 15% | 1700 |
| Industrial Engineers | 257900 to 283000 | 10% | 19700 |
| Biological Scientists | 38700 to 41800 | 8% | 3700 |
| Biomedical Engineers | 21300 to 22800 | 7% | 1600 |
| Chemists | 88300 to 94000 | 7% | 8600 |
| Computer Programmers | 294900 to 273600 | 15500 | |
| West Virginia | |||
| Statisticians | 120 to 150 | 31% | 10 |
| Industrial Engineers | 500 to 560 | 12% | 40 |
| Chemists | 880 to 940 | 7% | 90 |
| Biological Scientists | 200 to 210 | 5% | 20 |
| Computer Programmers | 730 to 660 | 40 | |
| Biomedical Engineers | N/A | N/A | N/A |
| Mathematicians | N/A | N/A | N/A |
| Physicists | N/A | N/A | N/A |
Appendix F Career Readiness
NACE, the National Association of Colleges and Employers, defines career readiness as the attainment and demonstration of requisite competencies that broadly prepare college graduates for a successful transition into the workplace. There are eight career readiness competencies [13]:
-
1.
Critical Thinking/Problem Solving: Exercise sound reasoning to analyze issues, make decisions, and overcome problems. The individual is able to obtain, interpret, and use knowledge, facts, and data in this process, and may demonstrate originality and inventiveness.
-
2.
Oral/Written Communications: Articulate thoughts and ideas clearly and effectively in written and oral forms to persons inside and outside of the organization. The individual has public speaking skills; is able to express ideas to others; and can write/edit memos, letters, and complex technical reports clearly and effectively.
-
3.
Teamwork/Collaboration: Build collaborative relationships with colleagues and customers representing diverse cultures, races, ages, genders, religions, lifestyles, and viewpoints. The individual is able to work within a team structure, and can negotiate and manage conflict.
-
4.
Digital Technology: Leverage existing digital technologies ethically and efficiently to solve problems, complete tasks, and accomplish goals. The individual demonstrates effective adaptability to new and emerging technologies.
-
5.
Leadership: Leverage the strengths of others to achieve common goals, and use interpersonal skills to coach and develop others. The individual is able to assess and manage his/her emotions and those of others; use empathetic skills to guide and motivate; and organize, prioritize, and delegate work.
-
6.
Professionalism/Work Ethic: Demonstrate personal accountability and effective work habits, e.g., punctuality, working productively with others, and time workload management, and understand the impact of non-verbal communication on professional work image. The individual demonstrates integrity and ethical behavior, acts responsibly with the interests of the larger community in mind, and is able to learn from his/her mistakes.
-
7.
Career Management: Identify and articulate one’s skills, strengths, knowledge, and experiences relevant to the position desired and career goals, and identify areas necessary for professional growth. The individual is able to navigate and explore job options, understands and can take the steps necessary to pursue opportunities, and understands how to self-advocate for opportunities in the workplace.
-
8.
Global/Intercultural Fluency: Value, respect, and learn from diverse cultures, races, ages, genders, sexual orientations, and religions. The individual demonstrates openness, inclusiveness, sensitivity, and the ability to interact respectfully with all people and understand individuals’ differences.