The physics of Erythrocyte Sedimentation Rate
Abstract
An erythrocytes sedimentation rate (ESR) measures how fast a blood sample sediments along a test tube in one hour in a clinical laboratory. Since elevated level of ESR is associated with inflammatory diseases, ESR is one of the routine hematology test in a clinical laboratory. In this paper, the physics of erythrocyte (RBC) sedimentation rate as well as the dynamics of the RBC is explored by modeling the dynamics of the cells as the motion of Brownian particle moving in a viscous medium. The viscous friction of blood is considered to decrease as the temperature of the medium increases aa1 . The results obtained in this work show that the ESR increases as the number of red blood cells (that bind together in the sedimentation process) steps up. The room temperature also affects the sedimentation rate. As the room temperature rises up, the ESR steps up. Furthermore the dynamics of the RBC along a Westergren pipet that is held in an upright position is explored. The exact analytic result depicts that the velocity of cells increases as the number of cells that form rouleaux steps up. Since our study is performed by considering real physical parameters, the results obtained in this work non only agree with the experimental observations but also helps to understand most hematological experiments that are conducted in vitro.
pacs:
Valid PACS appear hereI Introduction
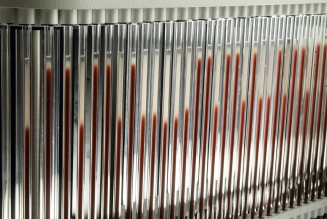
An erythrocyte (red blood cell) sedimentation rate measures how fast a blood sample sediments along a test tube in one hour in a clinical laboratory as shown in Fig. 1. This common hematology test is performed by mixing the whole blood with anticoagulant aa2 ; aa3 ; aa4 . The blood is then placed in an upright Wintrobe or Westergren tube. The sedimentation rate of the red blood cells (ESR) is measured in millimeters (mm) at the end of one hour. The normal ESR varies from 0-3mm/hr for men and 0-7 mm/hr for women aa2 ; aa3 ; aa4 . High ESR is associated with diseases that cause inflammation. Thus the ESR lab test helps to diagnose certain medical problems.
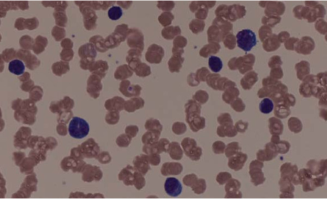
One can ask why the ESR is higher in case of inflammatory diseases. This question can be answered by considering all the forces acting on the red blood cells (RBCs). Consider a blood sample that is placed in an upright Wintrobe or Westergren tube. The red blood cells in the blood sample are negatively charged and they tend to repel each other. Since the mass of a single RBC is too small, its gravitational force is too small to overcome the viscous friction force of the blood. As a result, the RBCs remain in the blood sample without being precipitated. In case of an inflammatory disease, the blood level of fibrinogen becomes too high aa4 ; aa6 . The presence of fibrinogen forces the RBCs to stick each other and as a result they form aggregates of RBC called rouleaux as depicted in Fig. 2. As the mass of the rouleaux increases, the weight of the rouleaux dominates the vicious friction and as a result, the RBCs start to precipitate.
Elevated erythrocyte sedimentation rate is not only due to high level of fibrinogen and gamma globulins but also can be caused by inclination of the test tube. The temperature of the laboratory (blood sample) also significantly affects the test result. As the temperature of the sample steps up, the ESR increases. False negative results are also observed due the abnormally shaped RBC, low room temperature and use of excessive anticoagulant during blood sampling.
In this paper we study the ESR and the dynamic of red blood cells analytically. Since RBC is microscopic in size, its dynamics can be model as a Brownian particle walking in a viscous medium. As blood is a highly viscous medium, the chance for the RBC to accelerate is negligible. One can then neglect the inertia effect and the corresponding dynamics can be studied via Langevin equation or Fokker Planck equation aa7 ; aa8 ; aa9 ; aa10 ; aa11 . Solving the Fokker Planck equation analytically, we explore how the sedimentation rate behaves as a function of the model parameters. The exact analytic results indicate that the ESR increases as the red blood cells form aggregates. Particularly the result obtained in this work exposes the rate of sedimentation as a function of the number of red blood cells that bind together in the sedimentation process. Since our study is performed by considering real physical parameters, the results obtained in this work non only agree with the experimental observations but also helps to understand most hematological experiments that are conducted in vitro.
The room temperature also considerably affects the outcome of the ESR. Various experimental studies showed that the viscosity of the fluids tends to decrease as the temperature of the medium increases aa1 ; aa8 . This is because increasing the temperature steps up the speed of the molecules and this in turn creates a reduction in the interaction time between neighboring molecules. As a result, the intermolecular force between the molecules decreases and hence the magnitude of the viscous friction decreases. Our analysis indicates that as the room temperature steps up, the ESR increases supporting the previously observed experimental analysis. Not only did we reconfirm the previously known results, but also propose a way of controlling false positive or false negative results.
Furthermore we study the dynamics of the RBC along a Westergren pipet that is held in an upright position. The exact analytic result depicts that the velocity of the RBC increases in time. As the number of cells that form rouleaux steps up, the velocity increases since the weight of the cluster dominates the viscous friction force. Moreover, when the temperature of the room increases, the velocity steps up since the viscosity of the fluid tends to decreases with temperature. On the other hand, the position of the cells along the tube is investigated as a function of time and cluster size.
The rest of the paper is organized as follows. In section II, we present the model system. In section III, we explore the dependence of ESR on the number of RBCs that form clusters as well as on the background temperature. The dynamics of the cells is explored in section IV. Section V deals with summary and conclusion.
II The model
The dynamics of RBC is modeled as a Brownian particle that undergoes a biased random walk on one dimensional upright Westergren pipet length under the influence of gravitational force
| (1) |
where is the mass of the red blood cells and is the gravitational acceleration. denotes the number of red blood cells that forms rouleaux. The total number of RBC in Westergren pipet can be inferred since in Westergren lab analysis, blood is collected into the test tube that contains preservative called sodium citrate. The normal value of RBC on average varies from aa12 ; aa13 ; aa14 . This implies that the total number of the RBCs contained in Westergren tube varies as .
Overdamped case:— Since blood is a highly viscous medium, the chance for the RBC to accelerate is negligible. One can then neglect the inertia effect and the corresponding dynamics can be studied via Langevin equation
| (2) |
For a non-Newtonian fluid such blood, it is reasonable to assume that when the temperature of the blood sample increases by degree celsius, its viscosity steps down by percent aa15 as where is the viscosity of blood at a room temperature ( degree celsius) and is the temperature aa16 . The random noise is assumed to be Gaussian white noise satisfying the relations and . is Boltzmann constant.
In the high friction limit, the dynamics of the Brownian particle is governed by
| (3) |
where is the probability density of finding the particle (the cell) at position and time .
The RBC hops in a periodic isothermal medium of length . The cell is also exposed to the external load. In order to calculate the desired thermodynamic quantity, let us first find the probability distribution. After some algebra one finds the probability distribution as
| (4) |
where is the temperature of the medium. For detailed mathematical analysis, please refer to my previous work aa16 . The particle current is then given by
| (5) |
The velocity of the cells at any time is given by
| (6) |
while the position of the cells can be found via
| (7) |
Underdamped case :— If the inertia effect is included, the Langevin equation can be written as
| (8) |
After some algebra, the average velocity is simplified to
| (9) |
At steady state (in long time limit), the velocity (Eqs. (6) and (9) ) approach . This result agrees with our previous works aa8 ; aa17 .
The diffusion constant for the model system is given by . This equation is valid when viscous friction is temperature dependent showing that the effect of temperature on the cells mobility is significant. When temperature increases, the viscous friction gets attenuated and as a result the diffusibility of the particle increases. Various experimental studies also showed that the viscosity of the medium tends to decrease as the temperature of the medium increases aa1 . This is because increasing the temperature steps up the speed of the molecules, and this in turn creates a reduction in the interaction time between neighboring molecules. As a result, the intermolecular force between the molecules decreases and hence the magnitude of the viscous friction decreases. Next we explore the dependence of the ESR on number of RBCs that form rouleaux.
III The erythrocyte sedimentation rate in Westergren pipet
III.1 ESR as a function of the number of red blood cells that form rouleaux
In this section, the dependence of ESR on the number of erythrocytes that bind together in the sedimentation process is explored. As discussed before, the repulsive coulomb force between the RBCs keeps apart the cells from binding. As the result the viscous friction of the blood compels the cells to remain suspended in the solution. The presence of inflammatory disease results in elevated plasma fibrinogen. The fibrinogen forces the RBC to stick to each other to form aggregates of RBC called rouleaux. As the mass of the rouleaux increases, the weight of the cluster dominates the vicious friction and as a result the RBC starts to sediment. As depicted in the work aa18 , the sedimentation rate is linearly correlated with fibrinogen blood level.
As the fibrinogen blood level steps up, more RBCs tend to bind. Hence it is vital to explore the number of red blood cells that are involved in the sedimentation process at a given ESR. Exploiting Eqs. (6), (7) and (9), one can see that as the number of red blood cells () that form rouleaux steps up, the sedimentation rate increases (see Fig. 3). Figure 3 depicts the plot of ESR as a function of the number of RBCs (at degree celsius) that forms rouleaux. As shown in the figure, the ESR increases as steps up. The abnormal value for ESR is observed when or more RBCs form aggregate.

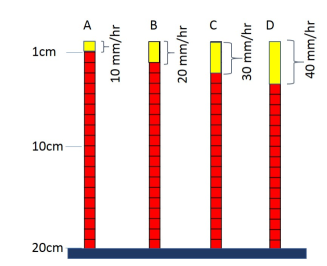
Figure 3 can be more illustrated by drawing a schematic diagram to show the dependence of on . Based on the result depicted in Figure 3, we redraw a schematic diagram in Fig. 4. The figure shows that , , and when (the number of RBCs that form aggregate) , , and , respectively. One can note that each RBC undergoes a biased random walk since the external load (the weight of RBCs) compels the cells to sediment. The repulsive coulomb force interaction between the cells is negligible in comparison with the gravitational force. Next we will explore the effect of temperature on ESR.
III.2 The effect of temperature on ESR
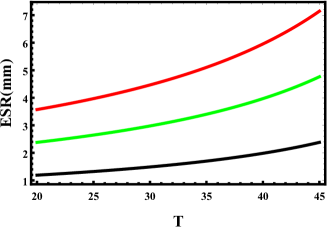
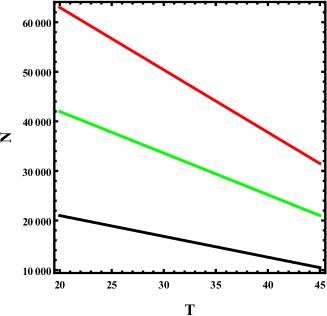
The viscous friction of the fluid depends on the intensity of the background temperature of the fluid showing that the effect of temperature on the cell mobility is significant. When temperature increases, the viscous friction gets attenuated and as a result, the diffusibility of the cells increases as shown in the works aa1 ; aa8 . For a non-Newtonian fluid such blood, it is reasonable to assume that when the temperature of the blood sample increases by degree celsius, its viscosity steps down by percent. Exploiting Eqs. (6), (7) and (9), the dependence of the erythrocyte sedimentation rate as a function of temperature (in degree celsius) is depicted in Figure 5. In the figure, the number of RBCs that form clusters are fixed as , and from top to bottom, respectively. The figure depicts that the ESR steps up as the number of red blood cells () that form rouleaux increases as well as when the temperature of the room steps up. The same figure shows that up to 3mm/hr sedimentation rate difference can be observed when the temperature of the room varies from 20 to 45 degree celsius.
To explore the role of the model parameters in detail, it is instructive to draw the phase diagram as a function of by fixing the sedimentation rate as shown in Fig. 6. In the figure, the sedimentation rates are fixed as , and from top to bottom, respectively. The phase diagram exhibits that the temperature of the medium significantly affects the sedimentation rate.
All of the above analysis points that the increase in the room temperature (the temperature of the sample) results in a false positive result. The shape of RBC, plasma viscosity and inclination of the test tube also affect the magnitude of ESR. Low hematocrit level is observed in anemic patents. As the hematocrit level decreases, the viscosity of the blood decreases which results in high ESR level. Excessive use of anticoagulant reduces the viscosity of the blood and in this case a false positive result can be observed.
IV The erythrocytes dynamics along Westergren pipet
Once the blood is mixed with anticoagulant and allowed to stand in Westergren pipet, the red blood cells start undergoing a biased Brownian motion against the viscous medium. Here care must be taken since the viscosity of the blood is also sensitive to the amount of anticoagulant administered during the experiment. Excessive use of anticoagulant results in a false positive result.

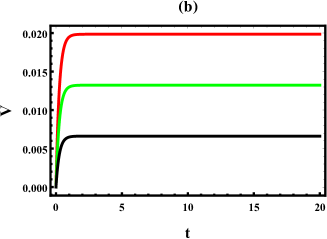
As discussed before, the background temperature of the fluid compels the cells to walk randomly as long as the plasma fibrinogen level is above a certain threshold. In this case, the RBCs repeal each other as they are negatively charged. When the blood fibrinogen level steps up, the cells form rouleaux as a result the gravitational force (the weight of the cluster) overcome the viscous friction. The cells then move with non-zero velocity as shown in Fig. 7. Figure 7a depicts the velocity () as a function of time for a single RBC at degree celsius. Figure 5b exhibits the velocity () as a function of time for a cluster of RBCs , and from top to bottom at degree celsius, respectively. The figures exhibits that the velocity steps up as and increase as expected.

Exploiting Eq. (6), one can see that at steady state (in long time limit), the velocity approach
| (10) |
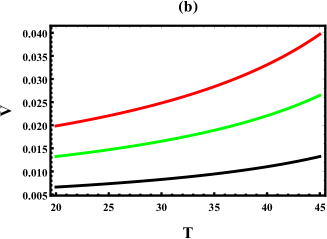
The intensity of the background temperature also significantly affects the velocity since the magnitude of the viscous friction depends on the intensity of the temperature. As the temperature steps up, the velocity increases (see Fig. 6) showing that this false positive result can be fixed by performing the clinical experiment at room temperature. Figure 8a shows the velocity () as a function of temperature (in degree celsius) for a single RBC at fixed time . Figure 8b exhibits the velocity () as a function of temperature (in degree celsius) for clusters of RBCs , and from top to bottom, respectively. The temperature is fixed at degree celsius.

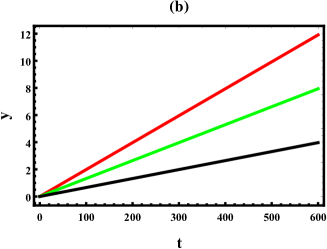
In Fig. 9a, the displacement () as a function of time is plotted for a single RBC at degree celsius. Figure 9b depicts the displacement () as a function of time for clusters of RBCs , and from top to bottom, respectively at degree celsius.
V Summary and conclusion
An erythrocyte sedimentation rate is a common hematology test which is performed by mixing the whole blood with anticoagulant. The blood is then placed in an upright Wintrobe or Westergren tube. The sedimentation rate of the red blood cells is measured in millimeters (mm) at the end of one hour. ESR measures how fast a blood sample sediments along a test tube in one hour in a clinical laboratory. Elevated erythrocyte sedimentation rate is not only due to high level of fibrinogen and gamma globulins but also it can be caused by the inclination of the test tube. The temperature of the laboratory (blood sample) also significantly affects the test result.
In this work, we explore how the ESR and the dynamic of red blood cells behave analytically. Solving the Fokker Planck equation analytically, we explore the dependence of the ESR as a function of the model parameters. The exact analytic results indicate that the ESR increases as the red blood cells form aggregates. Particularly the result obtained in this work exposes the dependence of the rate of sedimentation as a function of the number of red blood cells that bind together in the sedimentation process. The effect of temperature on the sedimentation rate is also studied analytically. Our analysis indicates that as the temperature pf the room steps up, the ESR increases supporting the previously observed experimental analysis.
The dynamics of the RBC along a Westergren pipette that held in upright position is also explored. The exact analytic result depicts that the velocity of the RBC increases in time. As the number of cells that form rouleaux steps up, the velocity increases since the weight of the cluster dominates the viscous friction force. Moreover, when the temperature of the room increases, the velocity steps up since the viscosity of the fluid tends to decreases with temperature. On the other hand, the position of the cells along the tube is investigated as a function of time and cluster size.
In conclusion, in this work we present an important model system. Since this study is performed by considering real physical parameters, the results obtained in this work non only agree with the experimental observations but also helps to understand most hematological experiments that are conducted in vitro. Not only we reconfirmed the previously known results, but also we propose a way of controlling false positive or false negative results.
Acknowledgment.— I would like to thank Mulu Zebene and Blyanesh Bezabih for the constant encouragement.
References
- (1) O. Reynolds, Phil Trans Royal Soc London 177, 157 (1886).
- (2) O. Baskurt, B. Neu and H. J. Meiselman, Red Blood Cell Aggregation. DOI https://doi.org/10.1201/b11221, (2011).
- (3) Alan H. B. Wu, Tietz Clinical Guide to Laboratory Tests, Elsevier Health Sciences, (2006).
- (4) S. E.Bedell and B. T. Bush, The American Journal of Medicine, 78, 1001 (1985).
- (5) This file is made available by MechESR under the Creative Commons CC 1.0 Universal Public Domain Dedication.Images (Wikimedia Commons).
- (6) This file is made available by Michail Charakidis and David Joseph Russell distributed under a CC-BY 2.0 license (Wikimedia Commons).
- (7) D. Davalos and K. Akassoglo, Semin Immunopathol, DOI 10.1007/s00281-011-0290-8, 1001 (2011).
- (8) H.A. Kramer. Physica 7, 284 (1940).
- (9) M. A. Taye and S. Duki, Eur. Phys. J. B 88, 322 (2015).
- (10) M. A. Taye and W. Sung, EPL 90, 3008 (2010).
- (11) M. A. Taye, Phys. Rev. E 82, 021111 (2010).
- (12) C. W. Gardiner. Handbook of Stochastic Methods for Physics, Chemistry and the Natural Sciences. Springer, Berlin, (1984).
- (13) E. Bianconi, A. Piovesan, F. Facchin, A. Beraudi, R. Casadei, F. Frabetti, L. Vitale, M. C. Pelleri and S. Tassani, Annals of Human Biology 40, : 463 (2013), doi:10.3109/03014460.2013.807878.
- (14) S. R. Hillman, K. A. Ault, H. M. Rinder. Hematology in Clinical Practice: A Guide to Diagnosis and Management. McGraw-Hill Professional (2005).
- (15) A. A. D’Alessandro, Blood Transfusion 15, 182 (2017).
- (16) R. E. Klabunde, Cardiovascular Physiology Concepts., Lippincott Williams and Wilkins (2005).
- (17) M. A. Taye, Phys. Rev. E 94, 032111 (2016).
- (18) M. A. Taye and M. Bekele, EPJB 38, 457 (2004).
- (19) W. Yin, Z. Xu, J. Sheng, X. Xie, and C. Zhang, Exp. Ther. Med 14, 1909 (2017).