11email: {htang6, xhx}@uci.edu 22institutetext: Deep Voxel Inc.
22email: {chupengz}@deep-voxel.com
NoduleNet: Decoupled False Positive Reduction for Pulmonary Nodule Detection and Segmentation
Abstract
Pulmonary nodule detection, false positive reduction and segmentation represent three of the most common tasks in the computer aided analysis of chest CT images. Methods have been proposed for each task with deep learning based methods heavily favored recently. However training deep learning models to solve each task separately may be sub-optimal - resource intensive and without the benefit of feature sharing. Here, we propose a new end-to-end 3D deep convolutional neural net (DCNN), called NoduleNet, to solve nodule detection, false positive reduction and nodule segmentation jointly in a multi-task fashion. To avoid friction between different tasks and encourage feature diversification, we incorporate two major design tricks: 1) decoupled feature maps for nodule detection and false positive reduction, and 2) a segmentation refinement subnet for increasing the precision of nodule segmentation. Extensive experiments on the large-scale LIDC dataset demonstrate that the multi-task training is highly beneficial, improving the nodule detection accuracy by 10.27%, compared to the baseline model trained to only solve the nodule detection task. We also carry out systematic ablation studies to highlight contributions from each of the added components. Code is available at https://github.com/uci-cbcl/NoduleNet.
Keywords:
pulmonary nodule detection and segmentation deep convolutional neural network1 Introduction
Lung cancer has the highest incidence and mortality rates worldwide [3]. Early diagnosis and treatment of pulmonary nodules can increase the survival rate of patients. Computed tomography (CT) has been widely used and proved effective for detecting pulmonary nodules. However, manually identifying nodules in CT scans is often time-consuming and tedious, because a radiologist needs to read the CT scans slice by slice, and a chest CT may contain over 200 slices. Accurate and precise nodule segmentation can provide more in-depth assessment of the shape, size and change rate of the nodule. When nodule is identified, a follow up scan in 3 - 12 months is usually required to assess its growth rate [7]. The growth of the lung tumor may be an indicator for malignancy, and an accurate nodule segmentation can be used for measuring the growth rate of the nodule.
In recent years, deep convolutional neural network has emerged as a leading method for automatically detecting and segmenting pulmonary nodules and have achieved great success. State-of-the-art frameworks for nodule detection often ustilize the 3D region proposal network (RPN) [12] for nodule screening [15, 19, 14, 10], followed by a 3D classifier for false positive reduction [5, 16]. Although single stage detector has also been proposed in [8], their hit criteria was different from what was more commonly adopted [14]. Moreover, the refinement provided by the extra classifiers may correct some errors made by the detectors. In terms of nodule segmentation, U-Net [13] and V-Net [11] like structure is predominantly used [17, 18, 1]. In practice, a computer aided diagnosis (CAD) system for pulmonary nodule detection and segmentation often consists of several independent subsystems, optimized separately.
There are some limitations on handling each task completely independent. First, it is time-consuming and resource intensive to train several deep convolutional neural networks. Although each component is designed for different purposes, they share the common procedure of extracting feature representations that characterize pulmonary nodules. Second, the performance of the whole system may not be optimal, because separately training several systems prevents communication between each other and learning intrinsic feature representations. Intuitively, the segmentation mask of the nodule should provide a strong guide for the neural network to learn discriminative features, which may in turn improve the performance of nodule detection.
Although multi-task learning (MTL) and feature sharing offer an attractive solution to combine different tasks, a naive implementation may cause other problems [4]. First, because of the mismatched goals of localization and classification, it may be sub-optimal if these two tasks are performed using the same feautre map. Second, a large receptive field may integrate irrelevant information from other parts of the image, which may negatively affect and confuse the classification of nodules, especially small ones. [4] decoupled localization and classification to address the problem in natural imaging. However, completely separating the two tasks without sharing any feature extraction backbone, still prevents cross-talk between two networks and may not be the most efficient. Therefore, a decoupled false positive reduction, that pools features from early scales of the feature extraction backbone, is proposed to address this problem, which allows learning both task-independent and task-dependant features.
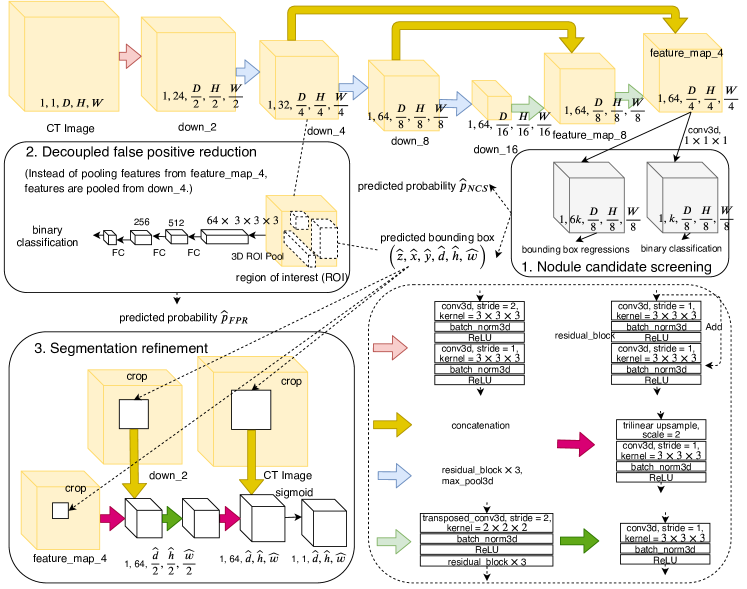
Here, we propose a new end-to-end framework, called NoduleNet, for solving pulmonary nodule candidate screening, false positive reduction and segmentation jointly. NoduleNet consists of three parts: nodule candidate screening, false positive reduction and segmentation refinement (Figure 1). These three components share the same underlying feature extraction backbone and the whole network is trained in an end-to-end manner.
Our main contributions are summarized as follows:
-
•
We propose a unified model to integrate nodule detection, false positive reduction and nodule segmentation within a single framework, trained end-to-end in a multi-task fashion.
-
•
We demonstrate the effectiveness of the model, improving nodule detection accuracy by 10.27% compared to the baseline model trained only for nodule detection, and achieving a state-of-the-art nodule segmentation accuracy of 83.10% on Dice-Sørensen coefficient (DSC).
-
•
We carry out systematic ablation studies to verify the contributions of several design tricks underlying NoduleNet, including decoupled features maps, segmentation refinement subnet, and multi-task training.
2 NoduleNet
2.0.1 Nodule candidate screening (NCS)
To generate nodule candidates, a 3D convolutional layer is applied to the feature map (feature_map_4 in Figure 1), followed by two parallel convolutional layers to generate classification probability and six regression terms associated with each anchor at each voxel on the feature map. An anchor is a 3D box, which requires six parameters to specify: central z-, y-, x- coordinates, depth, height and width. We chose cube of size 5, 10, 20, 30 and 50 as the 5 anchors in this work. Then, we minimize the same multi-task loss function as [12].
2.0.2 Decoupled false positive reduction (DFPR)
Unlike [12] that performs classification using features pooled from the same feature map as RPN (feature_map_4). Learning using coupled feature map may lead to sub-optimal solutions of the two tasks. Instead, we use 3D region of interest (ROI) pooling layer to pool features from early feature map that has a small receptive field (down_4). This not only ensures the false positive reduction network has a small receptive field and can learn feature representations that are substantially different from nodule candidate screening network, but also allows sharing of a few feature extraction blocks. The false positive reduction network minimizes the same multi-task in loss function as the NCS .
2.0.3 Segmentation refinement (SR)
As shown in Figure 1, segmentation is performed at the same scale of the original input CT image, by progressively upsampling the cropped high-level feature map (feature_map_4) and concatenating them with low-level semantically strong features.
This approach is fundamentally different from the mask branch proposed in [6]. In [6], the authors perform segmentation by only using downsampled feature map and then resize the predicted mask back to the original image scale, which may lose precision due to bounding box regression errors and loss of more fine-grained local features.
Another advantage is that, only the regions have nodules are upsampled to the original image scale, which only accounts for a small area of the whole input image. This saves a large amount of GPU memory, making whole volume input feasible during training and testing, as compared to upsampling the whole feature map to original input scale in [11].
The segmentation refinement network minimizes the soft dice loss of the predicted mask sets and the ground truth mask sets of the input image.
3 Results
3.0.1 Data and experiment configurations
We used LIDC-LDRI [2] for evaluting the performance of NoduleNet. LIDC-LDRI is a large-scale public dataset for studying lung cancers, which contains 1018 sets of CT scans collected from multiple sites with various slice thickness. Nodules with diameter equal or greater than 3 mm in this dataset have contour outlined by up to four radiologists. We included only those CT scans met the selection criteria of LUNA16 [14] in this work. If the two segmentation masks provided by two radiologists have an intersection over union (IoU) larger than 0.4, we consider the two masks are referring to the same nodule. We consider nodules annotated by at least 3 out of 4 radiologists the ground truth, resulting in a total number of 586 CT scans with 1131 nodules. Note that the number of CT scans and nodules included in this work may be different from previous work [17, 18, 1], due to different inclusion criteria.
A six-fold cross validation was performed to demonstrate the performance of NoduleNet. All models in the experiment were trained using stochastic gradient descent (SGD) with initial learning rate 0.01, momentum 0.9 and penalty 0.0001, for 200 epochs. The learning rate was scheduled to decrease to 0.001 after 100 epochs and to 0.0001 after another 60 epochs.
Free-Response Receiver Operating Characteristic (FROC) [9] analysis was adopted for evaluating the performance of nodule detection. We used the same hit criterium and competition performance metric (CPM) as in the LUNA16 [14]. Intersection over union (IoU) and Srensen-Dice coefficient (DSC) were used for evaluating the performance of nodule segmentation.
3.0.2 Nodule detection performance
In order to fully verify and understand our aforementioned assumptions, we conducted extensive experiments using different network architectures and design choices. We use to represent network that only has NCS branch, for network has both NCS and FPR branches, and for network has all NCS, FPR and SR branches. represents the FPR branch is built on the same feature map as NCS, and means the FPR branch is built on the decoupled feature map mentioned in previous section. R means the training data is extraly augmented with - plane rotation. NCS means the predicted probability comes from NCS branch, FPR means the predicted probability comes from FPR branch, and FU means the predicted probability is fused from NCS and FPR. Note that is the widely used 3D RPN for nodule detection [15, 16, 19, 10], which was served as a strong baseline for evaluating the performance of each added component. The results are summarized in Table 1.
As seen from Table 1, the sensitivity at 8 false positives per patient rate has a consistent improvement of 1.0% to 1.5% by adding the segmentation refinement network (), which demonstrates the effectiveness of using the extra nodule segmentation information.
The average sensitivity of the NoduleNet using decoupled false positive reduction () has around 3% to 4% improvement over the NoduleNet using coupled false positive (). Moreover, by adding rotation in data augmentation (R), the performance of FPR branch is further improved by around 2.5% while the performance of NCS branch remains almost the same. This verifies our assumption that classification should learn invariant features, while localization may learn co-variant features. Those findings demonstrate the importance of decoupling modules that are essentially learning different tasks.
By fusing the predicted probability from NCS and FPR, the performance was consistently improved by 0.7% - 1.0%, demonstrating that combining predictions from branches that perceive different level of context information is important.
By adding false positive reduction and segmentation refinement network, the performance of the baseline detector (NCS) is correspondingly improved, showing the effectiveness of multi-task learning and feature sharing.
All together, NoduleNet outperforms a strong baseline single stage detector by 10.27%. Note that performance reported in LUNA16 may not be directly comparable to this work, because of different nodule selection criteria, and training and testing data splits. Also, this work focuses on the joint learning of nodule detection and segmentation, whereas the LUNA16 focuses only on nodule detection.
| Method | 0.125 | 0.25 | 0.5 | 1.0 | 2.0 | 4.0 | 8.0 | Avg. |
|---|---|---|---|---|---|---|---|---|
| (NCS) [15, 16, 19, 10] | 52.17 | 62.51 | 71.09 | 80.46 | 87.27 | 91.07 | 94.43 | 77.00 |
| + (NCS) | 53.85 | 62.07 | 71.09 | 79.22 | 86.74 | 90.98 | 93.28 | 76.75 |
| + (FPR) [16] | 55.79 | 66.93 | 75.77 | 82.40 | 88.68 | 91.78 | 93.10 | 79.21 |
| + (NCS) | 53.67 | 63.84 | 74.62 | 83.20 | 88.51 | 92.04 | 94.96 | 78.69 |
| + (FPR) | 57.38 | 65.96 | 77.19 | 84.97 | 89.92 | 93.28 | 95.40 | 80.59 |
| + (NCS) | 56.15 | 66.93 | 74.54 | 82.23 | 88.59 | 92.22 | 95.05 | 79.39 |
| + (FPR) | 61.98 | 71.26 | 78.78 | 85.41 | 89.30 | 92.22 | 95.31 | 82.04 |
| + (NCS) | 61.45 | 70.20 | 78.16 | 84.62 | 90.27 | 93.63 | 96.20 | 82.08 |
| + (FPR) | 68.08 | 73.56 | 81.70 | 85.94 | 90.80 | 93.90 | 96.55 | 84.36 |
| + (FU) | 68.70 | 75.60 | 82.23 | 87.36 | 92.04 | 94.96 | 96.46 | 85.34 |
| + + R (NCS) | 62.78 | 70.65 | 78.43 | 84.44 | 89.74 | 93.10 | 95.49 | 82.09 |
| + + R (FPR) | 69.23 | 77.01 | 84.70 | 89.48 | 93.37 | 95.23 | 96.55 | 86.51 |
| + + R (FU) | 70.82 | 78.34 | 85.68 | 90.01 | 94.25 | 95.49 | 96.29 | 87.27 |
3.0.3 Nodule segmentation performance
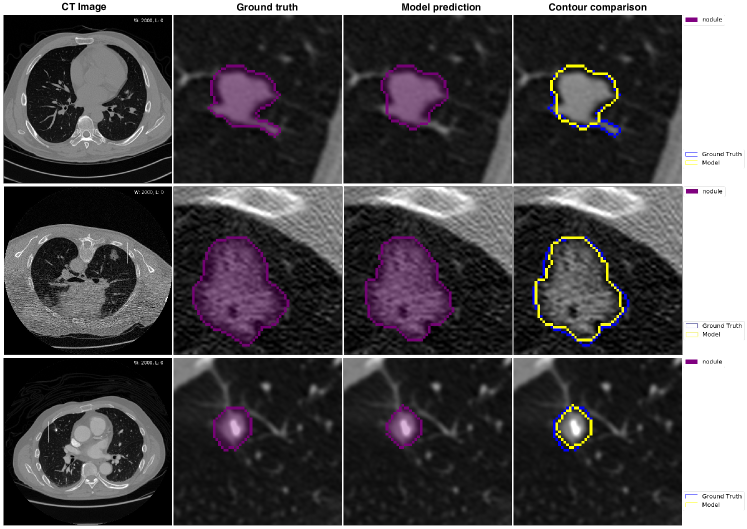
In Table 2, we compared the segmentation performance of NoduleNet to other deep learning based methods trained and tested on LIDC dataset [17, 18, 1]. NoduleNet outperformed previous state-of-the-art deep learning based method by 0.95% on DSC, without the need to train a separate and dedicated 3D DCNN for nodule segmentation. We randomly selected several nodules for visualizing the segmentation quality (Figure 2).
| Approach | # Nodules | # Consensus | IoU (%) | DSC (%) | |
| train | test | ||||
| Wu et al. [18] | 1404 | 1404 | 3 | N\A | 73.89 3.87 |
| Aresta et al. [1] | 1593 | 1593 | 3 | 55.00 14.00 | N\A |
| Wang et al. [17] | 350 | 493 | 4 | 71.16 12.22 | 82.15 10.76 |
| NoduleNet | 1131 | 1131 | 3 | 69.98 10.80 | 81.80 8.65 |
| NoduleNet | 1131 | 712 | 4 | 71.85 10.48 | 83.10 8.85 |
4 Conclusion
In this work, we propose a new end-to-end 3D DCNN, named NoduleNet, for solving pulmonary nodule detection, false positive reduction and segmentation jointly. We performed systematic analysis to verify the assumptions and intuitions behind the design of each component in the architecture. Cross validation results on LIDC dataset demonstrate that our model achieves a final CPM score of 87.27% on nodule detection and DSC score of 83.10% on nodule segmentation, representing current state-of-the-arts on this dataset. The techniques introduced here are general, and can be readily transferred to other models.
References
- [1] Aresta, G., Jacobs, C., Araújo, T., Cunha, A., Ramos, I., van Ginneken, B., Campilho, A.: iw-net: an automatic and minimalistic interactive lung nodule segmentation deep network. arXiv preprint arXiv:1811.12789 (2018)
- [2] Armato, S.G., McLennan, G., Bidaut, L., McNitt-Gray, M.F., Meyer, C.R., Reeves, A.P., Zhao, B., Aberle, D.R., Henschke, C.I., Hoffman, E.A., et al.: The lung image database consortium (lidc) and image database resource initiative (idri): a completed reference database of lung nodules on ct scans. Medical physics 38(2), 915–931 (2011)
- [3] Bray, F., Ferlay, J., Soerjomataram, I., Siegel, R.L., Torre, L.A., Jemal, A.: Global cancer statistics 2018: Globocan estimates of incidence and mortality worldwide for 36 cancers in 185 countries. CA: a cancer journal for clinicians 68(6), 394–424 (2018)
- [4] Cheng, B., Wei, Y., Shi, H., Feris, R., Xiong, J., Huang, T.: Revisiting rcnn: On awakening the classification power of faster rcnn. In: Proceedings of the European Conference on Computer Vision (ECCV). pp. 453–468 (2018)
- [5] Ding, J., Li, A., Hu, Z., Wang, L.: Accurate pulmonary nodule detection in computed tomography images using deep convolutional neural networks. In: International Conference on Medical Image Computing and Computer-Assisted Intervention. pp. 559–567. Springer (2017)
- [6] He, K., Gkioxari, G., Dollár, P., Girshick, R.: Mask r-cnn. In: Proceedings of the IEEE international conference on computer vision. pp. 2961–2969 (2017)
- [7] Kalpathy-Cramer, J., Zhao, B., Goldgof, D., Gu, Y., Wang, X., Yang, H., Tan, Y., Gillies, R., Napel, S.: A comparison of lung nodule segmentation algorithms: methods and results from a multi-institutional study. Journal of digital imaging 29(4), 476–487 (2016)
- [8] Khosravan, N., Bagci, U.: S4nd: Single-shot single-scale lung nodule detection. In: International Conference on Medical Image Computing and Computer-Assisted Intervention. pp. 794–802. Springer (2018)
- [9] Kundel, H., Berbaum, K., Dorfman, D., Gur, D., Metz, C., Swensson, R.: Receiver operating characteristic analysis in medical imaging. ICRU Report 79(8), 1 (2008)
- [10] Liao, F., Liang, M., Li, Z., Hu, X., Song, S.: Evaluate the malignancy of pulmonary nodules using the 3-d deep leaky noisy-or network. IEEE transactions on neural networks and learning systems (2019)
- [11] Milletari, F., Navab, N., Ahmadi, S.A.: V-net: Fully convolutional neural networks for volumetric medical image segmentation. In: 2016 Fourth International Conference on 3D Vision (3DV). pp. 565–571. IEEE (2016)
- [12] Ren, S., He, K., Girshick, R., Sun, J.: Faster r-cnn: Towards real-time object detection with region proposal networks. In: Advances in neural information processing systems. pp. 91–99 (2015)
- [13] Ronneberger, O., Fischer, P., Brox, T.: U-net: Convolutional networks for biomedical image segmentation. In: International Conference on Medical image computing and computer-assisted intervention. pp. 234–241. Springer (2015)
- [14] Setio, A.A.A., Traverso, A., De Bel, T., Berens, M.S., van den Bogaard, C., Cerello, P., Chen, H., Dou, Q., Fantacci, M.E., Geurts, B., et al.: Validation, comparison, and combination of algorithms for automatic detection of pulmonary nodules in computed tomography images: the luna16 challenge. Medical image analysis 42, 1–13 (2017)
- [15] Tang, H., Kim, D.R., Xie, X.: Automated pulmonary nodule detection using 3d deep convolutional neural networks. In: Biomedical Imaging (ISBI 2018), 2018 IEEE 15th International Symposium on. pp. 523–526. IEEE (2018)
- [16] Tang, H., Liu, X., Xie, X.: An end-to-end framework for integrated pulmonary nodule detection and false positive reduction. In: Biomedical Imaging (ISBI 2019), 2019 IEEE 16th International Symposium on. IEEE (2019)
- [17] Wang, S., Zhou, M., Liu, Z., Liu, Z., Gu, D., Zang, Y., Dong, D., Gevaert, O., Tian, J.: Central focused convolutional neural networks: Developing a data-driven model for lung nodule segmentation. Medical image analysis 40, 172–183 (2017)
- [18] Wu, B., Zhou, Z., Wang, J., Wang, Y.: Joint learning for pulmonary nodule segmentation, attributes and malignancy prediction. In: 2018 IEEE 15th International Symposium on Biomedical Imaging (ISBI 2018). pp. 1109–1113. IEEE (2018)
- [19] Zhu, W., Liu, C., Fan, W., Xie, X.: Deeplung: 3d deep convolutional nets for automated pulmonary nodule detection and classification. arXiv preprint arXiv:1709.05538 (2017)