Thermal-demagnetization-enhanced hybrid fiber-based thermometer coupled with nitrogen-vacancy centers
Abstract
Nitrogen-vacancy centers in diamond are attractive as quantum sensors owing to their remarkable optical and spin properties under ambient conditions. Here we experimentally demonstrated a hybrid fiber-based thermometer coupled with nitrogen-vacancy center ensemble and a permanent magnet, where the temperature sensitivity was improved by converting the temperature variation to the magnetic field change based on the thermal-demagnetization of the permanent magnet. We have achieved both large temperature working range (room temperature to K) and millikelvin sensitivity ( mK), nearly 6-fold improvement compared with conventional technique. This stable and compact hybrid thermometer will enable a wide range of applications for large-area detection and imaging with high temperature sensitivity.
A stable and compact thermometer capable of millikelvin resolution over a large temperature range could provide a powerful tool in many areas of physical, chemical, and biological researchesKucsko et al. (2013). Lots of promising approaches to local temperature sensing are being explored at present, including Raman spectroscopyKim et al. (2006), scanning probe microscopyYue and Wang (2012), and fluorescence-based measuremnetsOkabe et al. (2012) using nanoparticles and organicdyesVetrone et al. (2010). However, many of these methods are limited by drawbacks such as low sensitivity and systematic errors due to fluctuations in the fluorescence rate and the local environmentYan et al. (2018); Kucsko et al. (2013).
In recent years, the negatively charged nitrogen-vacancy (NV) center, a point defect in diamond, provides a promising system to realize practical quantum devices which have been successfully applied to a wide range of applications in quantum information processing and sensing in both physical and life sciencesSchirhagl et al. (2014). These applications of the NV center are based upon its remarkable optical and spin properties: bright optical fluorescence, long-lived spin coherence, and mature optical polarization and readout at room temperatureDong et al. (2018a). For the NV-based temperature sensing, the techniques with modified spin-echo sequenceKucsko et al. (2013) and high-order Carr-Purcell-Meiboom-Gill methodWang et al. (2015); Toyli et al. (2013) have achieved a sensitivity of mK. A nano-thermometer composed of NV centers and a magnetic nanoparticle has been experimentally demonstratedWang et al. (2018), where an optimal temperature sensitivity of mK has been obtained by the critical magnetization of the magnetic nanoparticle near Cuire temperature. Moreover, the recently developed fiber-optic probes coupled with NV centers were shown to enable a temperature measurement with a mK accuracy using optically detected magnetic resonance (ODMR)Fedotov et al. (2014); Blakley et al. (2016); Safronov et al. (2015).
In order to further enhance the sensitivity of the NV thermometer for practical application, here, we proposed a hybrid fiber-based thermometer coupled with NV center ensembles and a permanent magnet. By converting the temperature variation to a magnetic field changeWang et al. (2018); Wojciechowski et al. (2018) of the permanent magnet, this thermometer can achieve a high sensitivity of mK and a large temperature working range, where the permanent magnet is served as a transducer and amplifier of the local temperature variation owing to its temperature-dependent magnetisationWang et al. (2018); Broadway et al. (2018).
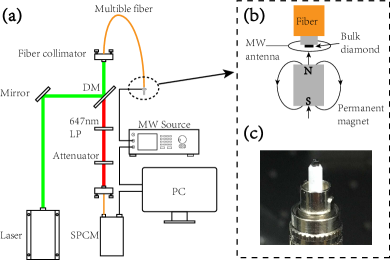
We used a homebuild fiber system and a microwave system to excite and detect the NV centers. A bulk diamond with the size of 11 mm3 was attached on the tip of a multi-mode optical fiber with a core diameter of m using UV curing glue, as shown in Fig.1. The NV center ensembles in diamond (100) grown by plasma assisted chemical vapor deposition consisted of a [] ppm and [] ppm. In the experiment, the fiber delivered the nm laser to excite NV centers. Collected by the same fiber, the photoluminescence (PL) from the NV center ensemble passed through a nm long pass filter and an attenuator. Finally, it was detected by single photon counting module. Microwave was delivered by a printed circuit board with optical fiber fixed on it. The cylindrical Neodymium-Iron-Boron (NdFeB) permanent ( mm 15 mm) provided a bias magnetic field along the [100] axis of the diamond, as shown in Fig.1(b) and (c). The magnetic field was projected equally onto all four orientations, resulting in a two-dip high contrast ODMR signal. The permanent magnet has a specified temperature coefficient of the magnetisation around room temperature which can be defined as
| (1) |
where is the magnetic field, and can be regarded as a constant at room temperature to 373 K for this type of permanent magnetWang et al. (2018); Broadway et al. (2018); Calin and Helerea (2011); Yan et al. (2011); Sebastian (1995).
The negatively charged NV center in diamond consists of a substitutional nitrogen associated with a vacancy in an adjacent lattice site of the diamond crystal. This defect exhibits an efficient and photostable red PL, which enables optical detection at room temperatureSuter and Jelezko (2017). The ground state is a spin triplet with symmetry including a singlet state and a doublet state separated by a temperature-dependent zero-field splitting (ZFS) GHz in the absence of magnetic field. Applying a static magnetic field along the NV axis leads to a splitting of and states. Moreover, the ground states are coupled to a spin triplet excited state using green light ( nm)Jensen et al. (2013); Dréau et al. (2011).
Considering the temperature effect, the spin Hamiltonian of the ground stateTetienne et al. (2012) can be written as
| (2) |
Here, S is the electronic spin operator. represents the local strain in the diamond which is almost temperature-independentAcosta et al. (2010). B is the applied magnetic field, and MHz/G. Assuming that , the changing temperature of the diamond results in a transition frequencies shift , which can be described as
| (3) |
where is the angle between magnetic field and NV axis. is the responsibility to the temperature shifts of the permanent magnet.
In the experiment, we executed the temperature measurements with two schemes. The first measurement was performed in the absence of the bias magnetic field ( = 0 G). It focused on the precise measurement of the ZFS shift with temperature. Hence Eq.(3) becomes . In the second measurement, we applied a temperature-dependent bias magnetic field along the [100] axis of the diamond where the angle between the magnetic field and each NV axis is Tetienne et al. (2012); Fukui et al. (2014).
According to Eq.(2) and Eq.(3), the temperature sensitivity is limited by the resonant frequency resolution of the ground sub-levels transition, which is similar to the sensitivity of DC magnetic field measurement. The principle of the magnetic field measurement has been well demonstratedDegen et al. (2017). The sensitivity has been analyzed theoretically and experimentally from Ramsey pulse sequences or pulsed-ODMR measurementDegen et al. (2017); Rondin et al. (2014); Chen et al. (2013); Dong et al. (2018b). Although ultrahigh sensitivity can be achieved by these techniques, the simplest way to detect an external DC magnetic field with NV ensemble remains the direct evaluation of ODMRHayashi et al. (2018), especially in the fiber-based diamond sensing for practical applicationLiu et al. (2013); Dong et al. (2018c). The shot-noise-limited sensitivity of the ODMR measurement is linked to the resonant frequency resolution , which is read as
| (4) |
where is the rate of detected photons per unit of time, is the ODMR contrast associated to the dip of PL intensity, is the parameter of the line shape and is the linewidthDegen et al. (2017); Rondin et al. (2014).
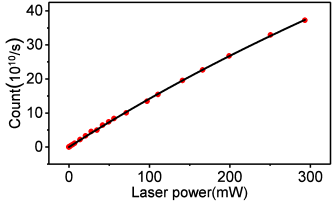
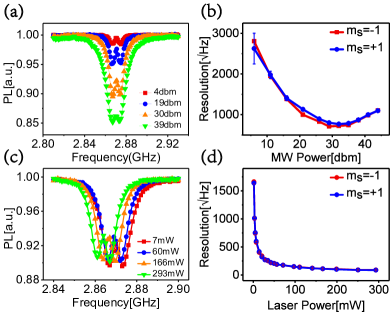
In the experiment, we first studied the conditions of the best resonance frequency resolution of the ODMR signals, including the laser power and microwave powerJensen et al. (2013); Dréau et al. (2011). The amount of red fluorescence as a function of green light power was measured, which is plotted in Fig.2, together with a fit of the form Jensen et al. (2013). Then, by fixing the laser light power to mW, we detected the ODMR signals with different settings of the microwave power , as shown in Fig.3(a). Even in the absence of external magnetic field, the local strain removes the degeneracy of the ground sublevels , giving rise to two well-resolved features in ODMR spectra. We can clearly observed that the increasing of the MW power leads to the broadening of the ODMR, as well as the increasing contrast. From this set of measurements, the resonant frequency resolution as a function of microwave power can be estimated using Eq.(4). An optimal resolution can be obtained with a typical microwave power dbm, as shown on Fig.3(b).
By keeping fixed to dbm, we experimentally measured the ODMR spectrum for pump laser power ranging from to mW, as shown in Fig.3(c). The linewidths extracted from the spectra show a decrease with the increase of pump power, dues to the effect of light-narrowingJensen et al. (2013). The pump laser with increasing power heats the diamond at the end of optical fiber, resulting in a shift of the spectra which agrees with the measurement in earlier studyFedotov et al. (2014). Moreover, the laser-heating effect further leads to a decreasing contrastLiu et al. (2019). According to Eq.(4) for the resonant frequency resolution, the best resolution was reached for microwave power dbm and light power mW, as shown in Fig.3(d). However, the resolution is expected to become worse eventually for higher light power.
For NV-based temperature measurement, we first recorded the ODMR spectra with the diamond at temperatures range from K to K. To control the diamond’s temperature, the diamond was mounted to a flexible resistive foil heater (HT10K, Thorlabs). The heater and the resistive temperature detector were both controlled by a temperature controller (TC200, Thorlabs) to achieve the temperature stability within K up to K in an atmospheric environment. However, the laser heating can significantly affect the detection accuracy of temperature. Firstly, we set the laser light power to mW rather than mW. In this case, the temperature of the diamond can be kept at room temperature, indicating that the heating effect can be ignored and the local temperature variation can be transferred to the quantum sensor. In the measurement process, the ZFS parameter was detected as a function of temperature, which is plotted and fitted in Fig.4(a). It shows a linear decrease with a slope of . The optimal temperature sensitivity using Eq.(3) was estimated to be . However, the ZFS parameter for NV center presents only a weak dependence on temperature (a small ). Moreover, the laser pump power can not be set at a higher level for more photon counts. Both of the these restrictions limit the further improvement of the sensitivity.
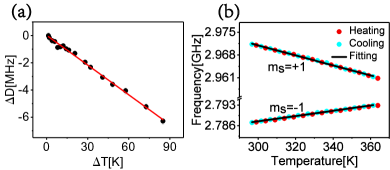
On the other hand, NV centers have been confirmed to be ultra-sensitive to external magnetic field Barry et al. (2019). Here, we demonstrated another scheme to improve the sensitivity by converting the temperature variation to a magnetic field changeWang et al. (2018); Liu et al. (2019). We applied a temperature-dependent magnetic field along the [100] axis of diamond by a permanent magnet. Under the conditions of the best resonance frequency resolution with the highest photon rate from Fig3(d), the bulk diamond on the tip of fiber was irradiated by laser with a constant power of mW which kept the diamond with a constant temperatureFedotov et al. (2014), K. With a heat insulation treatment, heating the permanent magnet will not induce the temperature shift of diamond. In this case, the temperature variation was converted to the magnetic field change which was detected by the NV center through the ODMR measurement. In the experiment, the ODMR measurement were carried out for temperatures of the permanent magnet from K to K, and the correlation between NV sublevels resonant transition frequency and temperature are shown in Fig.4(b). By linear fitting, the two slops were estimated to be and , respectively. Extracting the applied magnetic field from Fig.4(b), the temperature coefficient of permanent magnet was estimated to be by Eq.(1). Moreover, the frequency shift induced by the magnetization of the permanent magnet is reversible when the temperature is scanned back, as shown in Fig.4(b) with cyan dots, which indicates the stability of this hybrid sensorWang et al. (2018).
According to Eq.(1) and Eq.(3), both and the resonant frequency resolution contribute to the temperature sensitivity . To achieve the best temperature sensitivity of this hybrid sensor, should be large and should be the smallest. Fig.5(a) shows ODMR spectra with different settings of magnetic field and the extracted electron spin transition frequencies are plotted in Fig.5(b). However, the contrast of the ODMR signals significantly decreased with the increasing since the magnetic field was not along the NV axisTetienne et al. (2012) exactly, which led to a low resonant frequency resolution eventually, as shown in Fig.5(c). In this case, there is an extremum point for a typical magnetic field to obtain optimal temperature sensitivity. Given by Eq.(3), the sensitivity as a function of magnetic field is plotted in Fig.5(d). The optimal sensitivity of mK was reached for the magnetic field at the range of G. In comparison with the result of the bare bulk diamond on the tip of fiber, as shown in Fig.5(d), the sensitivity can be almost improved by -fold of magnitude using the hybrid thermometer. This scheme will become ultra-sensitive when the working temperature close to the magnetic phase transition point of the permanent magnet for a large temperature coefficient Wang et al. (2018). However, it will narrow the working range.
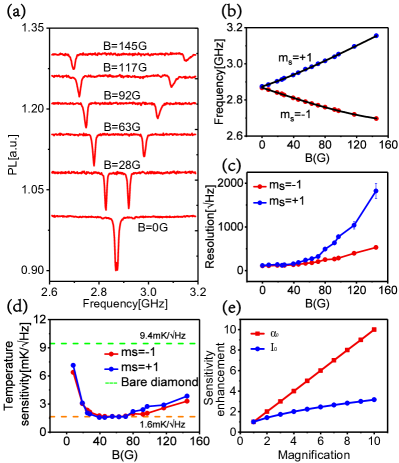
In the experiment, the sensitivity was limited by the density of NV centers. The generating efficiency of NV center ensemble is less than for our diamond sample. And by electron irradiation treatment, the density of NV center can be enhanced more than timesXu et al. (2018). With high-density NV ensemble, the temperature sensitivity can be improved by a factor of Rondin et al. (2014) when the collected PL signal is magnified by the number of the sensing spins, as shown in Fig.5(e) with blue line. A micro-concave mirror on the tip of the fiber can further improve the fluorescence excitation and collectionDuan et al. (2019, 2018). Moreover, a ferromagnetic material with higher temperature coefficient of the magnetisation at room temperature, such as vanadium oxideKrusin-Elbaum et al. (2004) (/K) and Ni-Mn-Sn alloysKrenke et al. (2005) (/K), can also significantly enhance the sensitivity, as shown in Fig.5(e) with red line. All of these methods can boost temperature sensitivity of this hybrid thermometer toward sub- mK over a large temperature range.
In summary, we have demonstrated a fiber-based hybrid thermometer with NV center ensembles in a bulk diamond. Based on thermal-demagnetization effect, the permanent magnet was served as a transducer and amplifier of the local temperature variation. We have achieved the temperature sensitivity of mK ranging from K to K. With further improvement on the sensitivity, such a stable and compact thermometer will be widely applied in physical, chemical, and biological science and technology.
Acknowledgment
This work is supported by the National Key Research and Development Program of China (No. 2017YFA0304504), the Science Challenge Project (No. TZ2018003), the National Natural Science Foundation of China (Nos. 91536219, 61522508, and 91850102), the Anhui Initiative in Quantum Information Technologies (No. AHY130000).
References
- Kucsko et al. (2013) G. Kucsko, P. C. Maurer, N. Y. Yao, M. Kubo, H. J. Noh, P. K. Lo, H. Park, and M. D. Lukin, \colorblueNature 500, 54 (2013).
- Kim et al. (2006) S. H. Kim, J. Noh, M. K. Jeon, K. W. Kim, L. P. Lee, and S. I. Woo, \colorblueJ. Micromech. Microeng. 16, 526 (2006).
- Yue and Wang (2012) Y. Yue and X. Wang, \colorblueNano Rev. 3, 11586 (2012).
- Okabe et al. (2012) K. Okabe, N. Inada, C. Gota, Y. Harada, T. Funatsu, and S. Uchiyama, \colorblueNat. Commun. 3, 705 (2012).
- Vetrone et al. (2010) F. Vetrone, R. Naccache, A. Zamarron, A. Juarranz de la Fuente, F. Sanz-Rodrguez, L. Martinez Maestro, E. Rodriguez, and J. A. Jaque, \colorblueACS nano 4, 3254 (2010).
- Yan et al. (2018) F.-F. Yan, J.-F. Wang, Q. Li, Z.-D. Cheng, J.-M. Cui, W.-Z. Liu, J.-S. Xu, C.-F. Li, and G.-C. Guo, \colorbluePhys. Rev. Appl. 10, 044042 (2018).
- Schirhagl et al. (2014) R. Schirhagl, K. Chang, M. Loretz, and C. L. Degen, \colorblueAnnu. Rev. Phys. Chem. 65, 83 (2014).
- Dong et al. (2018a) Y. Dong, B. Du, S.-C. Zhang, X.-D. Chen, and F.-W. Sun, \colorblueActa Phys. Sin. 67 (2018a).
- Wang et al. (2015) J. Wang, F. Feng, J. Zhang, J. Chen, Z. Zheng, L. Guo, W. Zhang, X. Song, G. Guo, L. Fan, et al., \colorbluePhys. Rev. B 91, 155404 (2015).
- Toyli et al. (2013) D. M. Toyli, F. Charles, D. J. Christle, V. V. Dobrovitski, and D. D. Awschalom, \colorblueProc. Natl. Acad. Sci. 110, 8417 (2013).
- Wang et al. (2018) N. Wang, G.-Q. Liu, W.-H. Leong, H. Zeng, X. Feng, S.-H. Li, F. Dolde, H. Fedder, J. Wrachtrup, X.-D. Cui, et al., \colorbluePhys. Rev. X 8, 011042 (2018).
- Fedotov et al. (2014) I. Fedotov, S. Blakley, E. Serebryannikov, N. Safronov, V. Velichansky, M. Scully, and A. Zheltikov, \colorblueAppl. Phys. Lett. 105, 261109 (2014).
- Blakley et al. (2016) S. Blakley, I. Fedotov, L. Amitonova, E. Serebryannikov, H. Perez, S. Y. Kilin, and A. Zheltikov, \colorblueOpt. Lett. 41, 2057 (2016).
- Safronov et al. (2015) N. Safronov, I. Fedotov, Y. G. Ermakova, M. Matlashov, D. Sidorov-Biryukov, A. Fedotov, V. Belousov, and A. Zheltikov, \colorblueAppl. Phys. Lett. 106, 163702 (2015).
- Wojciechowski et al. (2018) A. M. Wojciechowski, M. Karadas, C. Osterkamp, S. Jankuhn, J. Meijer, F. Jelezko, A. Huck, and U. L. Andersen, \colorblueAppl. Phys. Lett. 113, 013502 (2018).
- Broadway et al. (2018) D. A. Broadway, S. E. Lillie, N. Dontschuk, A. Stacey, L. T. Hall, J.-P. Tetienne, and L. C. Hollenberg, \colorblueAppl. Phys. Lett. 112, 103103 (2018).
- Calin and Helerea (2011) M.-D. Calin and E. Helerea, in \colorblue2011 7th international symposium on advanced topics in electrical engineering (ATEE) (IEEE, 2011) pp. 1–6.
- Yan et al. (2011) G. Yan, R. Chen, Y. Ding, S. Guo, D. Lee, and A. Yan, in \colorblueJ. Phys.: Conf. Ser., Vol. 266 (IOP Publishing, 2011) p. 012052.
- Sebastian (1995) T. Sebastian, \colorblueIEEE Trans. Ind. Appl. 31, 353 (1995).
- Suter and Jelezko (2017) D. Suter and F. Jelezko, \colorblueProg. Nucl. Magn. Reson. Spectrosc. 98, 50 (2017).
- Jensen et al. (2013) K. Jensen, V. Acosta, A. Jarmola, and D. Budker, \colorbluePhys. Rev. B 87, 014115 (2013).
- Dréau et al. (2011) A. Dréau, M. Lesik, L. Rondin, P. Spinicelli, O. Arcizet, J.-F. Roch, and V. Jacques, \colorbluePhys. Rev. B 84, 195204 (2011).
- Tetienne et al. (2012) J. Tetienne, L. Rondin, P. Spinicelli, M. Chipaux, T. Debuisschert, J. Roch, and V. Jacques, \colorblueNew J. Phys. 14, 103033 (2012).
- Acosta et al. (2010) V. M. Acosta, E. Bauch, M. P. Ledbetter, A. Waxman, L.-S. Bouchard, and D. Budker, \colorbluePhys. Rev. Lett. 104, 070801 (2010).
- Fukui et al. (2014) T. Fukui, Y. Doi, T. Miyazaki, Y. Miyamoto, H. Kato, T. Matsumoto, T. Makino, S. Yamasaki, R. Morimoto, N. Tokuda, et al., \colorblueAppl. Phys. Express 7, 055201 (2014).
- Degen et al. (2017) C. L. Degen, F. Reinhard, and P. Cappellaro, \colorblueRev. Mod. Phys. 89, 035002 (2017).
- Rondin et al. (2014) L. Rondin, J.-P. Tetienne, T. Hingant, J.-F. Roch, P. Maletinsky, and V. Jacques, \colorblueRep. Prog. Phys. 77, 056503 (2014).
- Chen et al. (2013) X.-D. Chen, F.-W. Sun, C.-L. Zou, J.-M. Cui, L.-M. Zhou, and G.-C. Guo, \colorblueEPL 101, 67003 (2013).
- Dong et al. (2018b) Y. Dong, Y. Zheng, S. Li, C.-C. Li, X.-D. Chen, G.-C. Guo, and F.-W. Sun, \colorbluenpj Quantum Information 4, 3 (2018b).
- Hayashi et al. (2018) K. Hayashi, Y. Matsuzaki, T. Taniguchi, T. Shimo-Oka, I. Nakamura, S. Onoda, T. Ohshima, H. Morishita, M. Fujiwara, S. Saito, et al., \colorbluePhys. Rev. Appl. 10, 034009 (2018).
- Liu et al. (2013) X. Liu, J. Cui, F. Sun, X. Song, F. Feng, J. Wang, W. Zhu, L. Lou, and G. Wang, \colorblueAppl. Phys. Lett. 103, 143105 (2013).
- Dong et al. (2018c) M. Dong, Z. Hu, Y. Liu, B. Yang, Y. Wang, and G. Du, \colorblueAppl. Phys. Lett. 113, 131105 (2018c).
- Liu et al. (2019) G.-Q. Liu, X. Feng, N. Wang, Q. Li, and R.-B. Liu, \colorblueNat. Commun. 10, 1344 (2019).
- Chen et al. (2011) X.-D. Chen, C.-H. Dong, F.-W. Sun, C.-L. Zou, J.-M. Cui, Z.-F. Han, and G.-C. Guo, \colorblueAppl. Phys. Lett. 99, 161903 (2011).
- Li et al. (2017) C.-C. Li, M. Gong, X.-D. Chen, S. Li, B.-W. Zhao, Y. Dong, G.-C. Guo, and F.-W. Sun, \colorblueDiamond Relat. Mater. 74, 119 (2017).
- Barry et al. (2019) J. F. Barry, J. M. Schloss, E. Bauch, M. J. Turner, C. A. Hart, L. M. Pham, and R. L. Walsworth, \colorbluearXiv preprint arXiv:1903.08176 (2019).
- Xu et al. (2018) J.-Y. Xu, Y. Dong, S.-C. Zhang, Y. Zheng, X.-D. Chen, W. Zhu, G.-Z. Wang, G.-C. Guo, and F.-W. Sun, \colorbluearXiv preprint arXiv:1811.00191 (2018).
- Duan et al. (2019) D. Duan, G. Du, V. K. Kavatamane, S. Arumugam, Y.-K. Tzeng, H.-C. Chang, and G. Balasubramanian, \colorblueOpt. Express 27, 6734 (2019).
- Duan et al. (2018) D. Duan, V. K. Kavatamane, S. R. Arumugam, G. Rahane, Y.-K. Tzeng, H.-C. Chang, H. Sumiya, S. Onoda, J. Isoya, and G. Balasubramanian, \colorblueAppl. Phys. Lett. 113, 041107 (2018).
- Krusin-Elbaum et al. (2004) L. Krusin-Elbaum, D. Newns, H. Zeng, V. Derycke, J. Sun, and R. Sandstrom, \colorblueNature 431, 672 (2004).
- Krenke et al. (2005) T. Krenke, E. Duman, M. Acet, E. F. Wassermann, X. Moya, L. Mañosa, and A. Planes, \colorblueNat. Mater. 4, 450 (2005).