Combined Effects of Rotation and Age Spreads on Extended Main Sequence Turn Offs
Abstract
The extended main sequence turn offs (eMSTOs) of several young to intermediate age clusters are examined in the Magellanic Clouds and the Milky Way. We explore the effects of extended star formation (eSF) and a range of stellar rotation rates on the behavior of the color-magnitude diagram (CMD), paying particular attention to the MSTO. We create synthetic stellar populations based on MESA stellar models to simulate observed Hubble Space Telescope and Gaia star cluster data. We model the effect of rotation as a non-parametric distribution, allowing for maximum flexibility. In our models the slow rotators comprise the blueward, and fast rotators the redward portion of the eMSTO. We simulate data under three scenarios: non-rotating eSF, a range of rotation rates with a single age, and a combination of age and rotation effects. We find that two of the five clusters (the youngest and oldest) favor an age spread, but these also achieve the overall worst fits of all clusters. The other three clusters show comparable statistical evidence between rotation and an age spread. In all five cases, a rotation rate distribution alone is capable of qualitatively matching the observed eMSTO structure. In future work, we aim to compare our predicted with observations in order to better constrain the physics related to stellar rotation.
1. Introduction
In the past decade, Hubble Space Telescope (HST) observations helped reveal the eMSTO phenomenon, now considered a ubiquitous feature of young star clusters in the Magellanic Clouds (e.g., Mackey & Broby Nielsen 2007; Mackey et al. 2008; Glatt et al. 2008; Milone et al. 2009; Goudfrooij et al. 2009), i.e., those with ages less than 2 Gyr. However, the origin of the eMSTO has remained a mystery. Recently revealed to be common in clusters of the Milky Way by Gaia (e.g., Marino et al. 2018a; Cordoni et al. 2018; Bastian et al. 2018) as well, suggesting that the eMSTO is a natural property of young star clusters, rather than a peculiarity of the Magellanic Clouds.
The eMSTO appears in a star cluster’s CMD as a broadened MSTO, as if the cluster hosts multiple single age MSTOs. At face value, this suggests that such clusters contain stars born over some period of eSF in the past (e.g., Rubele et al. 2010, 2011; Goudfrooij et al. 2011b, a; Conroy & Spergel 2011; Keller et al. 2011; Mackey et al. 2013), perhaps lasting a few hundred Myr. Thus, first instincts were to view the eMSTO as a consequence of eSF, which was surprising under conventional beliefs that regard young clusters as simple stellar populations (SSPs) with coeval stars. Alternate theories have arisen since then, but a definitive consensus on the cause of the eMSTO has not been met. Ultimately, uncovering the physical process(es) behind this phenomenon could open new chapters in stellar evolution and cluster formation.
Much effort to reveal the true origin of the eMSTO has focused on searching for observational evidence of eSF. Such evidence could elucidate the contemporaneous puzzle of “multiple populations” (MPs) observed in globular clusters (GCs) older than 2 Gyr, as reviewed by Bastian & Lardo (2018). Theoretically, eSF can reproduce observed eMSTO morphologies (e.g., Li et al. 2017), but it is challenged by a lack of empirical support, despite numerous observational campaigns. For example, Cabrera-Ziri et al. (2016) found no evidence for eSF events when modeling the spectral properties of the young massive cluster W3 in NGC 7252, despite this cluster’s young age and exceptionally large escape velocity (possibly conducive to entrapment of stellar ejecta and subsequent eSF). Relatedly, Piatti & Bastian (2016) and Cordoni et al. (2018) found that many young LMC and Galactic clusters possess eMSTOs as well, in spite of their relatively low masses (e.g., around 2400 for NGC 2818, Bastian et al. 2018); presenting additional evidence that eMSTOs exist independent of the cluster’s potential for gas retention. Observations have not revealed how these young clusters might retain enough gas to experience a (up to) several hundred Myr episode of star formation required to explain the largest eMSTOs. This is especially so, given that much more massive clusters like W3 (roughly 600 Myr old and , Cabrera-Ziri et al. 2016, and see also Cabrera-Ziri et al. 2014) appear to lack evidence of eSF.
An alternative explanation has developed alongside the eSF theory. Bastian & de Mink (2009) made a case for stellar rotation as being the cause of the eMSTO. Rotation can grant stars a greater core fuel supply, thereby extending main sequence (MS) lifetimes (see e.g., Meynet & Maeder 2000; Maeder & Meynet 2010; Girardi et al. 2011; Ekström et al. 2012; Choi et al. 2016). Rotation also causes gravity darkening, i.e., structural deformations that alter the apparent magnitudes and colors of rotating stars in a viewing angle dependent manner, see e.g., von Zeipel (1924); Lucy (1967); Espinosa Lara & Rieutord (2011). Combined, these effects allow coeval rotating stars to take on a range of colors and magnitudes that can mimic an age spread (e.g., Brandt & Huang 2015; Gossage et al. 2018) and create a broad MSTO. Additional observational evidence has accumulated for stellar rotation within the eMSTO (e.g. Bastian & de Mink 2009; Li et al. 2012; Yang et al. 2013; Niederhofer et al. 2015; Brandt & Huang 2015; Bastian et al. 2016; Niederhofer et al. 2016; Bastian et al. 2018; D’Antona et al. 2018, and Georgy et al. 2019). Furthermore, Johnston et al. (2019) have recently shown, using non-rotating stellar models calibrated on Kepler astroseismic data, that convective core overshooting can produce an eMSTO similar to observations. Thus, rotation and convective mixing are observed stellar processes at play in these clusters that may contribute to the eMSTO; we limit our study to the exploration of stellar rotation and age spreads as a matter of simplicity, but acknowledge that variable convective mixing efficiencies may also play a role.
A central finding in eMSTO studies has been that as clusters age, the eMSTO width increases (i.e., the (Age)-age trend highlighted by Niederhofer et al. 2015). This behavior may suggest that eMSTO width is related to stellar evolution, possibly the evolution of rotation. This interpretation says that the eMSTO is not due to a range of ages, but rather coeval stars with a distribution of rotation rates. If the (Age)-age trend is due to eSF, it would require that SF took longer in the past. This explanation is not impossible, but it is difficult to find a natural reason as to why the length of SF has steadily decreased over time. Furthermore, Cordoni et al. (2018) have found a similar (Age)-age trend for young Milky Way clusters, suggesting that the trend is not specific to the environments of the LMC/SMC. Many lines of evidence now point towards stellar rotation at least playing some role in causing the eMSTO. This is often acknowledged, but it is still argued that some degree of eSF may be present in these clusters.
Hiding underneath all of this could be additional effects due to stellar binary interactions. For instance, binary mergers could replenish stars nearing terminal age MS (TAMS), or otherwise alter their evolutionary trajectory. Relatively fewer studies have incorporated models that account for binary evolution, but work has been done by e.g., Yang et al. (2011) and Li et al. (2012, 2016). As high mass stars can still exist in young clusters, binary effects may be especially important there (e.g., Yang 2018 and suggested by Beasor et al. 2019). Binary fractions are still expected to be significant (% in many studies) in intermediate age clusters (1-2 Gyr), so some degree of binary interaction could be expected, but may be minimal. We acknowledge that binary interaction has a potentially strong effects, but do not model it in this work.
Along these lines, D’Antona et al. (2017) have suggested that braking due to binary interaction may contribute to the rotation rate evolution of cluster stars and result in populations of fast and slow rotators. Therefore, this mechanism could be part of the physical explanation not only for eMSTO spreads, but also for the observed split MS in younger star clusters. The split MS shows up in a CMD as a blue/redward bifurcation of the main sequence. It is now widely thought to be due to a bimodal distribution of stellar rotation rates (see e.g., Milone et al. (2018) for examples). Marino et al. (2018b) found first spectroscopic evidence for the split MS hosting slow and fast rotators in the redward and blueward portions of the split MS, respectively, for the young globular cluster NGC 1818. This feature does not appear to be due to metallicity variations, nor photometric errors, and has a numerically dominant population in the redward MS (around 60-70% of the split MS stars), which are the proposed fast rotators (Milone et al. 2016, 2017). Star clusters younger than about 600 Myr (Milone et al. 2018) appear to host a split MS, in addition to their eMSTO. In our cluster sample, NGC 1866 is one such cluster. Our analysis of its split MS is highlighted in later sections. Whether or not the binary braking scenario of D’Antona et al. (2017) causes this is uncertain at this point, rotation distributions in the split MS may reflect the initial distribution that stars are born with instead.
Until now, a quantitative assessment of the CMD morphology with flexible stellar models has been missing, and we aim to provide this here. Previous studies have variously used stellar models that are non-rotating, e.g., PARSEC (Bressan et al. 2012), with rotation often modeled according to either GENEC (Ekström et al. 2012), or MESA (Paxton et al. 2013). PARSEC has traditionally been a non-rotating model set (though see Costa et al. 2019b), while GENEC provides a dense grid of stellar rotation rates, but is limited in stellar mass to and above, and a relatively coarse metallicity sampling. GENEC has been the workhorse model set in these studies for including the effects of stellar rotation, and has done much to form our current understanding. We have extended MIST to now include a dense grid of rotation rates. Meanwhile, in comparison to GENEC, our new MIST model set also includes masses ranging down to , and finer metallicity sampling. These new rotating stellar models can now investigate the effects of stellar rotation in older clusters than previous studies. We form synthetic stellar populations that can span a range of ages, metallicities, and stellar rotation rates. In our analysis, we opt for a non-parametric rotation rate distribution whose predictions are presented in our results.
We explore the two main scenarios proposed to explain the eMSTO: eSF and stellar rotation. To this end, we build synthetic stellar populations according to three scenarios: 1) populations that experienced eSF, or 2) experienced no eSF but could have stars at a range of rotational velocities, and 3) a cluster that experienced both eSF and has stars at a range of rotational velocities. We fit these synthetic populations to observations of the clusters NGC 1866, 1831, 2818, 2249, and 2203 and determine the best fit model populations, thereby deriving cluster properties like age, age spread, and the presence of rotation distributions. In Section 2, we present the sources for our data and give brief descriptions of each cluster. Section 3 provides details of our models, lays out our fitting procedure, and presents mock tests of the methods. Section 4 gives our results, sequentially for each scenario along with brief commentary. Finally, our conclusions are summarized in Section 5, along with some discussion of caveats and suggestions for future work. The photometric zero point is Vega for all magnitudes shown.
| Cluster | 11Distance modulus | Age [Gyr] | [Fe/H]22Based on Asplund et al. (2009) protosolar abundances | Binary % | |
|---|---|---|---|---|---|
| NGC 2203 | 18.37 | 1.55 | -0.30 | 0.16 | 18 |
| NGC 2249 | 18.20 | 1.0 | -0.46 | 0.07 | 30 |
| NGC 2818 | 12.76 | 0.7 | 0.0 | 0.90 | 29 |
| NGC 1831 | 18.35 | 0.7 | -0.25 | 0.14 | 20 |
| NGC 1866 | 18.31 | 0.2 | -0.36 | 0.34 | 25 |
Note. — All parameters listed are fixed in our fits, except the age. Age initialized at the listed value but is allowed to vary. See the text for the literature sources to these values.
2. Data
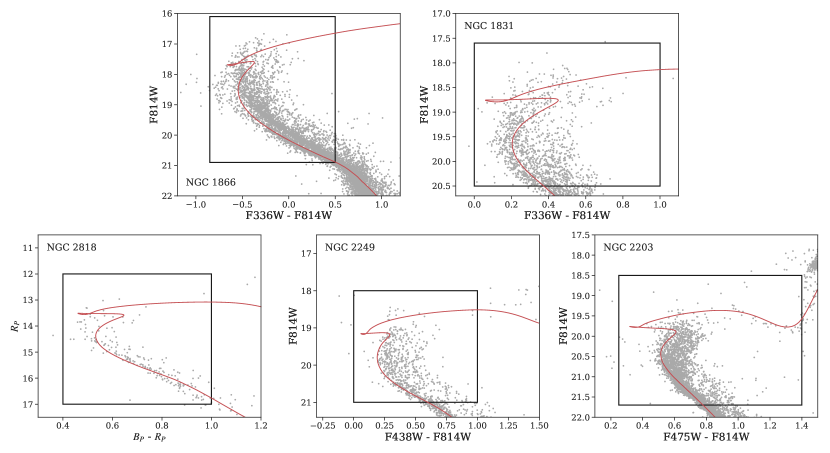
Our data comes from HST observations and the recent Gaia DR2. Our target clusters are NGC 2203, 2249, 1831, and 1866, located in the LMC, and NGC 2818, located in the Milky Way. We chose this set of clusters because they cover a good portion of the age range where eMSTOs are observed, i.e., younger than about 1.5 Gyr. As discussed in Section 3, our models are limited to , and so we cannot model clusters younger than about 200 Myr currently. For each cluster, we list the values of mean log age, distance modulus, binary fraction, , and metallicity [Fe/H]; the mean log age listed here serves to inform the initial position of our parameter search in age during our fits, while we keep all other parameters fixed. The adopted parameters are collected in Table 1. CMDs produced by the data are shown in Figure 1, where black, dashed boxes show the regions we fit models to (focusing on the MSTO, ignoring the red clump, or RC). It is known that some models can have trouble simultaneously fitting the RC and MSTO (e.g., see Bastian et al. 2018) and this is the reason we exclude it in our fits. Red isochrones are also plotted, showing the SSP expected by the adopted cluster parameters, which are listed in the following subsections.
2.1. NGC 2203
The intermediate age cluster NGC 2203, located in the LMC is the oldest of our target clusters according to the literature, at about 1.55 Gyr (Goudfrooij et al. 2014; Rosenfield et al. 2017). Photometry for this cluster is the same as that used in Rosenfield et al. (2017), where the data reduction process is also described. In brief, this data is part of a larger set that was re-reduced from two HST programs: GO-9891 (PI: Gilmore) and GO-12257 (PI: Girardi). So, this photometry comes from archival ACS and WFC3 data, re-reduced with the University of Washington data reduction pipeline, designed to reduce the HST treasury programs ANGST (Dalcanton et al. 2009) and PHAT (Dalcanton et al. 2012); see Williams et al. (2014) for further details. ASteCA (Perren et al. 2015) was used to determine the cluster center, found via the maximum spatial density using a 2D Gaussian kernel density estimator. The cluster radius corresponds to where the radial density profile becomes indistinguishable from the background stellar density. ASteCA was also used to determine contamination, utilizing a non-parametric Bayesian decontamination algorithm based on the method of Cabrera-Cano & Alfaro (1990). The final membership was limited to stars within the cluster radius with membership probability.
We adopt the cluster parameters cited in Goudfrooij et al. (2014), i.e., their age, [Fe/H], , and distance estimated via best-fit isochrones from the Padova group (Marigo et al. 2008). Respectively, these are values of 1.55 Gyr, -0.30, 0.16 dex, and 18.37. We also adopt the binary fraction of 0.18 used by Goudfrooij et al. (2014). Taking into account that slight differences in fits to CMD features can arise due to different input physics between our MIST and those Padova models. Although, see that in Figure 1 that these parameters still provide a reasonable fit with our models.
2.2. NGC 2249
On the boundary of the intermediate age regime, NGC 2249 is a star cluster also located in the LMC. Membership for this cluster was determined in an identical way to what was described for NGC 2203. Isochrone analysis in Correnti et al. (2014) has estimated the cluster to be about 1 Gyr old. Data reduction for this cluster is the same as described for NGC 2203, with further details in Rosenfield et al. (2017). In this work, we adopt the same mean age, [Fe/H], , and distance modulus for NGC 2249 as cited by Correnti et al. (2014); namely, 1 Gyr, -0.46, 0.07 dex, and 18.2 mag, respectively. We adopt the binary fraction of 0.30 cited by Correnti et al. (2014).
2.3. NGC 2818
NGC 2818 enters the regime of young cluster ages for our target clusters, at about 700 Myr, and it is located in the Milky Way. Our NGC 2818 data is taken from the publicly available data gathered by Bastian et al. (2018), originating from Gaia DR2 (Gaia Collaboration et al. 2016, 2018). Details of the member selection for this cluster are given in Bastian et al. (2018), but briefly, members were selected via proper motion and parallax cuts. NGC 2818 is one example of a number of young Galactic clusters with eMSTOs that have been revealed with Gaia DR2 data in the last year or so, thanks to Gaia’s enhanced photometric precision. The adopted cluster parameters are based on values used in Bastian et al. (2018): with an age of 700 Myr, a solar [Fe/H] of 0.0, , distance modulus of 12.76. We adopt a binary fraction of 0.29 from Cordoni et al. (2018).
2.4. NGC 1831
NGC 1831 is also an approximately 700 Myr old cluster as well, located in the LMC. For this cluster, we carried out PSF photometry on the flat-field corrected, and bias-subtracted HST ‘flc’ images (Program ID: GO-14688) using the WFC3 module of DOLPHOT, a modified version of HSTphot (Dolphin 2000) and following the procedure described in Balbinot et al. (2009). For our analysis, and for the CMD shown in Figure 1, we chose stars within a half-light radius (from McLaughlin & van der Marel 2005), of the cluster’s center. We have adopted the parameters based on those used by Goudfrooij et al. (2018) for NGC 1831, determined from PARSEC isochrones. Thus, an age of 700 Myr, [Fe/H] of -0.25, of 0.14, distance modulus of 18.35, and a binary fraction of 0.20.
2.5. NGC 1866
NGC 1866 is the youngest cluster in this study, at about 200 Myr old, and it is located in the LMC. This photometry was obtained in the same manner as described for NGC 1831 (except from HST Program ID: GO-14204). Here we have taken stars within the half-light radius of the cluster’s center, based on McLaughlin & van der Marel (2005). Our adopted cluster parameters for NGC 1866 are adopted from Milone et al. (2017) for the metallicity and binary fraction. These parameters are an age of 200 Myr, [Fe/H]=-0.36, , a distance modulus of 18.31, and a binary fraction of 0.25.
3. Methodology
Major aspects of our models are identical to those described in Gossage et al. (2018), but topical details are recapitulated, and additions are noted here. The greatest difference in our current models and those described in the aforementioned paper is the inclusion of higher rotation rates. Our mass range has changed and is from , with metallicities from [Fe/H] = to in dex steps. This mass range extends lower than what is available in SYCLIST (Georgy et al. 2014, a stellar population synthesis tool, and stellar isochrone and track database). The SYCLIST isochrones and tracks are (similar to how MIST models are based on MESA) based on the GENEC stellar evolution code whose lowest stellar mass is . SYCLIST has been the primary model set used to study stellar rotation in these clusters so far. As our new models extend to 0.1 , we can model older clusters than SYCLIST has traditionally been able to, however, with the caveat that magnetic braking is crudely accounted for in these lower mass stars (more on this in Section 3.1). We do not evolve binary systems, or investigate the effects of mass transfer, nor tidal braking in our model set. Our models also allow for a finer metallcity range than GENEC does publicly, which offers Z = 0.014, 0.006, and 0.002 (roughly [Fe/H] = 0.0, -0.35, and -0.85).
3.1. Stellar Population Models
The starting point for our models is the MESA stellar evolution code (Paxton et al. 2011, 2013, 2015, 2018, 2019), version r7503, which is a modular and open source 1D stellar evolution code. We closely followed the physics used for the MIST database (Choi et al. 2016), adopting the protosolar abundances of Asplund et al. (2009) and using boundary conditions from ATLAS12, while SYNTHE is used for bolometric corrections (Kurucz 1970, 1993). Our models are evolved to the end of core helium burning. Hereafter, we will refer to our models as “MIST models” or “MIST-based”.
The MIST models are set rotating at the zero age MS (ZAMS) with a given velocity denoted by the ratio of equatorial angular velocity at ZAMS, over the critical . The critical velocity is a property intrinsic to the star that depends on its mass (see e.g., Maeder 2009); it represents the limit where centrifugal force overcomes the star’s gravity. The ratio is equivalent to the linear velocity form in the MESA formalism. Previously, our models were limited to in Gossage et al. (2018); we now include models ranging up to , in steps of . The initial MIST models released by Choi et al. (2016) only included non-rotating and models.
MIST models rotation under the shellular approximation developed by Kippenhahn & Thomas (1970), with chemical and angular momentum transport described by the equations of diffusion equations of Endal & Sofia (1978). This diffusive formalism is also adopted in the stellar evolution codes STERN (Brott et al. 2011) and the recent version of PARSEC (Costa et al. 2019b). The shellular approximation is standard in 1D stellar evolution codes. The treatment of angular momentum and chemical transport varies between codes. For instance, GENEC uses a diffusive-advective formalism, described in Zahn (1992); Maeder & Zahn (1998); Maeder & Meynet (2000). The differences in these two formalisms have significant effects on the models, e.g., leading to different MS lifetime extensions (by up to 20% or so) and color-magnitude variations (see Choi et al. 2016; Gossage et al. 2018 for examples). Our models possess a stronger convective mixing with weaker rotation mixing, whereas GENEC features the opposite. Consequently, our rotating models are primarily affected by the structural changes of gravity darkening when they rotate, they don’t see a dramatic MS lifetime extension or luminosity enhancement from rotational mixing, as is seen in the GENEC models.
Gravity darkening is handled by the equations of Espinosa Lara & Rieutord (2011) (recently adopted by Paxton et al. (2019) in MESA as well) in determining the (surface averaged) luminosity and temperature of a given stellar model at viewing angle . The viewing angle corresponds to when viewing is equator-on, versus when viewing pole-on. Gravity darkening is the effect of centrifugal force reducing the surface gravity of a rotating star. This effect is stronger at the equator than at the poles, due to the greater centrifugal force at the equator. Thus, gravity darkening causes the equator of a rotating star to become cooler and dimmer than the poles, introducing a viewing angle dependence on the apparent magnitude and color of a rotating star. The effects can be substantial; examples for our models exist in Gossage et al. (2018). The formalism that we adopt from Espinosa Lara & Rieutord (2011) is similar to the gravity darkening formalism used for the GENEC-based SYCLIST stellar population models.
Another important aspect of rotation, at least for masses is magnetic braking. Modeling this process is an active area of research (e.g., Garraffo et al. 2016; Sadeghi Ardestani et al. 2017; Garraffo et al. 2018; Fuller et al. 2019). Niederhofer et al. (2015) predicted the (Age)-age trend should stop after magnetic braking becomes effective. This limit is expected to be reached by TO stars in clusters with ages older than about 1.5 Gyr, depending on the metallicity. In their recent work, Georgy et al. (2019) used models developed with the STAREVOL code (Amard et al. 2016), for masses between 1 and 2 , including a prescription for magnetic braking according to Matt et al. (2015). This mass range is roughly where surface convection zones develop, leading to surface magnetic fields that can act on extended stellar material, braking the star. We take a crude approach to simulate this, in absence of a proper model of the effects of magnetic braking. Below , models are forced to be non-rotating; from models have scaled up to the full value. The SYCLIST models do not model magnetic braking, but also exclude stellar masses below (Georgy et al. 2014). The MSTOs of NGC 2203 and 2249 have TO masses that are low enough for magnetic braking to become important, so our results for these clusters in particular will be affected by uncertainties due to magnetic braking.
From our MIST-based stellar models, we compute synthetic stellar populations, as in Gossage et al. (2018), using the code MATCH (Dolphin, 2002). Specifically, we use MATCH to compute Hess diagrams of CMDs, including unresolved binaries, at fixed values of Z, age, and . Photometric errors are simulated with MATCH via artificial star tests. The populations are created at distinct ages, covering log Age = 8.0 to 9.5 (in 0.02 dex steps), each of which is also created at , up to 0.9. Our synthetic populations include the effect of gravity darkening via randomly drawn viewing angles for constituent stars. Stellar models are drawn according to a Kroupa (2001) initial mass function (IMF). We combine these synthetic populations (weighting them as described below in Section 3.2) to form a composite stellar population that may possess stars from a range of ages and rotation rates.
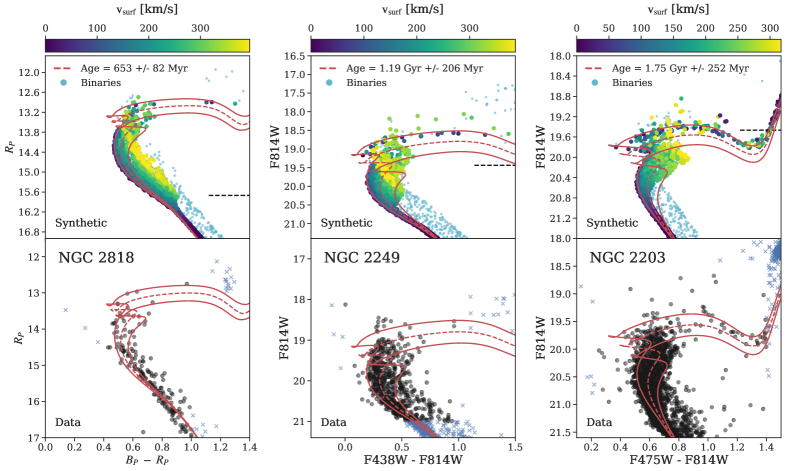
Colored points in the top row of Figure 2 shows several examples of these models. In this figure, models have fixed age pertaining to the representative cluster, from left to right: NGC 2818, 2249, and 2203. The colors map the full range of rotation rates (i.e., to ), according to a flat distribution of , to clearly show the full effects of stellar rotation on the MSTO in these clusters. Red lines show non-rotating MIST-based isochrones, dashed at the mean age, and solid at (age). This (Age) was chosen so that the isochrones roughly covered the full extent of the eMSTO. The bottom row of panels shows the same non-rotating isochrones overlaid on the data of NGC 2818, 2249, and 2203. Broadly, both stellar rotation and a range of ages can cover the extent of the eMSTO, but in different ways, hence the contention between the theories.
Figure 2 shows how increasing age reddens and decreases the luminosity of TO stars in a similar manner to the effects of gravity darkening. The effects of stellar rotation manifest in a confined region of CMD space at a given age, in comparison to an age spread which can modify the luminosity and temperatures of stars over as wide a space as is useful for covering the eMSTO. In this sense, the effects of an age spread have relatively more freedom than the effects of a rotation rate distribution. MATCH was used to generate the models displayed in the top row, but the code currently lacks the ability to perform a straightforward fit for rotation rate distributions. We opted for a separate fitting method outside of what is provided by MATCH (outlined below in Section 3.2) to handle this.
3.2. Fitting to Data
We build composite stellar populations according to three scenarios (below “weights” measure the total number of stars in a Hess diagram whose stars may be observations or simulations):
-
1.
Gaussian log(Age) spread (-model): This has a Gaussian SFH. More complex SFH are imaginable, but would expand parameter space further, and so are omitted for now. Here is restricted to 0.0 (non-rotating). This model has three parameters describing the overall weight, or number of stars in the composite population (i.e., amplitude), plus the Gaussian log(Age) distribution’s mean and standard deviation.
-
2.
Non-parametric rotation rate distribution (-model): This model considers 10 free weights ranging from 0 to the total weight of observed stars. Each free weight corresponds to one of the 10 possible populations. All stars are assumed to have a single age, in this model, which is also fit as an 11th free parameter.
-
3.
Age spread with rotation (-model): This model combines the - and -models. A Gaussian age distribution is allowed (mean age and standard deviation are free parameters), as are the 10 free weights for a non-parametric rotation distribution, giving a total of 12 parameters. Like the -model, the age distribution here is in terms of log(Age).
We measure the probability of models matching the data using Hess diagrams and a Poisson likelihood as described in Dolphin (2002). Our fitting considers up to 10 independent weights for the density of stars at our 10 values of , plus up to two more parameters describing the Gaussian age distribution’s mean and standard deviation. We take this standard deviation of the Gaussian age distribution to represent the “age spread”. So, given a derived mean log age , we take the age spread to be , with being the standard deviation. We use Markov chain Monte Carlo (MCMC) to sample the probability distributions, determining the most likely parameter values for rotation rate weights, mean ages, and age spreads. We employ emcee’s affine- invariant ensemble sampling algorithm (Foreman-Mackey et al. 2013). To initialize our ensemble of walkers, we chose randomized positions from a uniform distribution within dex of the chosen mean log age for a cluster, and within dex of the arbitrarily chosen initial age spread of log age = 0.05, if applicable. In initializing the walker positions for the various weights was done using a Dirichlet distribution. The reasoning behind this choice being that we desired these random initial positions to lie within the solution plane, such that all rotation rate weights add up to the total combined weight of all bins for the data. In other words, we set these positions in a way that preserves a cluster’s total number of stars, rather than initializing in an invalid portion of parameter space where the total counts is far off from that of the data. Thus, our model for rotation distributions is a non-parametric model consisting of 10 free parameters; our eSF model is a Gaussian model described by its mean and standard deviation.
3.3. Mock Tests
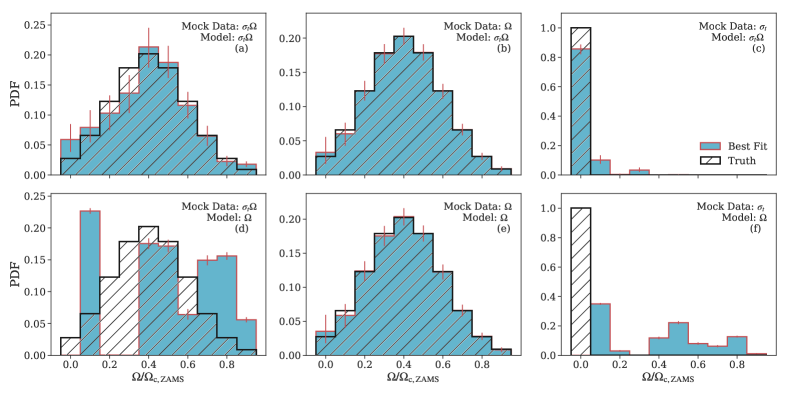
Here we present the results of mock tests examining accuracy in parameter recovery. These tests were carried out for our three scenarios of eMSTO presence under consideration: population age spread (- model), stellar rotation distribution (-model), or both (-model). We generated mock data according to each of these scenarios using MATCH and applied our models to check that the input age and relative weights of populations at various were recovered. The mock data is generated with a mean log age 9.0 in all cases, metallicity of [Fe/H] = -0.40, , akin to NGC 2249, as determined in Correnti et al. (2014). We generate mock data according to each scenario, and the log(age [yr]) spread is , while the input rotation distribution is a Gaussian centered at with a standard deviation of dex in applicable cases.
The recovered weights shown in Figure 3 find values near the inputs (black, hatched), and the truth is contained within errors in most cases, except the two shown in the bottom-left and -right panels (d) and (f). These two cases correspond to fitting the -model to mock data created with either the - in panel (d), or -model in panel (f). In both of these cases, the model forms roughly a bimodal distribution of rotation rates; both of these cases are the -model fit to mock data containing an age spread. Thus, we expect that our -model sees an age spread as a bimodal distribution of rotation rates. The reason for this is that fast rotators can enhance the eMSTO spread with more dramatic gravity darkening effects, as shown in e.g., Bastian & de Mink (2009), Brandt & Huang (2015), and Gossage et al. (2018). Additionally, our MIST-based rotating models mostly become redder as rises, populating a reddened MSTO, allowing a greater TO spread but leaving behind a de-populated blue MSTO. Low rotation rates refill the bluer side of the MS when added to the full ensemble of stars. The bimodal nature of rotation seems to arise from fast rotators being used in an effort to fit the eMSTO spread, leaving a de-populated blue MSTO, alongside slow rotators counteracting this offset and populating the red MSTO. So, the properties of fast and slow rotators appear to drive our models to favor the presence of both in explaining an age spread, or otherwise broad MSTO. Unless the underlying rotation distribution in the data is something specific, like a Gaussian, we expect to see a bimodal distribution arise in order to model the width of the eMSTO. This is shown in panel (e) for -model fit to itself when the input rotation distribution is a Gaussian. The full model (i.e., the -model) is capable of recovering the input rotation rate distribution in all cases, as may be seen in panels (a), (b), (c). The additional degrees of freedom allowed by the Gaussian age spread in the -model removes the necessity for a bimodal rotation rate distribution.
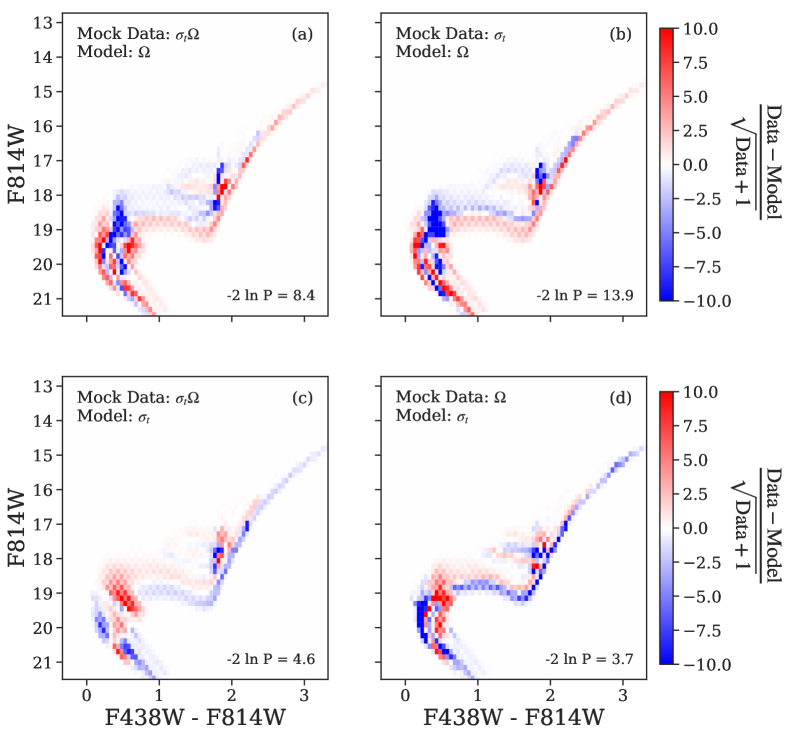
Figure 4 shows residuals for our mock tests, again omitting 1:1 comparisons and only showing cases where the comparisons produced interesting residuals. In panel (b) of Figure 4, one may see that the -model does not match the smooth variation of stellar densities created by a Gaussian age spread (as in the -model). It does better matching the -mock, seen in panel (a) of Figure 4, (i.e. it acquires a higher likelihood), but similarly misses the continuous morphology of a Gaussian age spread; the placement of rotating models on the CMD imposes a combination of relatively specific morphologies, discretized according to a corresponding rotation rate. Thus, there is a low chance that each of these morphologies matches the more ambiguous morphology of a Gaussian age spread, creating distinct features in the residuals and relatively poor fits when the two try to match each other. Finally, the bottom row of Figure 4 shows the -model fit to the -model in panel (c) and to the -model in panel (d). The -model is generally capable of achieving higher likelihoods than the -model shown in the top row, but it still has difficulty reproducing the densities of stars at non-zero rotation rates, leading to the features shown in the residuals. This indicates that the -model possesses enough ambiguity to smooth out inconsistencies and produce a higher fit statistic with disregard to the presence of a distribution of rotation rates. In comparing panels (a) and (c), it is noticeable that the sub-giant branch (SGB) of the - mock data is better matched by the -model.
4. Results
We provide results in this section. Section 4.1 provides a description of the derived rotation rate and ages distributions. Section 4.2 presents the residuals between our best-fit models and data. Section 4.3 discusses our resulting (Age)-age trend with comparison to previous studies.
4.1. The Age and Distributions
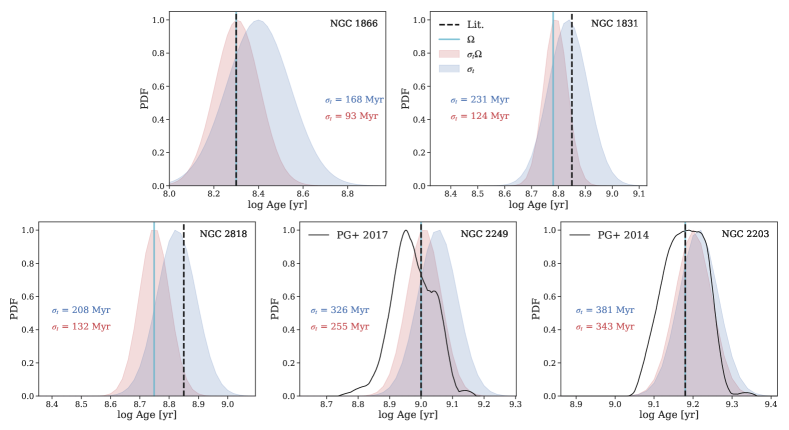
Derived Gaussian age distributions for the - (blue shaded region) and -models are shown in Figure 5, with the best-fit age of the -model as a solid cyan line. Black dashed lines show the literature ages described in Section 2. For NGC 2203 and 2249, black solid curves indicate the “pseudo-age” distributions determined by Goudfrooij et al. (2014) and Goudfrooij et al. (2017), respectively. It is also mentioned in those works that the pseudo-age distributions are broader than what photometric errors allow, and so are not spurious in that manner.
Briefly, the pseudo-age distribution is one method of determining the age spread on the eMSTO. It is created with a parallelogram that encloses the width of the eMSTO. The colors and magnitudes of stars within this parallelogram are translated into an age distribution. This is done by taking the ages predicted by stellar models of these stars. Like our Gaussian age distributions shown in Figure 5, the pseudo-age is not reflective of the SF history of the cluster on its own (Goudfrooij et al. 2014), but rather emulates the distribution of ages that may be present in the eMSTO at the time of observation.
In comparison to our derived age distributions, the pseudo-age distributions have multiple peaks, with the strongest amplitude at younger ages than we find. This may be due to the different models used (Padova in Goudfrooij et al. 2014 and SYCLIST in Goudfrooij et al. (2017), while ours are MIST-based). Additionally, it could be due to our age spread model only allowing a single peak, causing it to compromise for a peak in between the multiple peaks found by Goudfrooij et al. (2014, 2017). In spite of these offsets in mean age, the widths of the pseudo-age and Gaussian age distributions are comparable, suggesting that both methods predict similar age spreads.
However, a common trend seen with all clusters is that the -model predicts a smaller age spread. This is expected, as stellar rotation also contributes to the eMSTO morphology with this model. Gravity darkening can introduce substantial color variations and eMSTO width, as demonstrated in Figure 2. Furthermore, it may be seen that the inclusion of stellar rotation tends to reduce the predicted mean age.
Due to the reddening effect of gravity darkening, it is also expected that stellar rotation would reduce the mean age. Age is primarily determined by the CMD position of the MSTO, which is fixed by the data. As stellar rotation tends to redden stellar models, selecting a younger age counteracts this effect by making the rotating stars blue again. Hence, stellar rotation is seen to derive a younger age than non-rotating models (the -model) in Figure 5. The ages found by the - and - models are either similar or coincide.
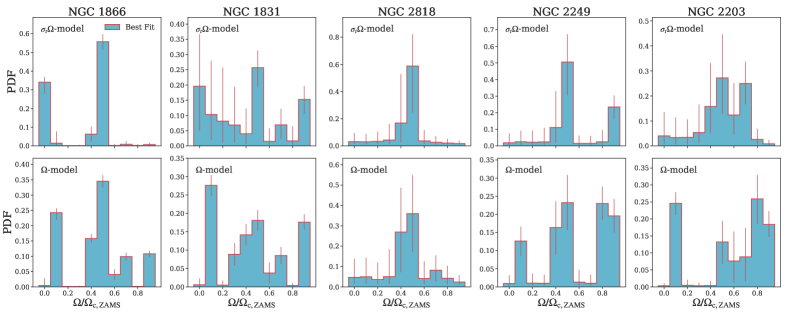
Although the - and -model agree on cluster ages, the derived distributions shown in Figure 6 highlight where these scenarios disagree. The top row shows the distributions found by the -model, while results for the -model are on the bottom row. In all cases, the -model finds a more distinct population of fast (e.g., ) and slow rotators (). In contrast, the -model generally finds a smaller presence, or lack of slow rotators.
The -model’s rotation rate distributions agree with observations more than the -model in this context. They qualitatively reproduce the observed fast and slow rotators found by e.g., Dupree et al. (2017); Bastian et al. (2018). In the observations, slow rotators reside blueward, while fast rotators lie redward. The stellar models capture this behavior as well, as seen in Figure 2; gravity darkening tends to redden fast rotators, causing the two populations to occupy distinct color spaces in the CMD. The two populations are necessary in the stellar rotation scenario so that the full blue to redward extent of the eMSTO is reproduced.
The two populations are not required in the -model. The Gaussian age spread can compensate for a lack of slow rotators. This does lead to a clear lack of slow rotators in NGC 2203 and 2249 (the oldest clusters). For these clusters, the predicted lack of slow rotators is not in line with recent findings for younger clusters.
4.2. Residuals
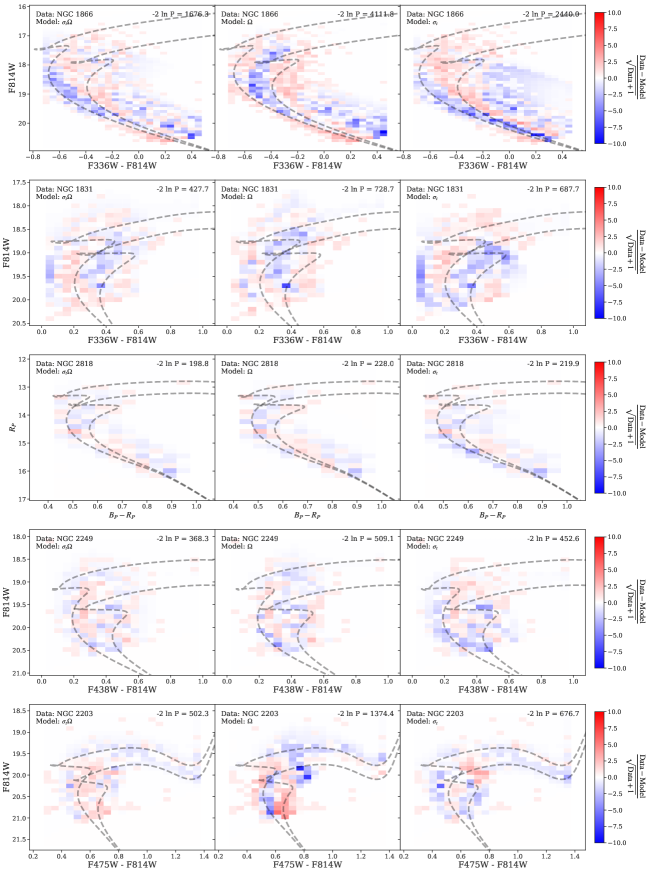
Figure 7 shows the residuals of the data compared to the best-fit models for the - (left column), -
(middle), and -model (right). Dashed black lines show non-rotating MIST isochrones placed to trace the eMSTO width (similar to the isochrones in Figure 2). Each row corresponds to a cluster, and the global likelihoods (-2lnP) are kept in the upper right corner of each panel. While the -model may not reproduce the rotation rate distributions one might expect, it is the best-fit model overall, considering the global likelihoods.
In NGC 2249, 2818, and 1831, the likelihoods of all three scenarios are comparable, and the best matched clusters on the basis of the residuals. Meanwhile, NGC 2203 and 1866 (the oldest and youngest clusters) are the worst matched. In the latter two cases, performance between the three scenarios is more disparate. The -model formally achieves he best-fit with all clusters (perhaps unsurprisingly given more free parameters), but clearly so with these two clusters in particular. None of the residuals are clean, showing that all scenarios produce imperfect fits, although in different ways.
Inclusion of an age spread does tend to deliver a higher likelihood. At the same time, the residuals show that the - and -models often create eMSTOs that are broader than the data. This is seen both by pixels over fit by these models tend to lie outside of the bounding isochrones that roughly trace the eMSTO. The -model tends to over predict within the isochrones, without the extended behavior of the Gaussian age spread models.
The -model can find comparable likelihoods to the age spread models, but also finds mismatches. In fact, it is formally the worst fit in all cases. Yet, it does appear to match the eMSTO extent well qualitatively, suggesting that it fails moreso in getting the precise stellar densities correct. In other words, the -model appears to reproduce the data morphologically, though it does not show a strong statistical advantage over the other two models.
4.3. The (Age)-Age Trend
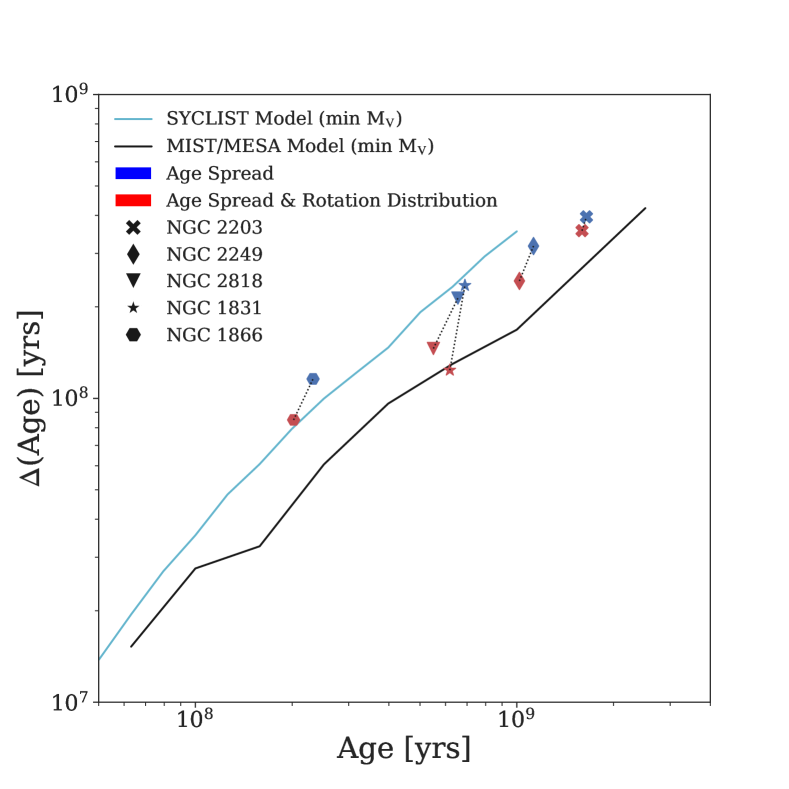
The (Age)-age trend, such as the one derived here and shown in Figure 8, has been a central point in eMSTO studies such as Niederhofer et al. (2015). The points in Figure 8 mark age spreads and ages found by the - (blue) and -models (the latter in red). For a series of ages, Niederhofer et al. (2015) determined the effective (Age) that a non-rotating GENEC-based, SYCLIST isochrone would need in order to match a isochrone. They selected distinct points on each isochrone, and determined how much the non-rotating isochrone’s age needed to shift from its original value in order to match the CMD position of the rotating isohrone. Remarkably, they found a (Age)-age trend that agreed with measured eMSTO widths from a range of studies. The lines in Figure 8 show such model predicted trends. These (Age)-age trends imply that the effect of stellar rotation can mimic an age spread.
The magenta line in Figure 8 is the trend formed by their second isochrone point, “ at MSTO”. We performed the same analysis to see what the MIST models predict, and this trend is shown as the solid black line. The MIST models produce a shallower trend. In Gossage et al. (2018), we found that MIST models predict a smaller apparent age spread as a result of rotation when compared to SYCLIST, due to our weaker rotational mixing. This causes the luminosities of our rotating and non-rotating isochrones to separate less than SYCLIST models, leading to a smaller effective “age spread”. We also found that gravity darkening appeared to be the strongest effect of stellar rotation in the MIST models.
The black and magenta lines in Figure 8 do not show the inclination angle dependence of rotationally induced eMSTO width. These lines were measured with the luminosity and temperature of the stellar models averaged over all inclination angles. Thus, this trend does vary slightly depending on the chosen inclination angle, but it remains that on average the MIST models predict a shallower trend than SYCLIST when measuring the eMSTO spread with this isochrone-based method. In a synthetic population (as opposed to single isochrones), the combined effects of a distribution of rotation rates and inclination angles allow the rotating MIST models to achieve comparable eMSTO widths to the observed (Age)-age trends.
In the derived ages and age spreads of the - and -models, we see that the inclusion of stellar rotation does not reduce the age spread to zero. The age spreads derived by the -model are smaller than those found by the -model. This is expected, as stellar rotation and age spread compete to explain the eMSTO morphology in the -model. The fact that the -model’s age spreads still correlate with cluster age suggests that they trace a stellar evolution effect, rather than SF. The fact that the -model finds a reduced, but non-zero age spread may be indicative of missing physics in the rotating models, compensated for by an age spread.
4.4. The Split MS of NGC 1866
NGC 1866 has a split MS, in addition to its eMSTO, that warrants further analysis. This additional complexity may contribute to the relatively poor fit achieved for NGC 1866 (Figure 7). The split MS has been argued to imply that star clusters host both eSF and a distribution of rotation rates. The fact that the -model achieves the best-fit here, and the -model the worst, serves to demonstrate how eSF may be compensating for an incomplete modeling of stellar evolutionary effects (e.g., binary mergers and decretion disks). In spite of the lower statistical likelihood of the -model (Figure 7), we find that a coeval distribution of rotation rates is capable of reproducing the split MS and the eMSTO simultaneously, albeit with caveats.
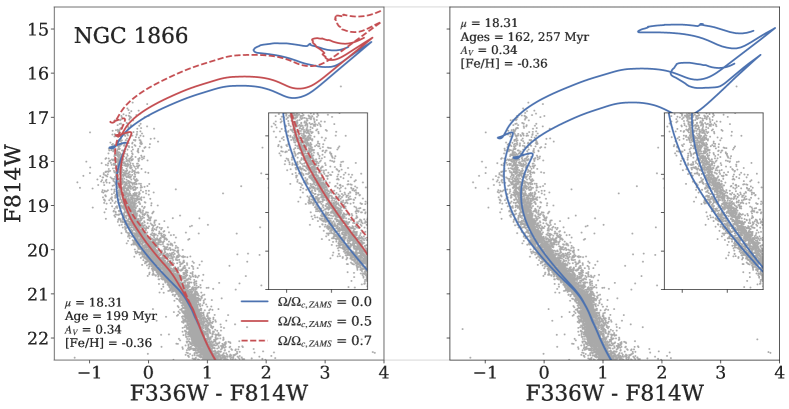
Schematically highlighted in Figure 9 is the debate between whether the split MS is due to a rotation rate distribution, or whether eSF may be present. Figure 9 displays content similar to Figure 10 from Milone et al. (2017). A range of ages clearly does not reproduce the split MS (right panel). As also noted by Milone et al. (2017, 2018), modeling the split MS appears to require fast and slow rotators in the cluster. This is shown for the simple case of a non-rotating and isochrone ( is included as well to show how they aid in extending the MSTO). The split MS may be driven by bimodal rotation rate distributions, but confirmations still need to be obtained. As plotted here, and as seen in Figure 6, the fast rotators are mainly stars rotating at , in contrast to the predictions of Geneva shown in Milone et al. (2017, 2018) where the red MS appears to be comprised of stars rotating near critical velocity.
The right panel of Figure 9 shows that a range of stellar ages can aid in spanning the bluemost and redmost regions of the eMSTO. This was also shown in the corresponding Figures 10 and 11 of Milone et al. (2017), where isochrones at several rotation rates and multiple ages are plotted together. This is one example of how eSF in models (e.g., ) may optimize a fit to the data, but it is uncertain whether the invoked age spread is physical. As mentioned, there is sparse empirical evidence for eSF, and alternatives are known (although, see recent work by Costa et al. 2019a, finding possible evidence for eSF in NGC 1866 via modeling of its Cepheid stars).
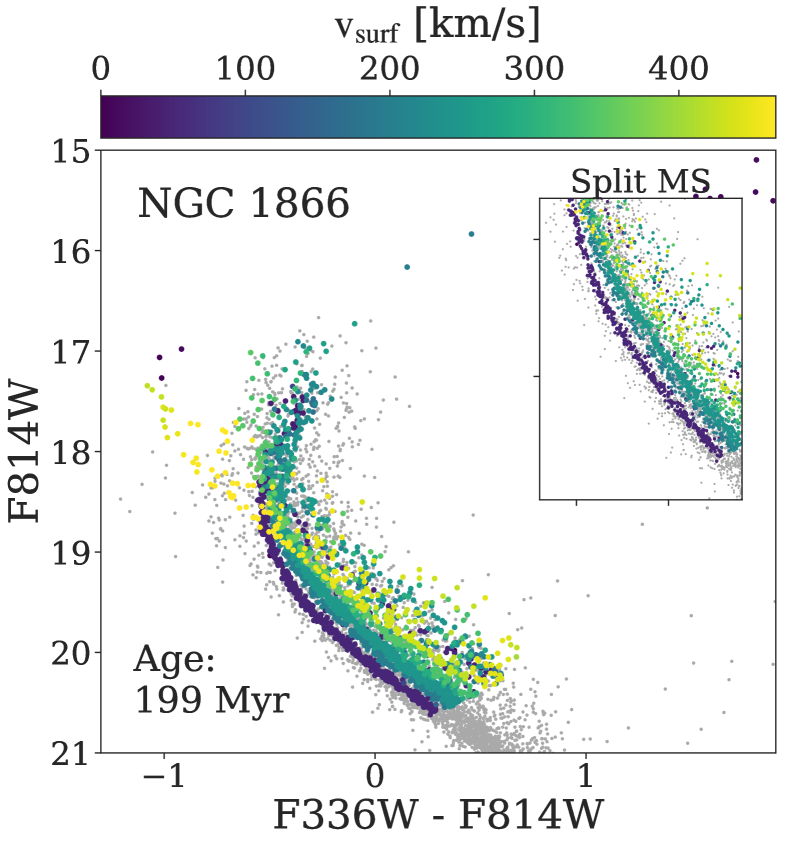
Our best fit -model (which obtains the worst likelihood) for NGC 1866 is shown in Figure 10, with an inset focusing on the split MS. The recovered rotation rate distribution for NGC 1866 is indeed bimodal (for both the - and -model), and the model qualitatively matches the split MS. The eMSTO is matched in some respects, e.g., that it predicts a mixed population of slow and fast rotators, as observed spectroscopically by Dupree et al. (2017). In other areas, a rotation rate distribution is inconsistent with the data as modeled here. Particularly, it misses stars blueward (i.e., about F336W - F814W -0.65 mag) and redward (about F336W - F814W -0.35) in the eMSTO, but these areas of the CMD are known to be affected by complex stellar evolution effects, e.g., interacting binaries and Be stars, respectively.
For instance, our models do not include properties such as decretion disks, nor binary merger products. The population of fast rotators extending blueward may not reproduce the findings of Dupree et al. (2017), and could be a spurious result. Increasing the binary fraction to 50% and removing the possible “blue stragglers” does not influence the presence of these near critical rotators in the best fit; so, their presence appears to aid in matching stellar densities along the MS, rather than the eMSTO, with these near critical rotators extending blueward of the TO as a possible side effect. On the matter of reddened, fast rotators, Bastian et al. (2017) found evidence of a high number of H emitters (suspected Be stars) throughout the eMSTOs of these young clusters. A number of which lie in this redward region. Though, Correnti et al. (2017) examined whether H emitters account for the redward extension of the MSTO in the young cluster NGC 1850; they found that H emitters could not in NGC 1850, in comparing their data with SYCLIST stellar models. See the modeling done by Granada et al. (2018) for more on Be stars and further examples in young clusters. As for the blueward extent, Li et al. (2019) show some examples of the blue straggler populations that might exist in Magellanic Cloud clusters, but Dalessandro et al. (2019) warn that such stars may also be unaccounted for field contaminants. Presently for our NGC 1866 data, these stars do not reside in the field, and so appear to be cluster members.
Rather than eSF, it is possible that the redmost and bluemost populations of eMSTO stars (where the -model does not reproduce the data well, thus calling to question if this is evidence of eSF) are affected by decretion disks and binary interaction. These features are also missed by the -model in NGC 1831, 2818, and 2249. The -model may compensate for these missing factors by invoking an age spread. We will need to improve our stellar modeling, or obtain further data on what sort of stars these are before we can say for sure.
5. Discussion & Conclusions
In this paper, we have compared the statistical ability of three proposed scenarios to explain the eMSTO morphology: 1) eSF, 2) a rotation rate distribution, and 3) both combined. In analyzing the statistics, we also considered whether the three scenarios could reproduce observed properties of eMSTOs, such as their rotation rate distributions. eSF remains a possibility based on this analysis, but it seems unlikely in our interpretation. The results highlight that a distribution of rotation rates is capable of solely accounting for eMSTO morphology and observed populations of fast and slow rotators in the eMSTO. Additionally, a distribution of rotation rates may simultaneously account for the split MS, and the eMSTO of the roughly 200 Myr cluster NGC 1866, given current uncertainties in stellar modeling. Yet, the - and - models formally achieve the highest likelihoods. Whether or not these age spreads are physical is put into question by our residuals. All three scenarios over/under-predict in different areas. The youngest and oldest clusters (NGC 1866 and 2203) are the worst fit clusters, but these are also the only cases where an age spread appears to significantly outperform the -model. Incidentally, these two cases are both affected by quite uncertain and unaccounted for aspects of stellar rotation: magnetic braking in NGC 2203, and Be stars in NGC 1866. In each case, the - and -model show strong over predictions blue- and redward of the observed eMSTO. This suggests that the Gaussian age spread may optimize the fit in these cases, but create broader eMSTOs than the bulk of the data to do so. In contrast, the -model tends to find mismatches within the observed eMSTO region, while not producing such broad artifacts. It is known that our models are incomplete (e.g., in not modeling certain effects like the decretion disks of very fast rotators and in approximating rotational and convective mixing with a 1D framework). Thus, it seems plausible that a Gaussian age spread is compensating for missing aspects. In this section we discuss caveats, uncertainties, and suggestions for future work.
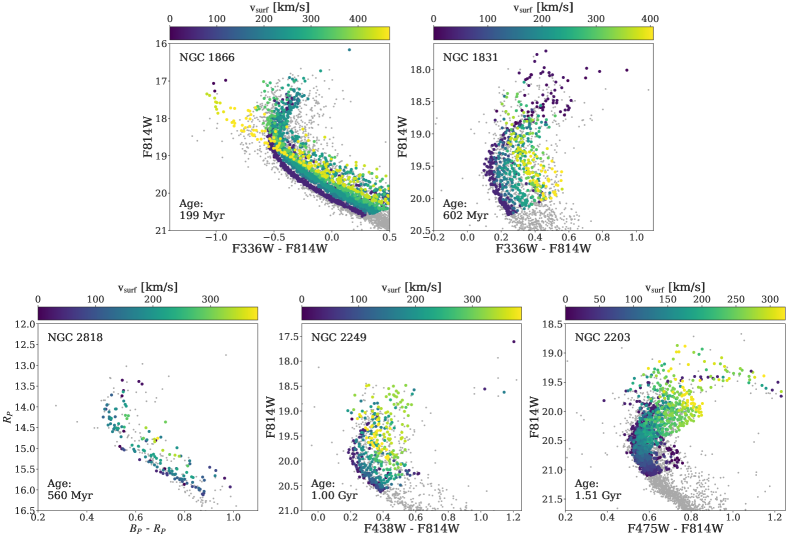
Figure 11 shows the best-fit -models for each cluster. Grey crosses show the data, colored points show the best-fit -models, with colors mapped to the average surface velocity of the stellar models. Visually, the -model provides a good match, but is not perfect. For instance, models miss the redward MSTO of NGC 1866 which could be due to not including decretion disks that can further redden rotating stars (see Section 4.4). It is worth highlighting that NGC 2818 contains a relatively low number of stars, so the model shown in Figure 11 is subject to stochasticity when stars are drawn from the IMF. On multiple draws, the eMSTO of NGC 2818 is visually reproduced more or less well as a result; it can become narrower or broader on subsequent draws. We have chosen a draw that matches the data fairly well. In NGC 2203 and NGC 2249, the redward shelf-like structure roughly at magnitudes of 20 and 19.3 for each cluster, respectively, is only matched by fast rotators (Figures 2 and 11 show this), but is over predicted in each case (see Figure 7) with the -model. It is conceivable that missing physics related to stellar rotation, such as magnetic braking, could lead to model mismatches here.
Additionally, mismatches could come from associated effects, like stellar binary evolution. However, the effect of binary interaction may be minimal (Yang et al. 2011; Li et al. 2016) in intermediate age clusters, in comparison to the effects of rotation or a possible age spread. Though we have included unresolved binaries in our models, we have not incorporated the effects of binary interactions, which could affect rotation rates via tidal forces, or directly impact evolution through mass transfer, possibly producing objects like blue stragglers. Observations of eMSTO stars focused on determining their binary status could help shed light on the importance of these effects.
The origin and termination of rotation rate distributions is currently undetermined. Braking of stellar rotation via various mechanisms may be a source of influence. At the older end of eMSTO hosting star clusters, magnetic braking affects stars with convective envelopes. Such stars have masses or so, and start to arrive on the MSTO near 1 Gyr. Disappearance of the eMSTO appears to occur for clusters older than about 2 Gyr, where stars now possess larger convective envelopes and much stronger magnetic braking, consequently driving all TO stars in these older clusters towards slow rotation rates. E.g., Martocchia et al. (2018) found NGC 1978 to host an MSTO that is consistent with no spread within the observational errors. Although, the age of eMSTO disappearance may be metallicity dependent, as early work by Georgy et al. (2019) appears to suggest. Going towards younger (than about 600 Myr) clusters, such as NGC 1866, the split MS becomes a prominent feature in addition to the eMSTO. The origin of the split MS could be linked to a braking mechanism (as D’Antona et al. 2017, 2018 suggest with tidal braking) that makes fast rotators transition to slow rotators, producing the observed bimodal MS in these young clusters. Just as well, at this point it is unclear if this bimodal distribution is an imprint of the initial velocities that stars may be born with. Neither magnetic braking, nor binary evolution are modeled here, but both appear to be integral in understanding how rotation rate distributions evolve with time in these clusters.
Furthermore, several inconsistencies between the age spread scenario and CMD structure are relevant to whether significant age spreads are physical phenomena (Cabrera-Ziri et al. 2018 gives an overview). Figure 2 shows a broad SGB is expected in intermediate age clusters if eSF is present, while a distribution of rotation rates predicts a narrow SGB (also see Bastian & de Mink 2009). However, models showing a narrow SGB are those of Bastian & de Mink (2009), which lacked interior rotational fuel mixing, and ours, which possess relatively weak rotational mixing. This is in comparison to either an age spread, or models with stronger rotational mixing, as those used in Niederhofer et al. (2015), which may produce a broad SGB at these ages. A broad SGB does not show up clearly in the observations of NGC 2203 or 2249 used here. Li et al. (2014) found age spreads were inconsistent with the SGB of NGC 1631, while Goudfrooij et al. (2015) found that the SGB structure could be consistent with an age spread in some cases. The absence or presence of a broad SGB could be a useful determinant in constraining the physics at hand.
Another important diagnostic could be the RC. The RC (excluded from our fits) should be broadened in intermediate age clusters, generally according to some effect (e.g., rotation rate distributions or an age spread) that can create a spread in stellar mass within a cluster. Girardi (1999) laid out the physics of the extended RC; it requires that a range of stellar masses exists in the cluster, such that some RC stars developed degenerate He cores, while others were massive enough to bypass this. A range of ages is capable of creating this spread in stellar mass (see e.g., Goudfrooij et al. 2014, 2015), although rotating models have not been widely tested as an alternative. We aim to study the eRC according to the stellar rotation scenario in upcoming work. Alongside the eMSTO, studying the SGB and RC structure will inform a more complete picture of the role of stellar rotation, and could reveal missing physical ingredients within the models.
The physical basis of eSF is questioned further by the (Age)-age trend (Figure 8). Goudfrooij et al. (2017) and Milone et al. (2018) found that age spreads combined with a distribution of rotation rates provides a better reproduction of data than the latter acting solely. However, as Bastian et al. (2018) alluded to in their Figure 4, age spreads still appear to correlate with cluster age. This suggests that the age spreads determined in those cases, and here with the -model emanate from a stellar evolution effect, rather than true eSF. In general, the ability of stellar rotation to largely account for eMSTO structure on its own (as shown in Figure 11) may suggest that residual mismatches are signs of imperfect stellar modeling, rather than a true age spread.
In our interpretation, a distribution of rotation rates appears to be the overall most physically motivated explanation for the eMSTO phenomenon. We can not rule out eSF here, as it does aid in creating a better fit to the data. However, the age spread may also be compensating for known missing ingredients in the rotating models, such as braking (tidal or magnetic), Be star disks, effects of binary interaction, and uncertainties in 1D convective mixing. This contention may resolve as stellar models improve. Direct comparison of observed eMSTO with stellar models (such as those in Figure 11) should provide strong constraints on the physics of stellar rotation. There is known uncertainty between the formalisms that are used to simulate stellar rotation. A detailed assessment of MIST- with GENEC-based models should illuminate the consequent range of model behaviors. The SGB and RC, in combination with the eMSTO, may provide an opportunity to study, constrain, and reconcile many complex, and as of now uncertain stellar processes within young clusters.
Acknowledgments
SG acknowledges the National Science Foundation Graduate Research Fellowship under grant No. DGE1745303. CC acknowledges support from the Packard Foundation. This paper is based upon work supported by the National Aeronautics and Space Administration (NASA) under Contract No. NNG16PJ26C issued through the WFIRST Science Investigation Teams Program. Some of this material is based upon work supported by the National Science Foundation under Award No. 1501205. ICZ acknowledges support from NASA through Hubble Fellowship grant HST-HF2-51387.001-A, awarded by the Space Telescope Science Institute (STScI), which is operated by the Association of Universities for Research in Astronomy, Incorporated, for NASA, under contract NAS5-26555. BFW acknowledges support from NASA through grant AR-13901 from STScI under NASA contract NAS5-26555. NB gratefully acknowledges financial support from the European Research Council (ERC-CoG-646928, Multi- Pop). and the Royal Society (University Research Fellowship). We would also like to thank Bill Paxton and the MESA community for making this work possible. The authors also acknowledge Benjamin D. Johnson for helpful insights during the development of our methods.
References
- Amard et al. (2016) Amard, L., Palacios, A., Charbonnel, C., Gallet, F., & Bouvier, J. 2016, A&A, 587, A105
- Asplund et al. (2009) Asplund, M., Grevesse, N., Sauval, A. J., & Scott, P. 2009, ARA&A, 47, 481
- Balbinot et al. (2009) Balbinot, E., Santiago, B. X., Bica, E., & Bonatto, C. 2009, MNRAS, 396, 1596
- Bastian et al. (2017) Bastian, N., Cabrera-Ziri, I., Niederhofer, F., de Mink, S., Georgy, C., Baade, D., Correnti, M., Usher, C., & Romaniello, M. 2017, MNRAS, 465, 4795
- Bastian & de Mink (2009) Bastian, N. & de Mink, S. E. 2009, MNRAS, 398, L11
- Bastian et al. (2018) Bastian, N., Kamann, S., Cabrera-Ziri, I., Georgy, C., Ekström, S., Charbonnel, C., de Juan Ovelar, M., & Usher, C. 2018, MNRAS, 480, 3739
- Bastian & Lardo (2018) Bastian, N. & Lardo, C. 2018, Annual Review of Astronomy and Astrophysics, 56, 83
- Bastian et al. (2016) Bastian, N., Niederhofer, F., Kozhurina-Platais, V., Salaris, M., Larsen, S., Cabrera-Ziri, I., Cordero, M., Ekström, S., Geisler, D., Georgy, C., Hilker, M., Kacharov, N., Li, C., Mackey, D., Mucciarelli, A., & Platais, I. 2016, MNRAS, 460, L20
- Beasor et al. (2019) Beasor, E. R., Davies, B., Smith, N., & Bastian, N. 2019, MNRAS, 486, 266
- Brandt & Huang (2015) Brandt, T. D. & Huang, C. X. 2015, ApJ, 807, 25
- Bressan et al. (2012) Bressan, A., Marigo, P., Girardi, L., Salasnich, B., Dal Cero, C., Rubele, S., & Nanni, A. 2012, MNRAS, 427, 127
- Brott et al. (2011) Brott, I., de Mink, S. E., Cantiello, M., Langer, N., de Koter, A., Evans, C. J., Hunter, I., Trundle, C., & Vink, J. S. 2011, A&A, 530, A115
- Cabrera-Cano & Alfaro (1990) Cabrera-Cano, J. & Alfaro, E. J. 1990, A&A, 235, 94
- Cabrera-Ziri et al. (2014) Cabrera-Ziri, I., Bastian, N., Davies, B., Magris, G., Bruzual, G., & Schweizer, F. 2014, MNRAS, 441, 2754
- Cabrera-Ziri et al. (2016) Cabrera-Ziri, I., Bastian, N., Hilker, M., Davies, B., Schweizer, F., Kruijssen, J. M. D., Mejía-Narváez, A., Niederhofer, F., Brandt, T. D., Rejkuba, M., Bruzual, G., & Magris, G. 2016, MNRAS, 457, 809
- Cabrera-Ziri et al. (2018) Cabrera-Ziri, I., Martocchia, S., Hollyhead, K., & Bastian, N. 2018, Memorie della Societa Astronomica Italiana, 89, 24
- Choi et al. (2016) Choi, J., Dotter, A., Conroy, C., Cantiello, M., Paxton, B., & Johnson, B. D. 2016, ApJ, 823, 102
- Conroy & Spergel (2011) Conroy, C. & Spergel, D. N. 2011, ApJ, 726, 36
- Cordoni et al. (2018) Cordoni, G., Milone, A. P., Marino, A. F., Di Criscienzo, M., D’Antona, F., Dotter, A., Lagioia, E. P., & Tailo, M. 2018, ApJ, 869, 139
- Correnti et al. (2017) Correnti, M., Goudfrooij, P., Bellini, A., Kalirai, J. S., & Puzia, T. H. 2017, MNRAS, 467, 3628
- Correnti et al. (2014) Correnti, M., Goudfrooij, P., Kalirai, J. S., Girardi, L., Puzia, T. H., & Kerber, L. 2014, ApJ, 793, 121
- Costa et al. (2019a) Costa, G., Girardi, L., Bressan, A., Chen, Y., Goudfrooij, P., Marigo, P., Rodrigues, T. S., & Lanza, A. 2019a, arXiv e-prints, arXiv:1909.01907
- Costa et al. (2019b) Costa, G., Girardi, L., Bressan, A., Marigo, P., Rodrigues, T. S., Chen, Y., Lanza, A., & Goudfrooij, P. 2019b, MNRAS, 701
- Dalcanton et al. (2012) Dalcanton, J. J., Williams, B. F., Lang, D., Lauer, T. R., Kalirai, J. S., Seth, A. C., Dolphin, A., Rosenfield, P., Weisz, D. R., Bell, E. F., Bianchi, L. C., Boyer, M. L., Caldwell, N., Dong, H., Dorman, C. E., Gilbert, K. M., Girardi, L., Gogarten, S. M., Gordon, K. D., Guhathakurta, P., Hodge, P. W., Holtzman, J. A., Johnson, L. C., Larsen, S. S., Lewis, A., Melbourne, J. L., Olsen, K. A. G., Rix, H.-W., Rosema, K., Saha, A., Sarajedini, A., Skillman, E. D., & Stanek, K. Z. 2012, The Astrophysical Journal Supplement Series, 200, 18
- Dalcanton et al. (2009) Dalcanton, J. J., Williams, B. F., Seth, A. C., Dolphin, A., Holtzman, J., Rosema, K., Skillman, E. D., Cole, A., Girardi, L., Gogarten, S. M., Karachentsev, I. D., Olsen, K., Weisz, D., Christensen, C., Freeman, K., Gilbert, K., Gallart, C., Harris, J., Hodge, P., de Jong, R. S., Karachentseva, V., Mateo, M., Stetson, P. B., Tavarez, M., Zaritsky, D., Governato, F., & Quinn, T. 2009, The Astrophysical Journal Supplement Series, 183, 67
- Dalessandro et al. (2019) Dalessandro, E., Ferraro, F. R., Bastian, N., Cadelano, M., Lanzoni, B., & Raso, S. 2019, A&A, 621, A45
- D’Antona et al. (2018) D’Antona, F., Milone, A., Tailo, M., Ventura, P., Vesperini, E., & Di Criscienzo, M. 2018, Memorie della Societa Astronomica Italiana, 89, 42
- D’Antona et al. (2017) D’Antona, F., Milone, A. P., Tailo, M., Ventura, P., Vesperini, E., & di Criscienzo, M. 2017, Nature Astronomy, 1, 0186
- Dolphin (2000) Dolphin, A. E. 2000, Publications of the Astronomical Society of the Pacific, 112, 1383
- Dolphin (2002) —. 2002, MNRAS, 332, 91
- Dupree et al. (2017) Dupree, A. K., Dotter, A., Johnson, C. I., Marino, A. F., Milone, A. P., Bailey, J. I., I., Crane, J. D., Mateo, M., & Olszewski, E. W. 2017, ApJ, 846, L1
- Ekström et al. (2012) Ekström, S., Georgy, C., Eggenberger, P., Meynet, G., Mowlavi, N., Wyttenbach, A., Granada, A., Decressin, T., Hirschi, R., Frischknecht, U., Charbonnel, C., & Maeder, A. 2012, A&A, 537, A146
- Endal & Sofia (1978) Endal, A. S. & Sofia, S. 1978, ApJ, 220, 279
- Espinosa Lara & Rieutord (2011) Espinosa Lara, F. & Rieutord, M. 2011, A&A, 533, A43
- Foreman-Mackey et al. (2013) Foreman-Mackey, D., Hogg, D. W., Lang, D., & Goodman, J. 2013, Publications of the Astronomical Society of the Pacific, 125, 306
- Fuller et al. (2019) Fuller, J., Piro, A. L., & Jermyn, A. S. 2019, MNRAS, 505
- Gaia Collaboration et al. (2018) Gaia Collaboration, Brown, A. G. A., Vallenari, A., Prusti, T., de Bruijne, J. H. J., Babusiaux, C., Bailer-Jones, C. A. L., Biermann, M., Evans, D. W., Eyer, L., & et al. 2018, A&A, 616, A1
- Gaia Collaboration et al. (2016) Gaia Collaboration, Brown, A. G. A., Vallenari, A., Prusti, T., de Bruijne, J. H. J., Mignard, F., Drimmel, R., Babusiaux, C., Bailer-Jones, C. A. L., Bastian, U., & et al. 2016, A&A, 595, A2
- Garraffo et al. (2016) Garraffo, C., Drake, J. J., & Cohen, O. 2016, A&A, 595, A110
- Garraffo et al. (2018) Garraffo, C., Drake, J. J., Dotter, A., Choi, J., Burke, D. J., Moschou, S. P., Alvarado-Gómez, J. D., Kashyap, V. L., & Cohen, O. 2018, ApJ, 862, 90
- Georgy et al. (2019) Georgy, C., Charbonnel, C., Amard, L., Bastian, N., Ekström, S., Lardo, C., Palacios, A., Eggenberger, P., Cabrera-Ziri, I., Gallet, F., & Lagarde, N. 2019, A&A, 622, A66
- Georgy et al. (2014) Georgy, C., Granada, A., Ekström, S., Meynet, G., Anderson, R. I., Wyttenbach, A., Eggenberger, P., & Maeder, A. 2014, A&A, 566, A21
- Girardi (1999) Girardi, L. 1999, MNRAS, 308, 818
- Girardi et al. (2011) Girardi, L., Eggenberger, P., & Miglio, A. 2011, MNRAS, 412, L103
- Glatt et al. (2008) Glatt, K., Grebel, E. K., Sabbi, E., Gallagher, John S., I., Nota, A., Sirianni, M., Clementini, G., Tosi, M., Harbeck, D., Koch, A., Kayser, A., & Da Costa, G. 2008, AJ, 136, 1703
- Gossage et al. (2018) Gossage, S., Conroy, C., Dotter, A., Choi, J., Rosenfield, P., Cargile, P., & Dolphin, A. 2018, ApJ, 863, 67
- Goudfrooij et al. (2018) Goudfrooij, P., Girardi, L., Bellini, A., Bressan, A., Correnti, M., & Costa, G. 2018, ApJ, 864, L3
- Goudfrooij et al. (2017) Goudfrooij, P., Girardi, L., & Correnti, M. 2017, ApJ, 846, 22
- Goudfrooij et al. (2014) Goudfrooij, P., Girardi, L., Kozhurina-Platais, V., Kalirai, J. S., Platais, I., Puzia, T. H., Correnti, M., Bressan, A., Chandar, R., Kerber, L., Marigo, P., & Rubele, S. 2014, ApJ, 797, 35
- Goudfrooij et al. (2015) Goudfrooij, P., Girardi, L., Rosenfield, P., Bressan, A., Marigo, P., Correnti, M., & Puzia, T. H. 2015, MNRAS, 450, 1693
- Goudfrooij et al. (2011a) Goudfrooij, P., Puzia, T. H., Chandar, R., & Kozhurina-Platais, V. 2011a, ApJ, 737, 4
- Goudfrooij et al. (2009) Goudfrooij, P., Puzia, T. H., Kozhurina-Platais, V., & Chandar, R. 2009, AJ, 137, 4988
- Goudfrooij et al. (2011b) —. 2011b, ApJ, 737, 3
- Granada et al. (2018) Granada, A., Jones, C. E., Sigut, T. A. A., Semaan, T., Georgy, C., Meynet, G., & Ekström, S. 2018, AJ, 155, 50
- Johnston et al. (2019) Johnston, C., Aerts, C., Pedersen, M. G., & Bastian, N. 2019, arXiv e-prints, arXiv:1910.00591
- Keller et al. (2011) Keller, S. C., Mackey, A. D., & Da Costa, G. S. 2011, ApJ, 731, 22
- Kippenhahn & Thomas (1970) Kippenhahn, R. & Thomas, H.-C. 1970, in IAU Colloq. 4: Stellar Rotation, ed. A. Slettebak, 20
- Kroupa (2001) Kroupa, P. 2001, MNRAS, 322, 231
- Kurucz (1970) Kurucz, R. L. 1970, SAO Special Report, 309
- Kurucz (1993) —. 1993, SYNTHE spectrum synthesis programs and line data
- Li et al. (2014) Li, C., de Grijs, R., & Deng, L. 2014, Nature, 516, 367
- Li et al. (2017) Li, C., de Grijs, R., Deng, L., & Milone, A. P. 2017, ApJ, 844, 119
- Li et al. (2019) Li, C., Sun, W., Hong, J., Deng, L., de Grijs, R., & Sills, A. 2019, ApJ, 871, 171
- Li et al. (2012) Li, Z., Mao, C., Chen, L., & Zhang, Q. 2012, ApJ, 761, L22
- Li et al. (2016) Li, Z., Mao, C., Zhang, L., Zhang, X., & Chen, L. 2016, The Astrophysical Journal Supplement Series, 225, 7
- Lucy (1967) Lucy, L. B. 1967, ZAp, 65, 89
- Mackey & Broby Nielsen (2007) Mackey, A. D. & Broby Nielsen, P. 2007, MNRAS, 379, 151
- Mackey et al. (2008) Mackey, A. D., Broby Nielsen, P., Ferguson, A. M. N., & Richardson, J. C. 2008, ApJ, 681, L17
- Mackey et al. (2013) Mackey, A. D., Da Costa, G. S., Ferguson, A. M. N., & Yong, D. 2013, ApJ, 762, 65
- Maeder (2009) Maeder, A. 2009, Physics, Formation and Evolution of Rotating Stars
- Maeder & Meynet (2000) Maeder, A. & Meynet, G. 2000, A&A, 361, 159
- Maeder & Meynet (2010) —. 2010, New Astronomy Reviews, 54, 32
- Maeder & Zahn (1998) Maeder, A. & Zahn, J.-P. 1998, A&A, 334, 1000
- Marigo et al. (2008) Marigo, P., Girardi, L., Bressan, A., Groenewegen, M. A. T., Silva, L., & Granato, G. L. 2008, A&A, 482, 883
- Marino et al. (2018a) Marino, A. F., Milone, A. P., Casagrande, L., Przybilla, N., Balaguer-Núñez, L., Di Criscienzo, M., Serenelli, A., & Vilardell, F. 2018a, ApJ, 863, L33
- Marino et al. (2018b) Marino, A. F., Przybilla, N., Milone, A. P., Da Costa, G., D’Antona, F., Dotter, A., & Dupree, A. 2018b, AJ, 156, 116
- Martocchia et al. (2018) Martocchia, S., Niederhofer, F., Dalessandro, E., Bastian, N., Kacharov, N., Usher, C., Cabrera-Ziri, I., Lardo, C., Cassisi, S., Geisler, D., Hilker, M., Hollyhead, K., Kozhurina-Platais, V., Larsen, S., Mackey, D., Mucciarelli, A., Platais, I., & Salaris, M. 2018, MNRAS, 477, 4696
- Matt et al. (2015) Matt, S. P., Brun, A. S., Baraffe, I., Bouvier, J., & Chabrier, G. 2015, ApJ, 799, L23
- McLaughlin & van der Marel (2005) McLaughlin, D. E. & van der Marel, R. P. 2005, The Astrophysical Journal Supplement Series, 161, 304
- Meynet & Maeder (2000) Meynet, G. & Maeder, A. 2000, A&A, 361, 101
- Milone et al. (2009) Milone, A. P., Bedin, L. R., Piotto, G., & Anderson, J. 2009, A&A, 497, 755
- Milone et al. (2016) Milone, A. P., Marino, A. F., D’Antona, F., Bedin, L. R., Da Costa, G. S., Jerjen, H., & Mackey, A. D. 2016, MNRAS, 458, 4368
- Milone et al. (2017) Milone, A. P., Marino, A. F., D’Antona, F., Bedin, L. R., Piotto, G., Jerjen, H., Anderson, J., Dotter, A., di Criscienzo, M., & Lagioia, E. P. 2017, MNRAS, 465, 4363
- Milone et al. (2018) Milone, A. P., Marino, A. F., Di Criscienzo, M., D’Antona, F., Bedin, L. R., Da Costa, G., Piotto, G., Tailo, M., Dotter, A., Angeloni, R., Anderson, J., Jerjen, H., Li, C., Dupree, A., Granata, V., Lagioia, E. P., Mackey, A. D., Nardiello, D., & Vesperini, E. 2018, MNRAS, 477, 2640
- Niederhofer et al. (2016) Niederhofer, F., Bastian, N., Kozhurina-Platais, V., Hilker, M., de Mink, S. E., Cabrera-Ziri, I., Li, C., & Ercolano, B. 2016, A&A, 586, A148
- Niederhofer et al. (2015) Niederhofer, F., Georgy, C., Bastian, N., & Ekström, S. 2015, MNRAS, 453, 2070
- Paxton et al. (2011) Paxton, B., Bildsten, L., Dotter, A., Herwig, F., Lesaffre, P., & Timmes, F. 2011, ApJS, 192, 3
- Paxton et al. (2013) Paxton, B., Cantiello, M., Arras, P., Bildsten, L., Brown, E. F., Dotter, A., Mankovich, C., Montgomery, M. H., Stello, D., Timmes, F. X., & Townsend, R. 2013, ApJS, 208, 4
- Paxton et al. (2015) Paxton, B., Marchant, P., Schwab, J., Bauer, E. B., Bildsten, L., Cantiello, M., Dessart, L., Farmer, R., Hu, H., Langer, N., Townsend, R. H. D., Townsley, D. M., & Timmes, F. X. 2015, ApJS, 220, 15
- Paxton et al. (2018) Paxton, B., Schwab, J., Bauer, E. B., Bildsten, L., Blinnikov, S., Duffell, P., Farmer, R., Goldberg, J. A., Marchant, P., Sorokina, E., Thoul, A., Townsend, R. H. D., & Timmes, F. X. 2018, ApJS, 234, 34
- Paxton et al. (2019) Paxton, B., Smolec, R., Gautschy, A., Bildsten, L., Cantiello, M., Dotter, A., Farmer, R., Goldberg, J. A., Jermyn, A. S., Kanbur, S. M., Marchant, P., Schwab, J., Thoul, A., Townsend, R. H. D., Wolf, W. M., Zhang, M., & Timmes, F. X. 2019, arXiv e-prints
- Perren et al. (2015) Perren, G. I., Vázquez, R. A., & Piatti, A. E. 2015, A&A, 576, A6
- Piatti & Bastian (2016) Piatti, A. E. & Bastian, N. 2016, A&A, 590, A50
- Rosenfield et al. (2017) Rosenfield, P., Girardi, L., Williams, B. F., Johnson, L. C., Dolphin, A., Bressan, A., Weisz, D., Dalcanton, J. J., Fouesneau, M., & Kalirai, J. 2017, ApJ, 841, 69
- Rubele et al. (2011) Rubele, S., Girardi, L., Kozhurina-Platais, V., Goudfrooij, P., & Kerber, L. 2011, MNRAS, 414, 2204
- Rubele et al. (2010) Rubele, S., Kerber, L., & Girardi, L. 2010, MNRAS, 403, 1156
- Sadeghi Ardestani et al. (2017) Sadeghi Ardestani, L., Guillot, T., & Morel, P. 2017, MNRAS, 472, 2590
- von Zeipel (1924) von Zeipel, H. 1924, MNRAS, 84, 665
- Williams et al. (2014) Williams, B. F., Lang, D., Dalcanton, J. J., Dolphin, A. E., Weisz, D. R., Bell, E. F., Bianchi, L., Byler, N., Gilbert, K. M., & Girardi, L. 2014, ApJS, 215, 9
- Yang (2018) Yang, W. 2018, ApJ, 860, 132
- Yang et al. (2013) Yang, W., Bi, S., Meng, X., & Liu, Z. 2013, ApJ, 776, 112
- Yang et al. (2011) Yang, W., Meng, X., Bi, S., Tian, Z., Li, T., & Liu, K. 2011, ApJ, 731, L37
- Zahn (1992) Zahn, J. P. 1992, A&A, 265, 115